Data Center Cooling: CRAC/CRAH redundancy, capacity, and selection metrics
Striking the appropriate balance between cost and reliability is a business decision that requires metrics
By Dr. Hussein Shehata
This paper focuses on cooling limitations of down-flow computer room air conditioners/air handlers (CRACs/CRAHs) with dedicated heat extraction solutions in high-density data center cooling applications. The paper also explains how higher redundancy can increase total cost of ownership (TCO) while supporting only very light loads and proposes a metric to help balance the requirements of achieving higher capacities and efficient space utilization.
With several vendors proposing passive high-density technologies (e.g., cabinet hot air removal as a total resolution to the challenge of high density), this analysis shows that such solutions are only possible for a select few cabinets in each row and not for full deployments.
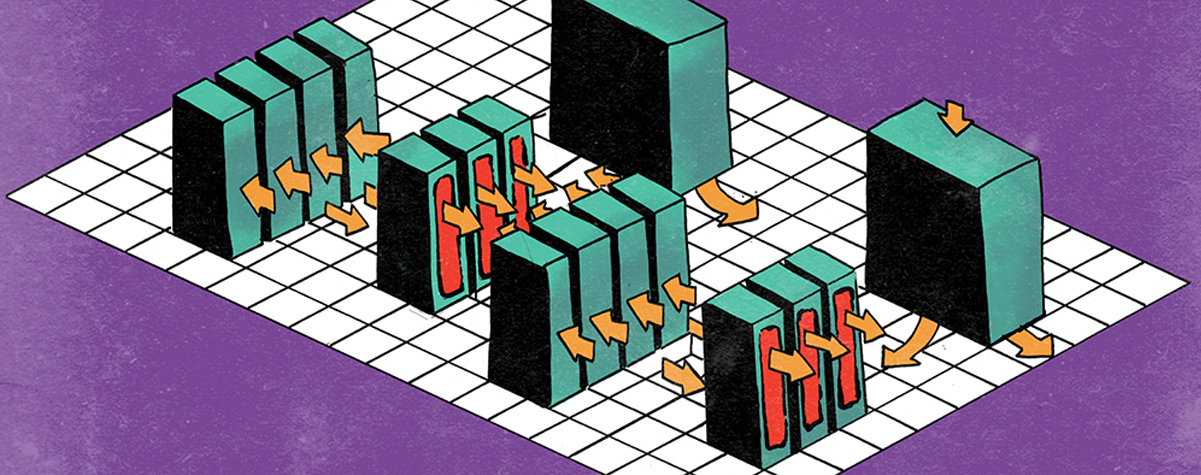
The vendors claim that the technologies can remove heat loads exceeding 20 kilowatts (kW) per cabinet, but our study disproves that claim; passive-cooling units cannot extract more heat than the cold air supplied by the CRACs. For the efficient design of a data center, the aim is to increase the number of cabinets and the total IT load, with the minimal necessary supporting cooling infrastructure. See Figure 1.
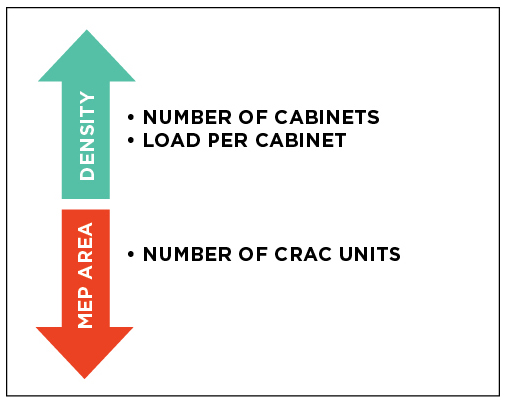
Figure 1. The relationship between IT and supporting spaces
Passive Hot Air Removal
Data center design continually evolves towards increasing capacity and decreasing spatial volume, increasing energy density. High-end applications and equipment have higher energy density than standard equipment; however, the high-performance models of any technology have historically become the market standard with the passage of time, which in the case of the IT industry is a short period. As an example, every 3 years the world’s fastest supercomputers offer 10 times the performance of the previous generation, a trend that has been documented over the past 20 years.
Cooling high-density data centers is mostly commonly achieved by:
• Hot Air Removal (HAR) via cabinet exhaust ducts—active and passive.
See Figure 2.
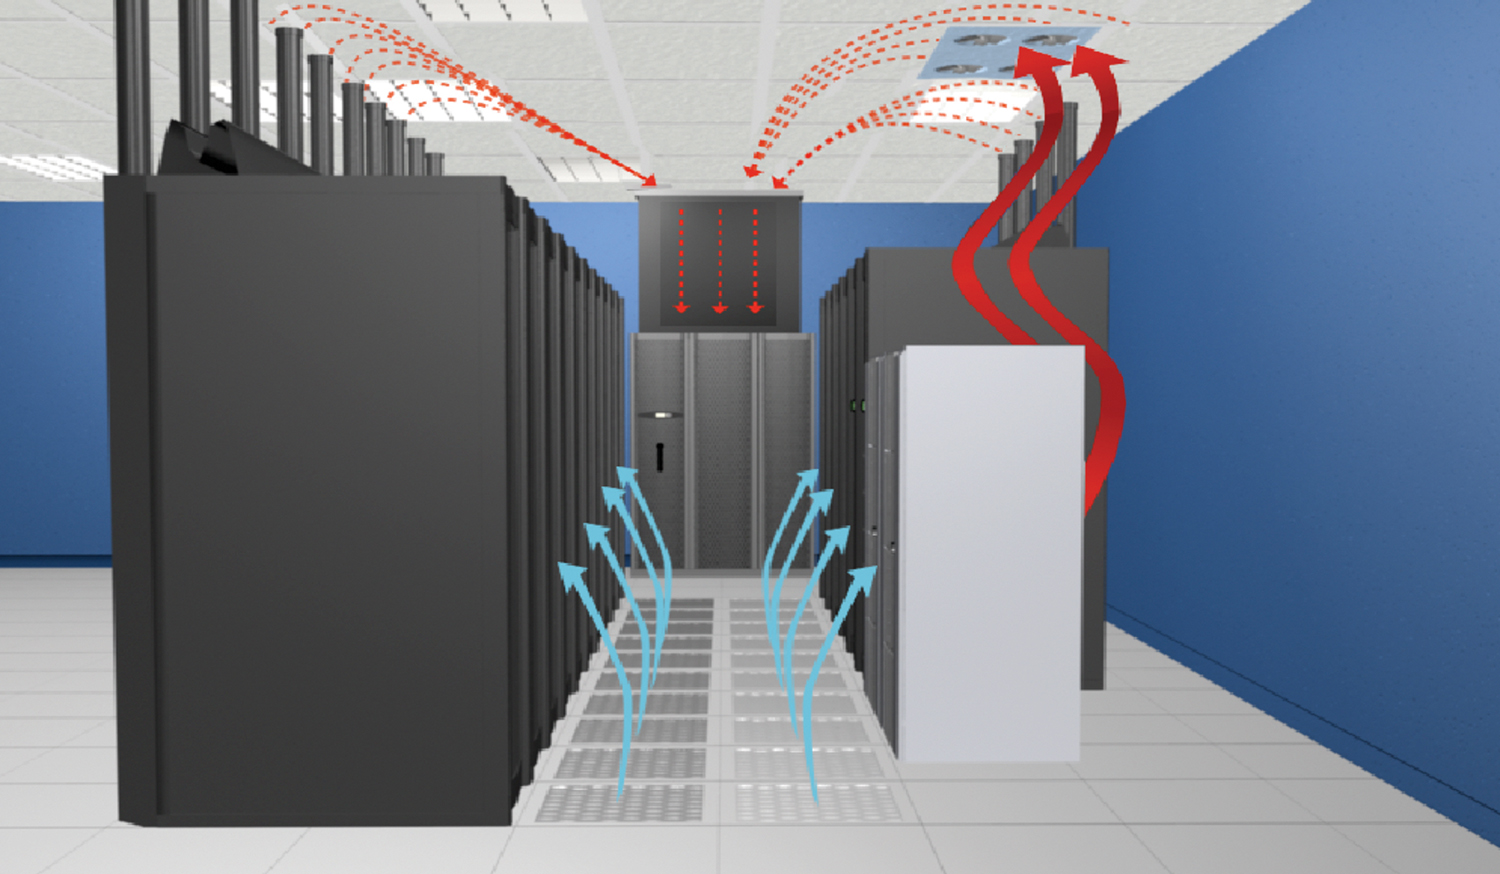
Figure 2. HAR via cabinet exhaust ducts (active and passive). Courtesy APC
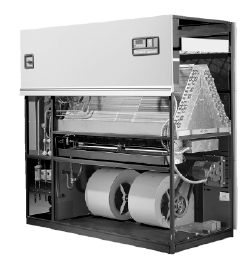
• Dedicated fan-powered cooling units (i.e., chilled water cabinets).
See Figure 3.
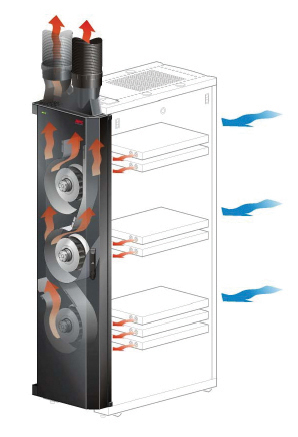
Figure 3. Dedicated fan-powered cooling units
This paper focuses on HAR/CRAC technology using an underfloor air distribution plenum.
Approach
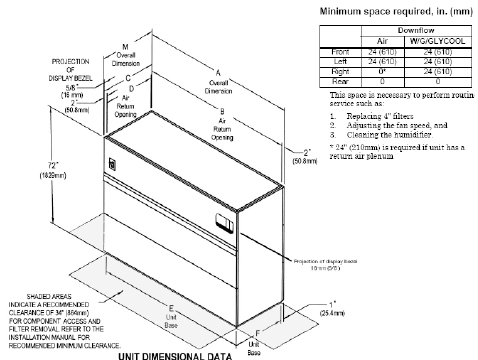
High-density data centers require cooling units that are capable of delivering the highest cooling capacity using the smallest possible footprint. The high-powered CRACs in the smallest footprints available from the major manufacturer offer a net sensible cooling capacity of approximately 90 kW but require 3×1-meter (m) (width by depth) footprints. (Appendix C includes the technical specifications for the example CRAC).
Excluding a detailed heat load estimate and air efficiency distribution effectiveness, the variables of CRAC capacity, cabinet quantity, and cabinet capacity may be related in the following formula.
Note: The formula is simplified and focused on IT cooling requirements, excluding other loads such as lighting and solar gains.
CRAC Capacity = Number of IT cabinets x kW/cabinet (1)
Example 1 for N Capacity: If a 90-kW CRAC cools 90 cabinets, the
average cooling delivered per cabinet is 1 kW.
90 kW= 90 cabinets x 1 kW/cabinet (2)
Example 2 for N Capacity: If a 90-kW CRAC cools two cabinets, the
average cooling delivered per cabinet is 45 kW.
90 kW= 2 cabinets x 45 kW/cabinet (3)
The simplified methodology, however, does not provide practical insight into space usage and heat extraction capability. In Example 1, one CRAC would struggle to efficiently deliver air evenly to all 90 cabinets due to the practical constraints of CRAC airflow throw; in most circumstances the cabinets farthest from the CRAC would likely receive less air then the closer cabinets (assuming practical raised-floor heights and minimal obstructions to under floor airflow).
In Example 2, one CRAC would be capable of supplying sufficient cooling to both cabinets; however, the ratio of space utilization of the CRAC, service access space, and airflow throw buffer would result in a high space usage for the infrastructure compared to prime white space (IT cabinets). Other constraints, such as allocating sufficient perforated floor tiles/grills in case of a raised-floor plenum or additional Cold Aisle containment for maximum air distribution effectiveness may lead to extremely large Cold Aisles that again render the data center space utilization inefficient.
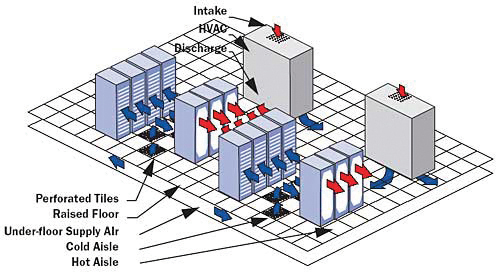
Figure 4. Typical Cold Aisle/Hot Aisle arrangement (ASHRAE TC9.9)
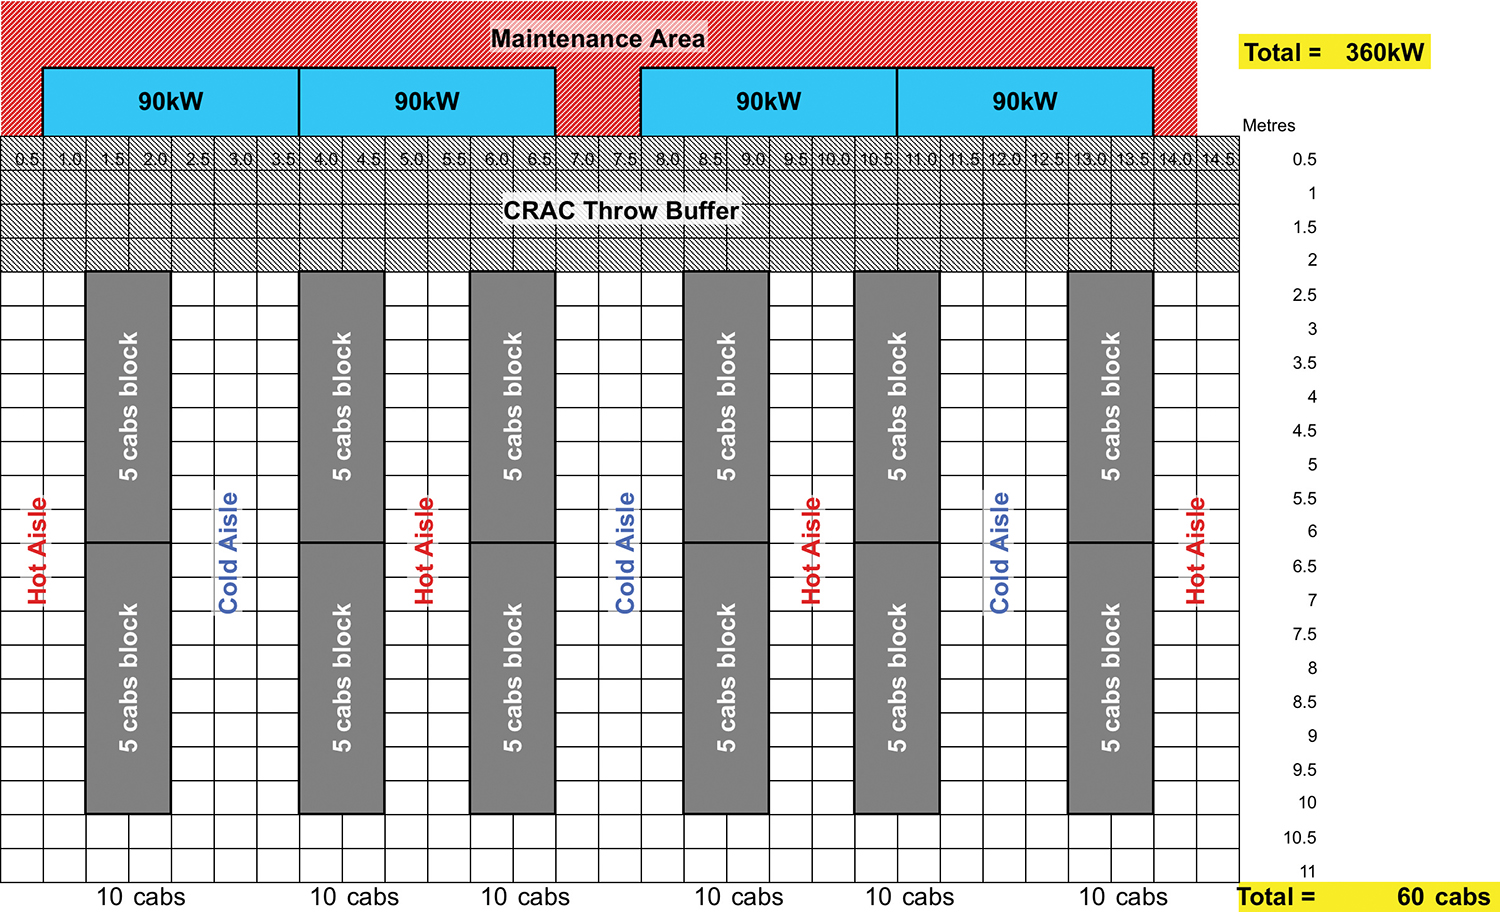
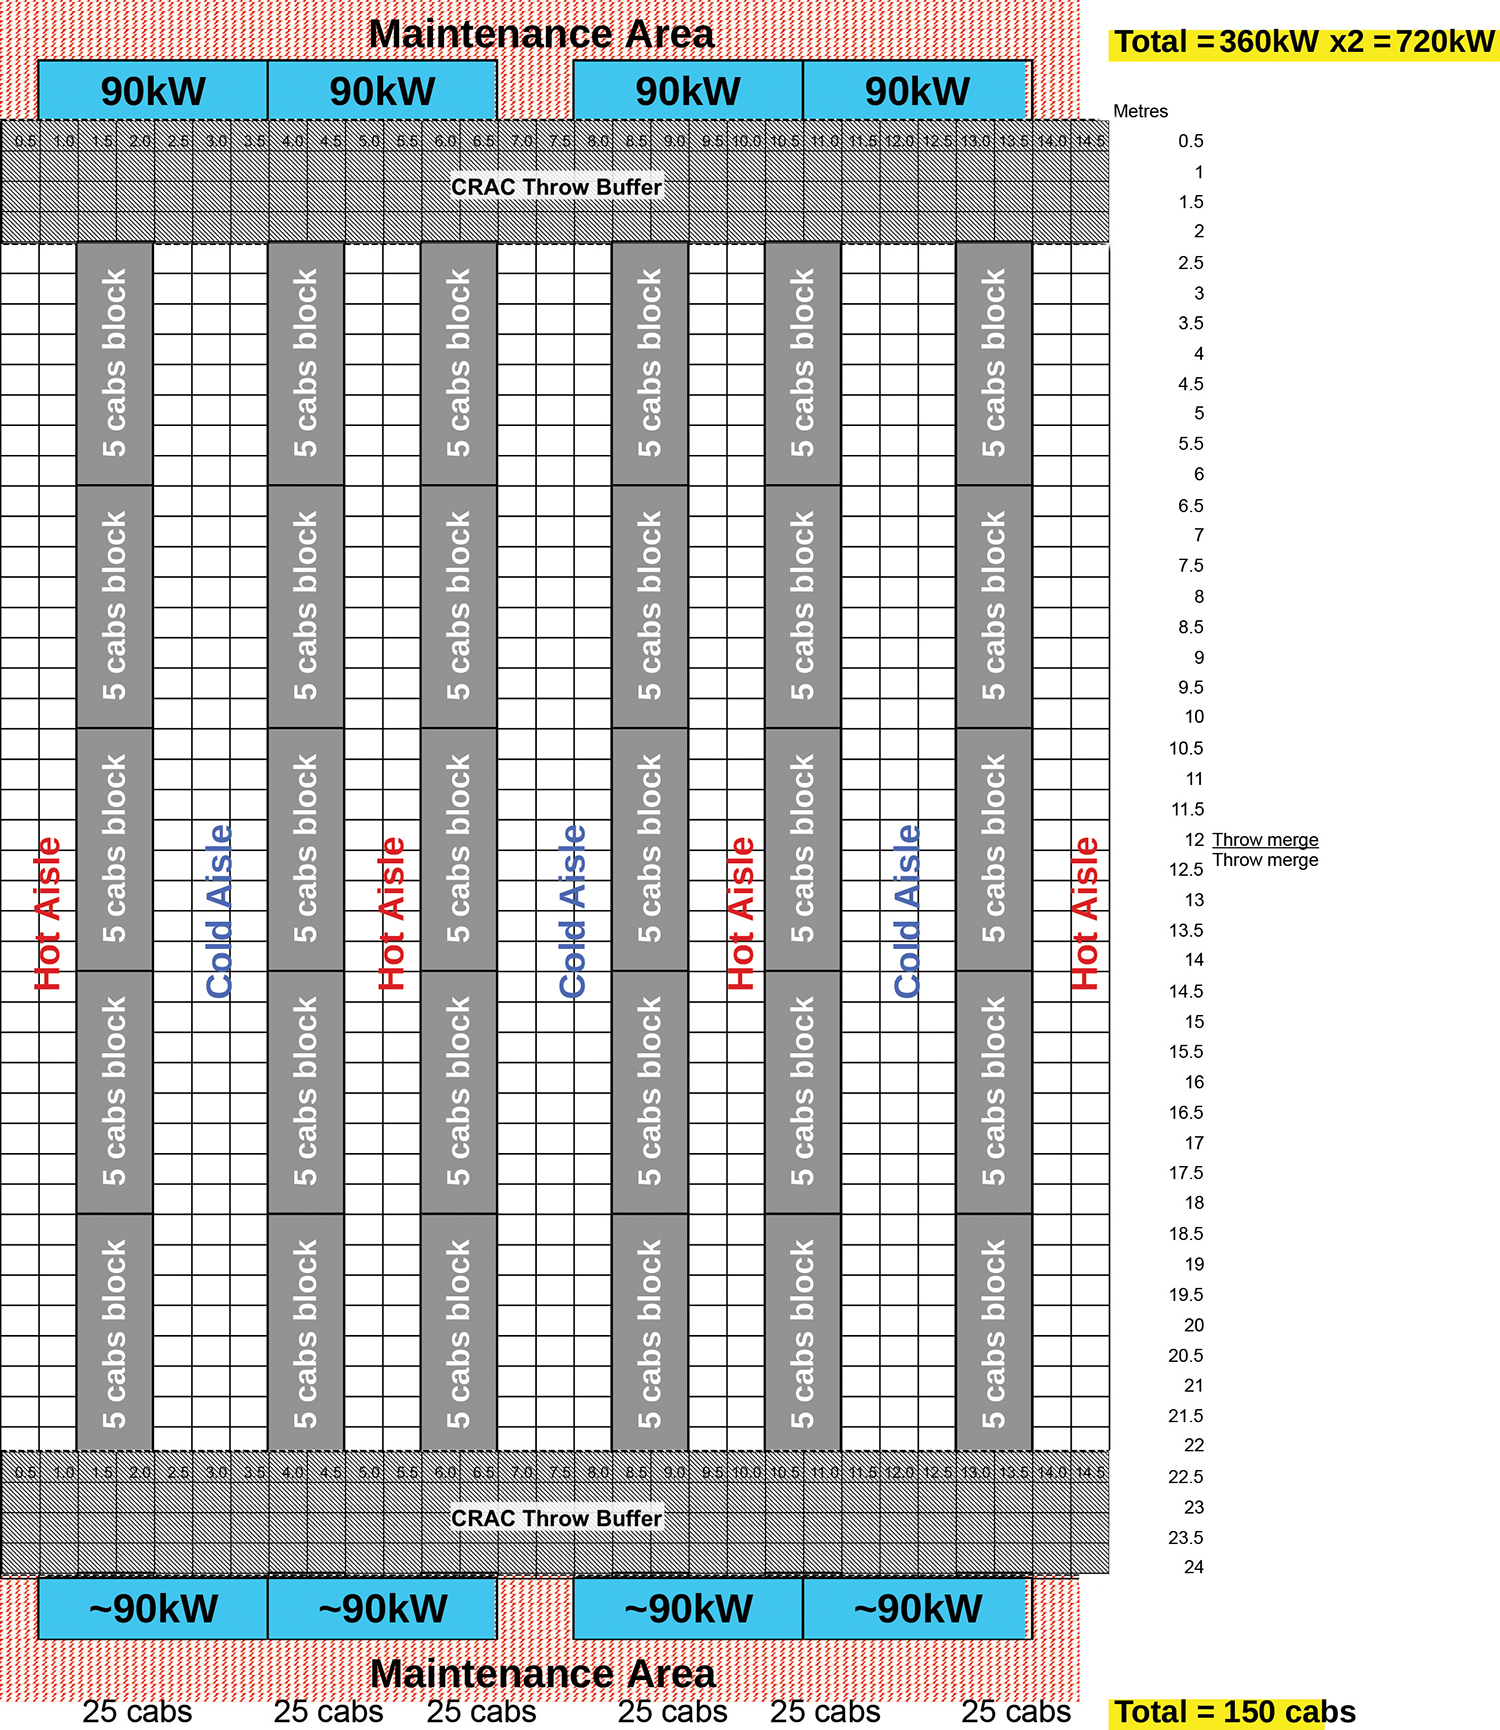
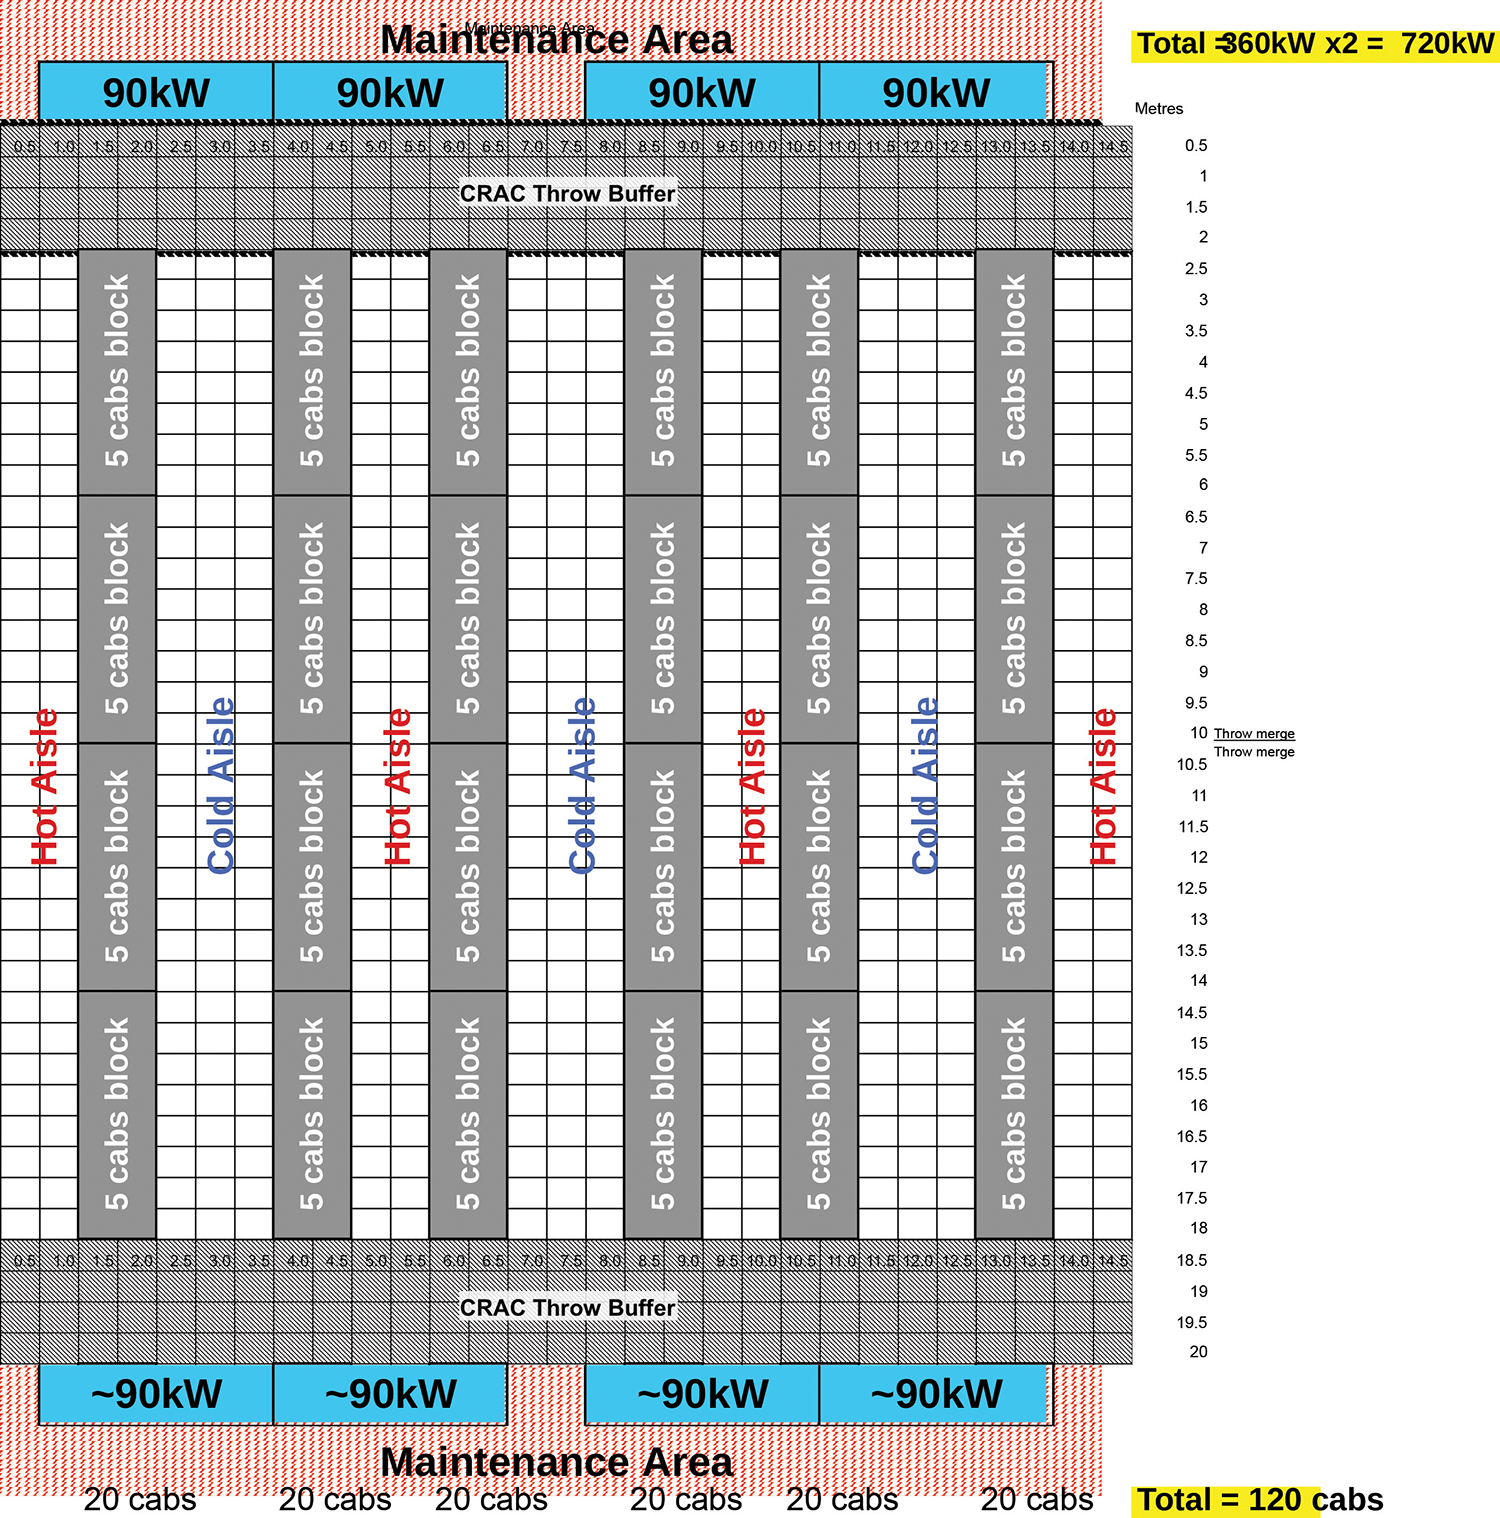
Appendix B includes a number of data center layouts generated to illustrate these concepts. The strategic layouts in this study considered maximum (18 m), average (14 m) and minimal (10 m) practical CRAC air throw, with CRACs installed perpendicular to cabinet rows on one and two sides as recommended in ASHRAE TC9.9. The front-to-back airflow cabinets are assumed to be configured to the best practice of Cold Aisle/Hot Aisle arrangement (See Figure 4). Variation in throw resulted in low, medium, and high cabinet count, best defined as high density, average density, and maximum packed (high number of cabinets) for the same data center whitespace area and electrical load (see Figure 5).
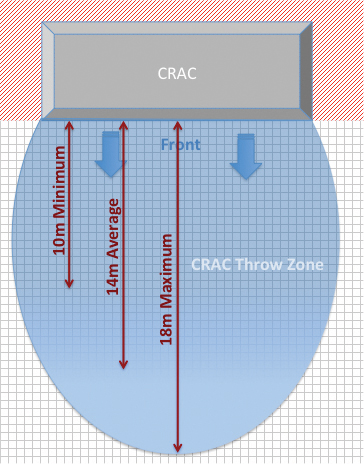
Figure 5. CRAC throw area
In the example layouts, CRACs were placed close together, with the minimal 500-millimeter (mm) maintenance space on one side and 1,000 mm on the long side (see Figure 6). Note that each CRAC manufacturer might have different unit clearance requirements. A minimal 2-m buffer between the nearest cabinet and each CRAC unit prevents entrainment of warm air into the cold air plenum. Cold and Hot aisle widths were modeled on approximately 1,000 mm (hot) and 1,200 mm (cold) as recommended in ASHRAE TC9.9 literature.
In the context of this study, CRAC footprint is defined as the area occupied by CRACs (including maintenance and airflow throw buffer); cabinet footprint is defined as the area occupied by cabinets (and their aisles). These two areas have been compared to analyze the use of prime footprint within the data center hall.
Tier level requires each and every power and cooling component and path to fulfill the Tier requirements; in the context of this paper the redundancy configuration reflects the Tier level of CRAC capacity components only, excluding considerations to other subsystems required for the facility’s operation. Tier I would not require redundant components, hence N CRAC units are employed. Tiers II, III, and IV would require redundant CRACs; therefore N+1 and N+2 configurations were also considered.
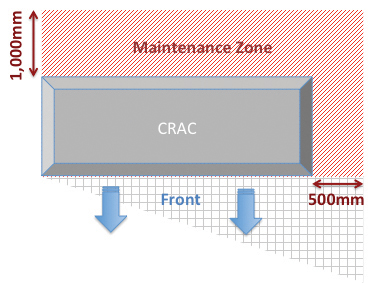
Figure 6. CRAC maintenance zone
A basic analysis shows that using a CRAC as described above would require a 14-m2 area (including throw buffer), which would generate 25.7 kW of cooling for every 1 m of active CRAC perimeter at N redundancy, 19.3 kW for one-sided N+1 redundancy and two-sided N+2 redundancy, 22.5 kW for two-sided N+1 redundancy, and 12.9 kW for one-sided N+2 redundancy. However, data center halls are not predominantly selected and designed based on perimeter length, but rather on floor area.
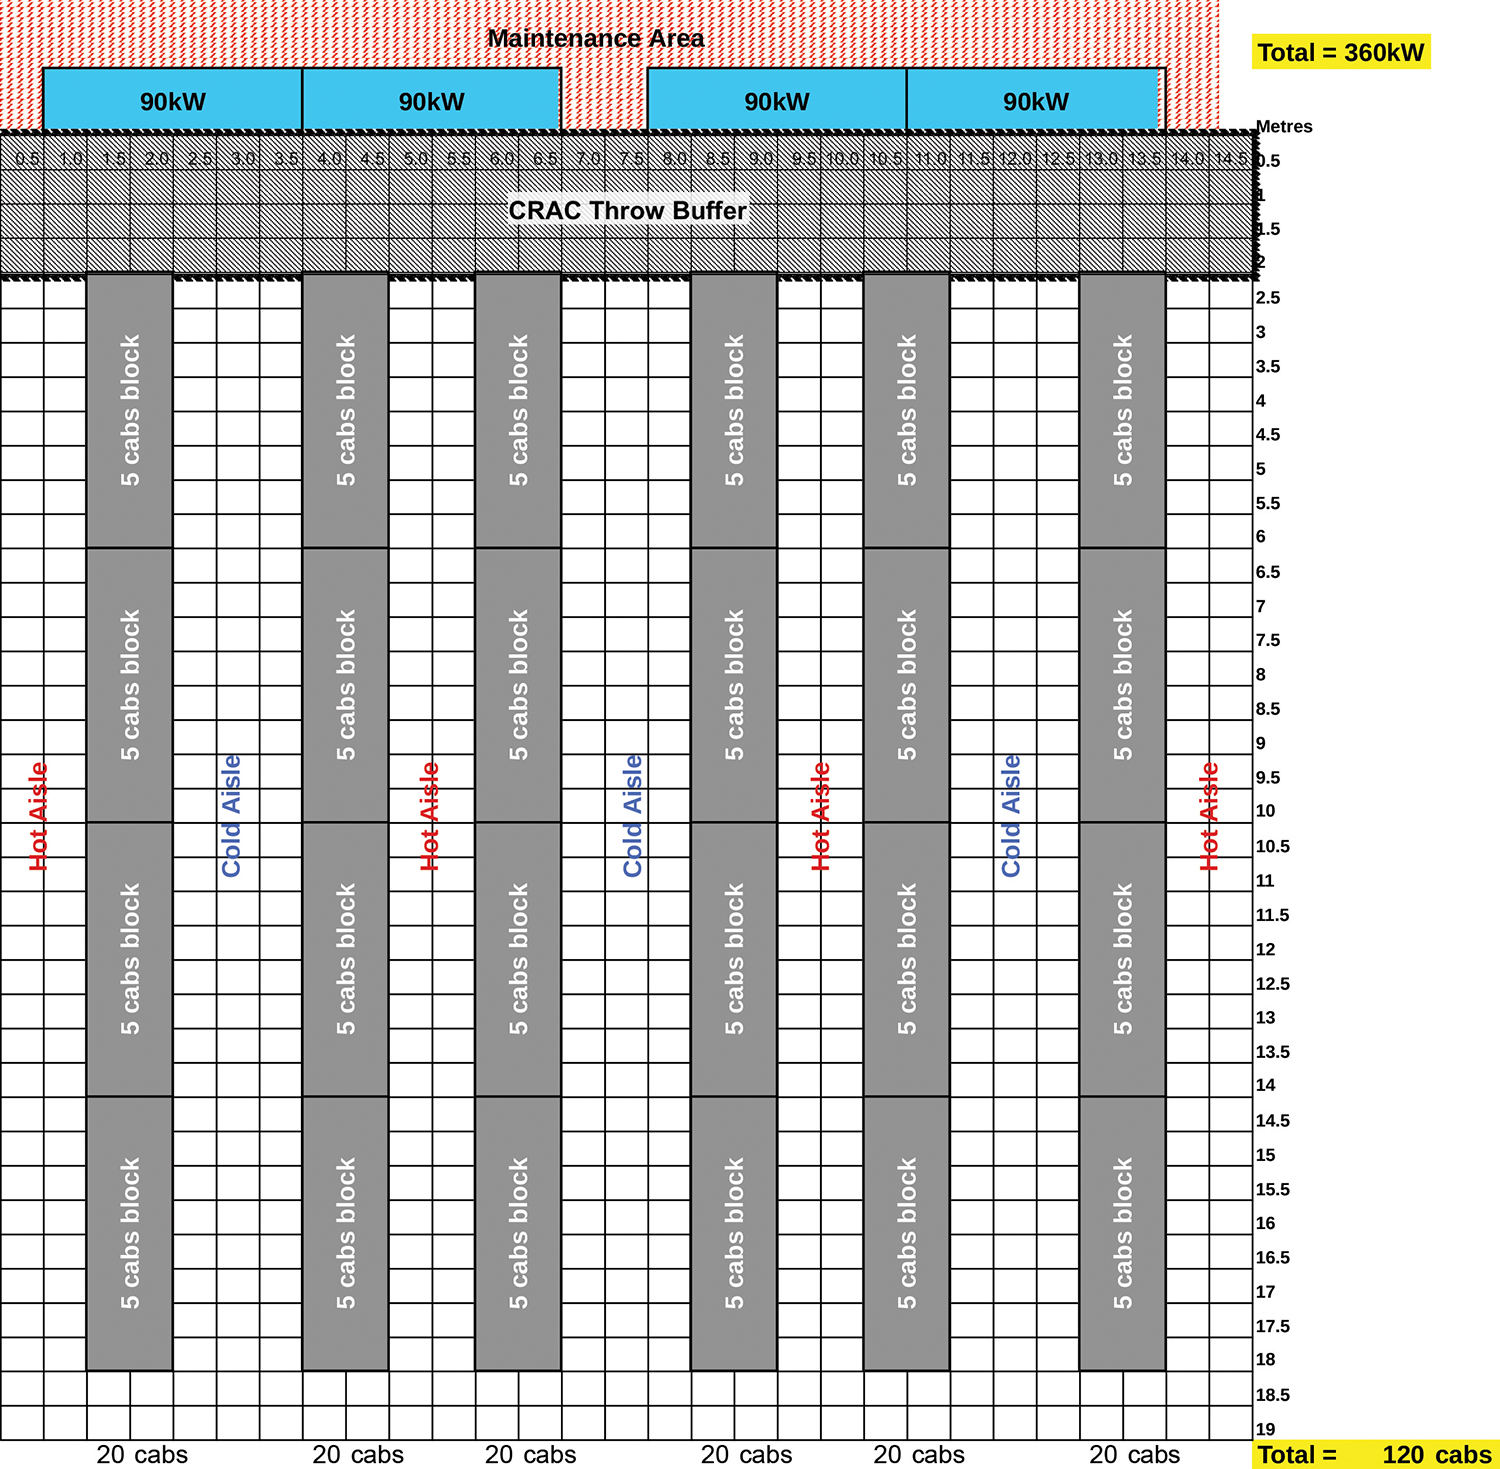
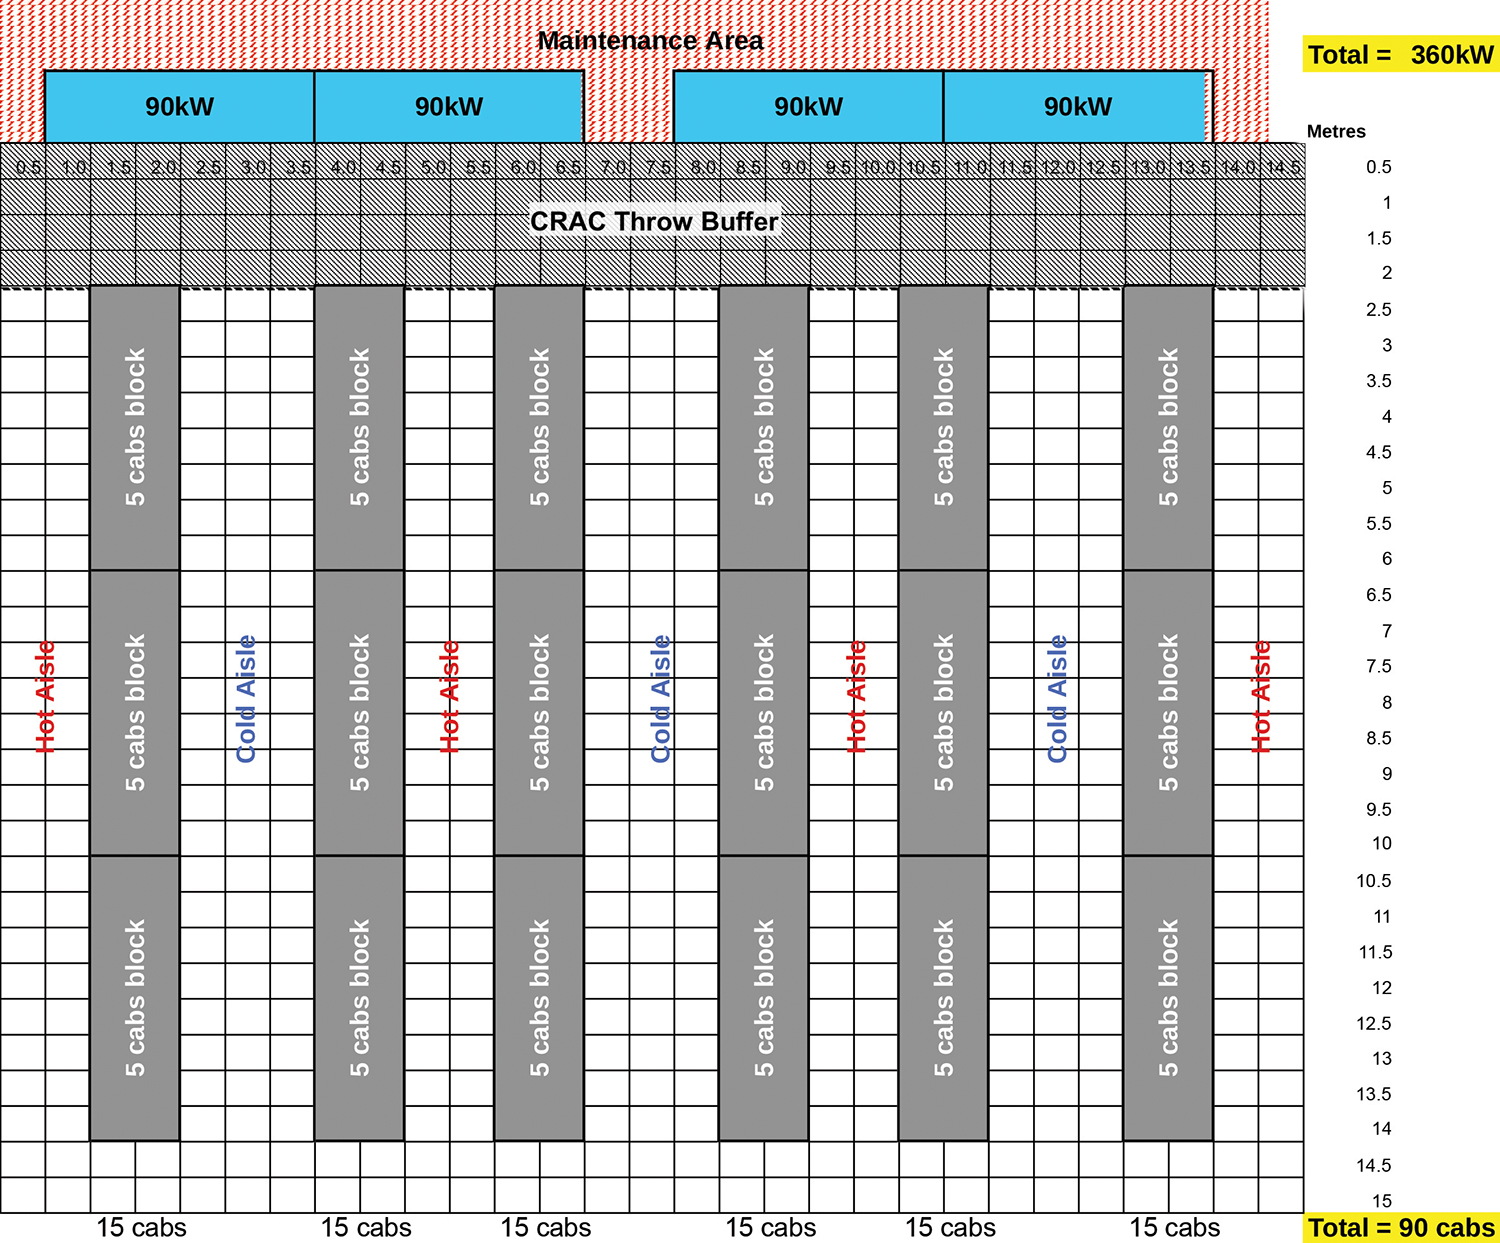
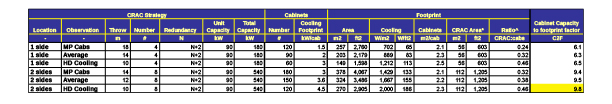
The study focused on identifying the area required by CRAC units, compared to that occupied by IT cabinets, and defines it as a ratio. Figure 7 shows Tier I (N) one-sided CRACs in a high-density cabinet configuration. Appendix A includes the other configuration models.
Furthermore, a metric has been derived to help determine the appropriate cabinet footprint at the required Tier level (considering CRAC redundancy only).
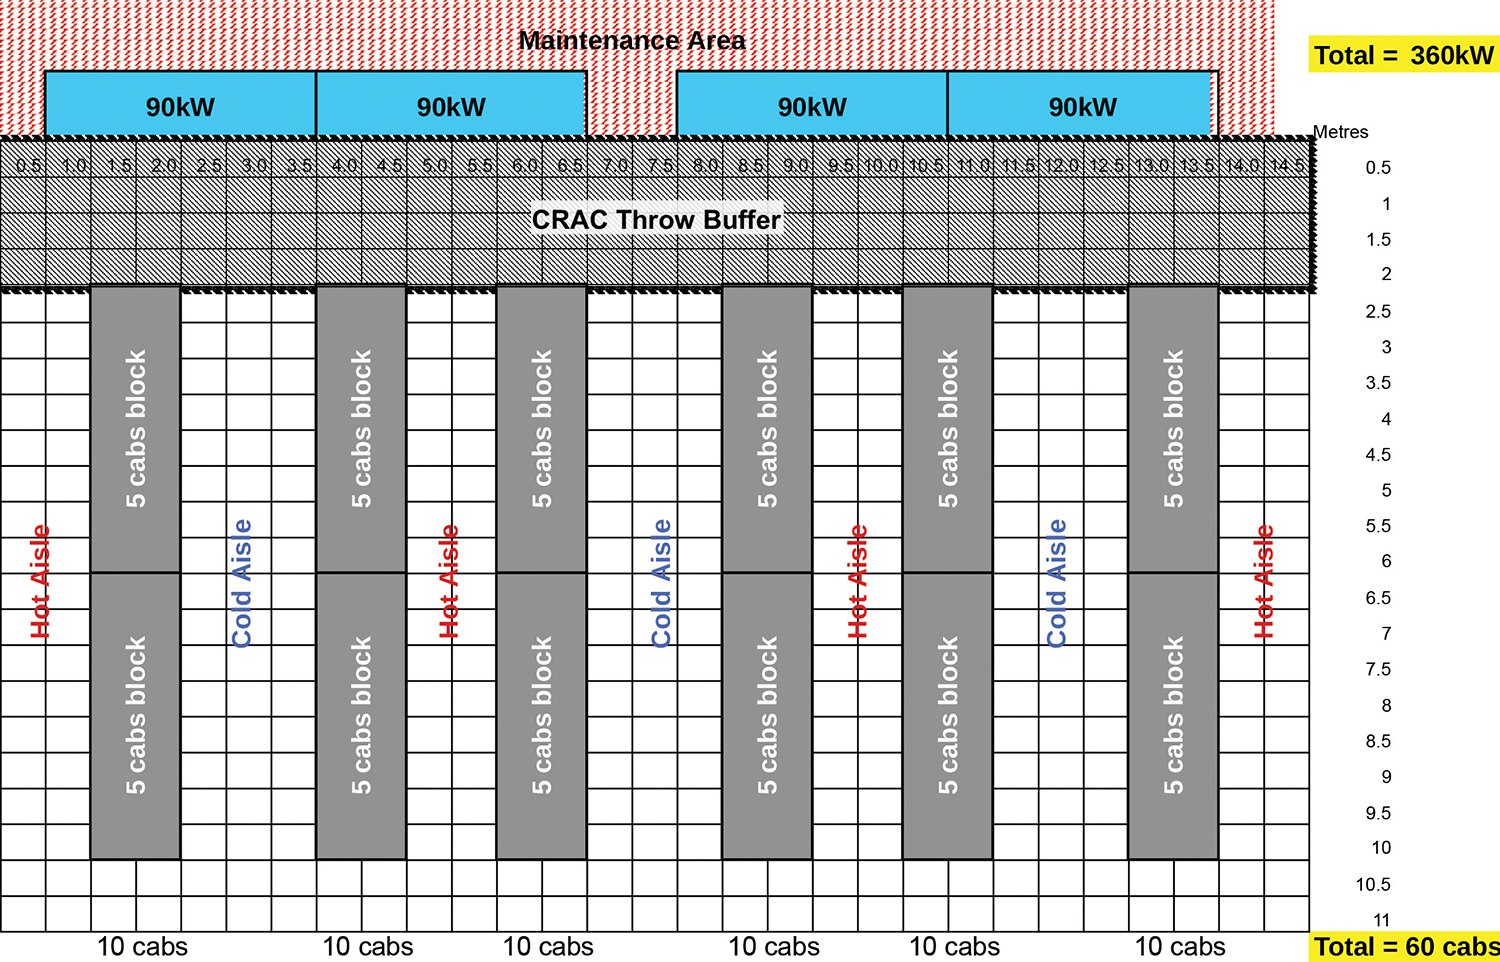
Figure 7. Tier 1 (N) one-sided CRACs in a high-density cabinet configuration
Cabinet capacity to footprint factor C2F= kw/cabinet / C2C (4)
Where CRAC to Cabinet factor C2C= CRAC footprint / Cabinet footprint (5)
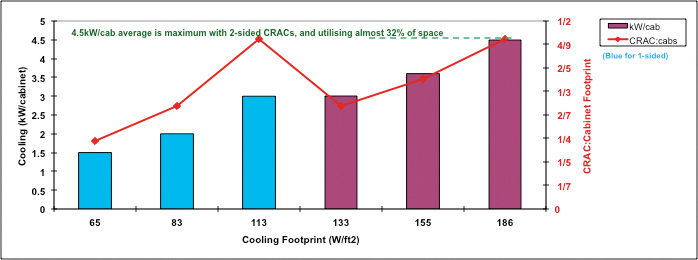
For multiple layout configurations, the higher the C2F, the more IT capacity can be incorporated into the space. Higher capacity could be established by more cabinets at lower densities or by fewer cabinets at higher densities. However, the C2F is closely linked to the necessary CRAC footprint, which as analyzed in this paper, could be a major limiting factor (see Figure 8).
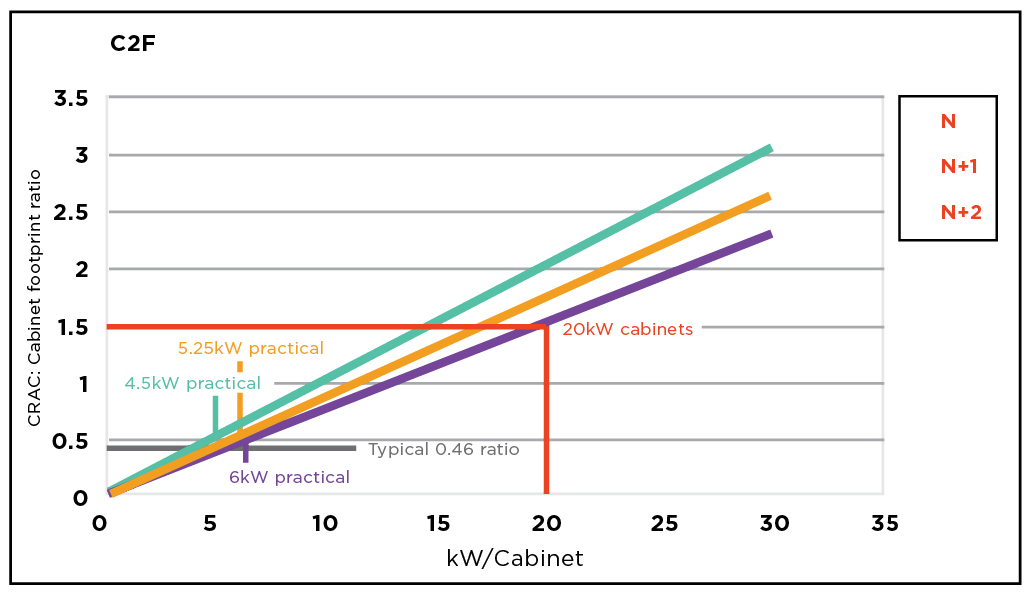
Figure 8. C2F versus cabinet load (kW) for various CRAC redundancies
Results
The detailed results appear in Appendix B. The variations analyzed included reference CRACs with no redundancy, with one redundant unit, and with two redundant units. For each of the CRAC configurations, three cabinet layouts were considered: maximum packed, average density, and high density).
Results showed that the highest C2F based on the six variations within each of the three redundancy configurations is as follows:
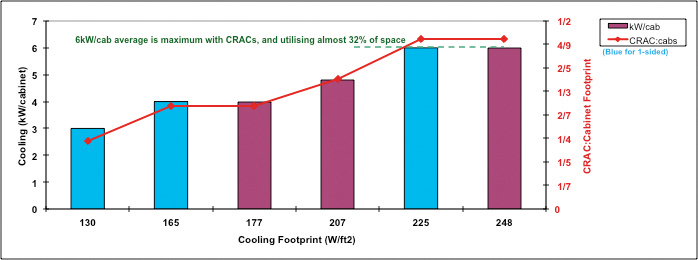
• Tier I (N)–one-sided CRAC deployment: C2F = 13
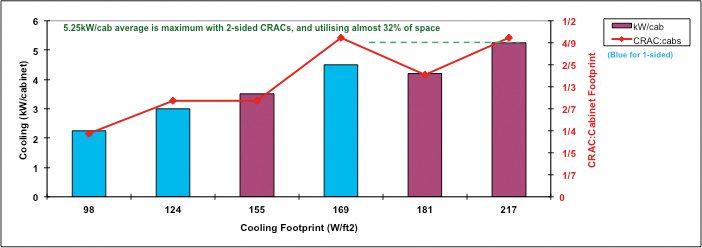
• Tier II-IV (N+1)–two-sided CRAC deployment: C2F = 11.4
• Tier II-IV (N+2 and above)–two-sided CRAC deployment: C2F = 9.8
The noteworthy finding is that the highest C2F in all 18-modeled variations was for high-density implementation and at a CRAC-to-cabinet (C2C) area ratio of 0.46 (i.e., CRACs occupy 32% of the entire space) and a cabinet footprint of 2.3 m2 per cabinet. This is supporting evidence that, although high-density cabinets would require more cooling footprint, high density is the most efficient space utilization per kW of IT.
Example 3 illustrates how the highest C2F on a given CRAC redundancy and one- or two-sided layout may be utilized for sizing the footprint and capacity within an average-sized 186-m2 data center hall for a Tier II-IV (N+2, C2F=9.8, C2C=0.5, and cabinet footprint of 2.3 m2) deployment. The space is divided into a net 124-m2 data hall for cabinets, and 62 m2 of space for CRAC units by utilizing the resulting ideal C2C of 0.46.
Example 3: If a net 124-m2 data hall for cabinets and 62 m2 of space for CRAC units is available, the highest achievable capacity would be 4.5 kW/cabinet.
9.8= 4.5 kW/cabinet/59 m2 : 127 m2 (6)
To determine the number of cabinets and CRACs, the CRAC cooling capability will be used rather than the common method of dividing the area by cabinet footprint.
The total area occupied by a CRAC is 14 m2; hence approximately four CRACs would occupy the 59-m2 space. Two CRACs are duty, since N+2 is utilized; therefore, the available capacity would be 90 kW x 2 = 180 kW. The number of cabinets that could then be installed in this 186-m2 total area would be 180/4.5 = 40 cabinets.
The total effective space used by the 40 cabinets is 92 m2 (40 x 2.3 m2 ) that is 72% of the available cabinet dedicated area. This shows that higher redundancy may be resilient but does not fully utilize the space efficiently. This argument highlights the importance of the debate between resilience and space utilization.
Example 4 illustrates how C2F may be utilized for sizing the footprint and capacity within the same data center hall but at a lower redundancy of N+1 configuration.
Example 4: By applying the same methodology, the highest achievable capacity would be 5.2 kW/cabinet.
11.4= (7)
The total area occupied by a CRAC is 14 m2 (including CRAC throw and maintenance); hence approximately four CRACs would occupy 59 m2 of space. Three CRACs would be on duty, since N+1 is utilized; therefore, the available capacity would be 90 kW x 3 = 270 kW. The number of cabinets that could then be installed in this 186-m2 total area would be 270/5.2 = 52 cabinets.
The total effective space used by the 52 cabinets is 120 m2 (52 x 2.3 m2 ), which is 95% of the space. The comparison of Example 3 to Example 4 shows that less redundancy provides more efficient space utilization.
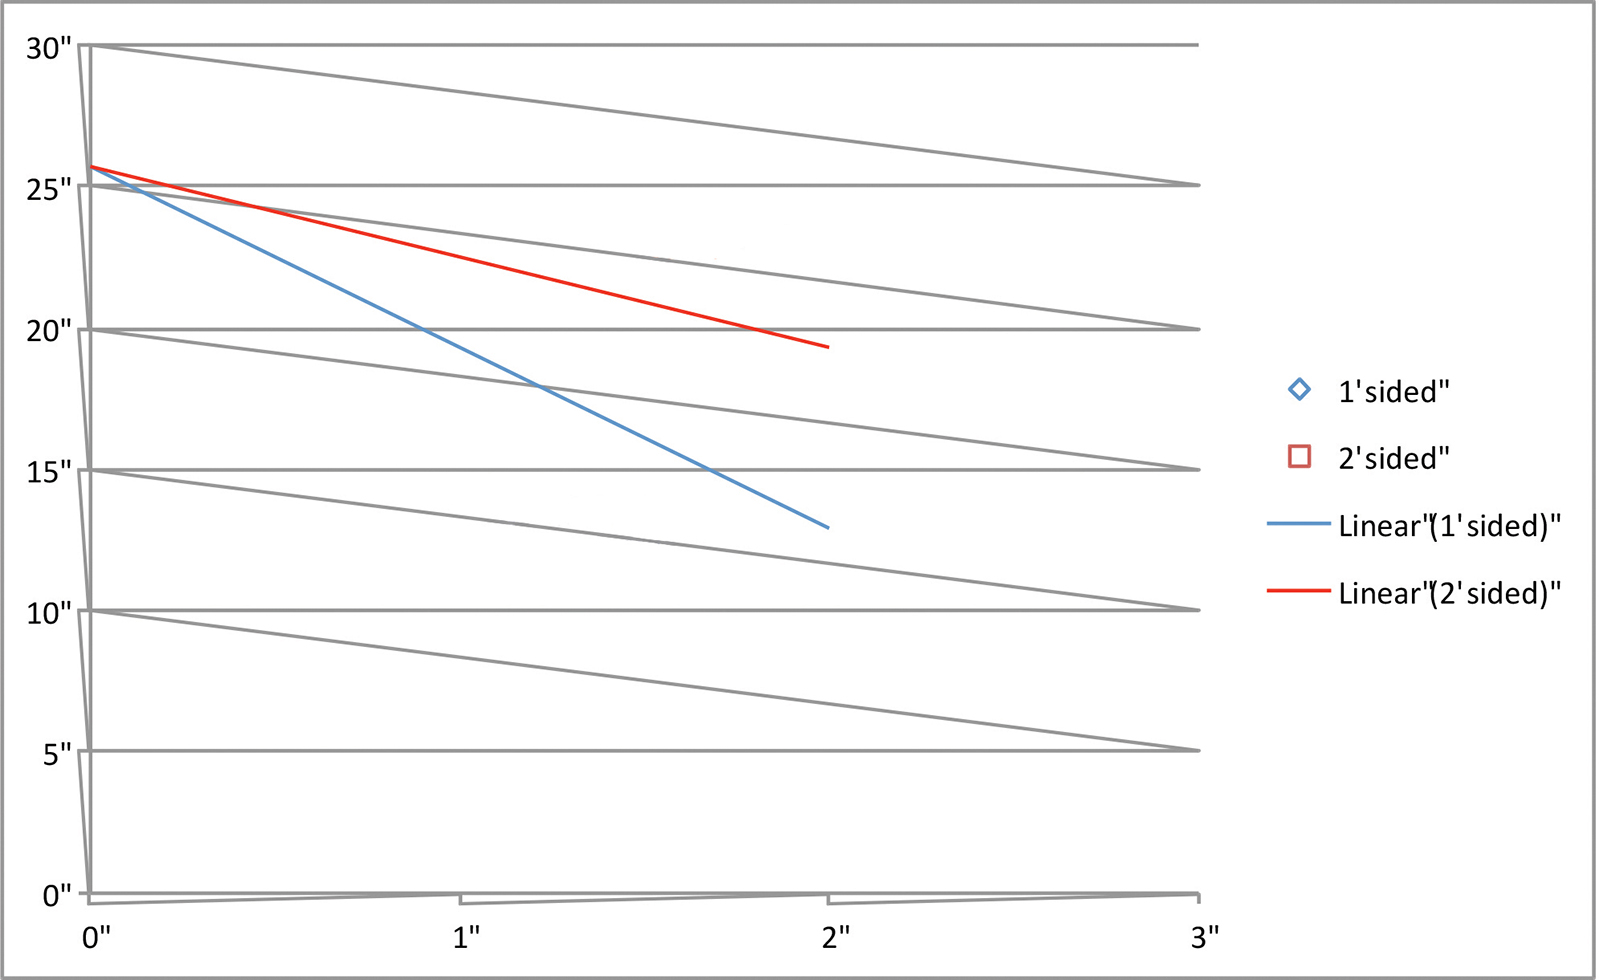
Figure 9. Summary of the results
The analysis shows that taking into consideration the maximum C2F results obtained for each redundancy type and then projecting output on a given average load per cabinet, an example average high-density cabinet of 20 kW would require the CRAC units to occupy double the IT cabinet space in an N+2 configuration, hence lowering the effective use of such prime IT floor space (See Figure 9).
Additional Metrics
Additional metrics for design purposes have been derived from the illustrated graphs and resultant formulae.
The derived formula could be documented as follows:
P=K/L+M-(6.4 x R/S) (8)
Where
P = Cooling per perimeter meter (kW/m)
K = CRAC net sensible capacity (kW)
L = CRAC length (m)
M = CRAC manufacturer side maintenance clearance (m)
R = CRAC redundancy
S = One- or two-sided CRAC layout
Conclusion
Approximately 50% (270 kW/180 kW) more capacity, 30% more cabinets, and 16% higher-cabinet load density could be utilized in the same space with only one redundant CRAC and may still fulfill Tier II-IV component redundancy requirements. This is achievable at no additional investment cost as the same number of CRACs (4) is installed within the same available footprint of 2,000 ft2. The analysis also showed that the highest average practical load per cabinet should not exceed 6 kW if efficient space utilization is sought by maintaining a C2C of 0.46.
This study shows that an average high-density cabinet load may not be cooled efficiently with the use of only CRACs or even with CRACs coupled with passive heat-extraction solutions. The data supports the necessary implementation of row- and cabinet-based active cooling for high-density data center applications.
The first supercomputers used cooling water; however, the low-density data centers that were commissioned closer to a decade ago (below 2 kW per cabinet) almost totally eliminated liquid cooling. This was due to reservations about the risks of water leakage within live, critical data centers.
Data centers of today are considered to be medium-density facilities. Some of these data centers average below 4 kW per cabinet. Owners and operators that have higher demands and are ahead of the average market typically dedicate only a portion of the data center space to high-density cabinets.
With server density increasing every day and high-density cabinets (approaching 40 kW and above) becoming a potential future deployment, data centers seem likely to experience soaring heat loads that will demand comprehensive liquid-cooling infrastructures.
With future high-density requirements, CRAC units may become secondary cooling support or even more drastically, CRAC units may become obsolete!
Appendix A
Appendix A1. One-sided CRAC, maximum-throw, maximum-packed cabinets
Appendix A2. One-sided CRAC, average-throw, medium cabinets
Appendix A3. One-sided CRAC, minimum-throw, high-density cabinets
Appendix A4. Two-sided CRAC, maximum-throw, maximum-packed cabinets.
Appendix A5. Two-sided CRAC, average-throw, medium packed cabinets
Appendix A6. Two-sided CRAC, minimum-throw, high density cabinets
Appendix B
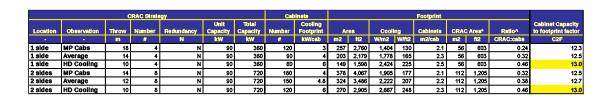
Appendix B1. Tier I (N) CRAC modeling results
Note 1: HD = High Density
Note 2: MP = Max Packed
Note 3: * = CRAC Area includes maintenance and throw buffer
Note 4:^ = 27 m2 area is deducted from total area, as it is already included in the throw buffer
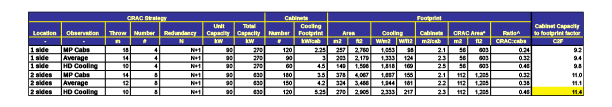
Appendix B2. Tier II-IV (N+1) CRAC modeling results
Note 1: HD = High Density
Note 2: MP = Max Packed
Note 3: * = CRAC Area includes maintenance and throw buffer
Note 4: ^ = 27 m2 area is deducted from total area, as it is already included in the throw buffer
Appendix B3. Tier II-IV (N+1) CRAC modeling results
Appendix C
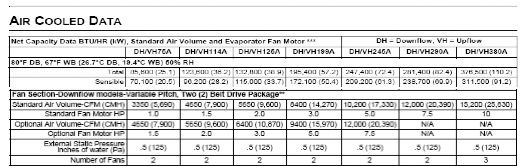
Liebert CRAC Technical Specification
Note: Net sensible cooling will be reduced by 7.5 kW x 3 = 22.5 kW for fans; 68.7 kW for Model DH/VH380A
 Dr Hussein Shehata, BA, PhD, CEng, PGDip, MASHRAE, MIET, MCIBSE, is the technical director, EMEA, Uptime Institute Professional Services (UIPS). Dr Shehata is a U.K. Chartered Engineer who joined Uptime Institute Professional Services in 2011. He is based in Dubai, serving the EMEA region. From 2008-2011, Hussein was vice president & AsiaPacific DC Engineering, Architecture & Strategy Head at JP Morgan in Japan. Prior to that, he co-founded, managed, and operated as a subject matter expert (SME) at PTS Consulting Japan. He graduated in Architecture, followed by a PhD in HVAC, and a diploma in Higher Education that focused on multi-discipline teaching, with a focus on Engineers and Architects.
 2019, Getty


