
The Calibrated Data Center: Using Predictive Modeling
Better information leads to better decisions
By Jose Ruiz
New tools have dramatically enhanced the ability of data center operators to base decisions regarding capacity planning and operational performance like move, adds, and changes on actual data. The combined use of modeling technologies to effectively calibrate the data center during the commissioning process and the use of these benchmarks in modeling prospective configuration scenarios enable end users to optimize the efficiency of their facilities prior to the movement or addition of a single rack.
Data center construction is expected to continue growing in coming years to house the compute and storage capacity needed to support the geometric increases in data volume that will characterize our technological environment for the foreseeable future. As a result, data center operators will find themselves under ever-increasing pressure to fulfill dynamic requirements in the most optimized environment possible. Every kilowatt (kW) of cooling capacity will become increasingly precious, and operators will need to understand the best way to deliver it proactively.
As Uptime Institute’s Lee Kirby explains in Start With the End in Mind, a data center’s ongoing operations should be the driving force behind its design, construction, and commissioning processes.
This paper examines performance calibration and its impact on ongoing operations. To maximize data center resources, Compass performs a variety of analyses using Future Facilities’ 6SigmaDC and Romonet’s Software Suite. In the sections that follow, I will discuss how predictive modeling during data center design, the commissioning process, and finally, the calibration processes validate the predictive models. Armed with the calibrated model, a customer can study the impact of proposed modifications on data center performance before any IT equipment is physically installed in the data center. This practice helps data center operators account for the three key elements during facility operations: availability, capacity, and efficiency. Compass calls this continuous modeling.
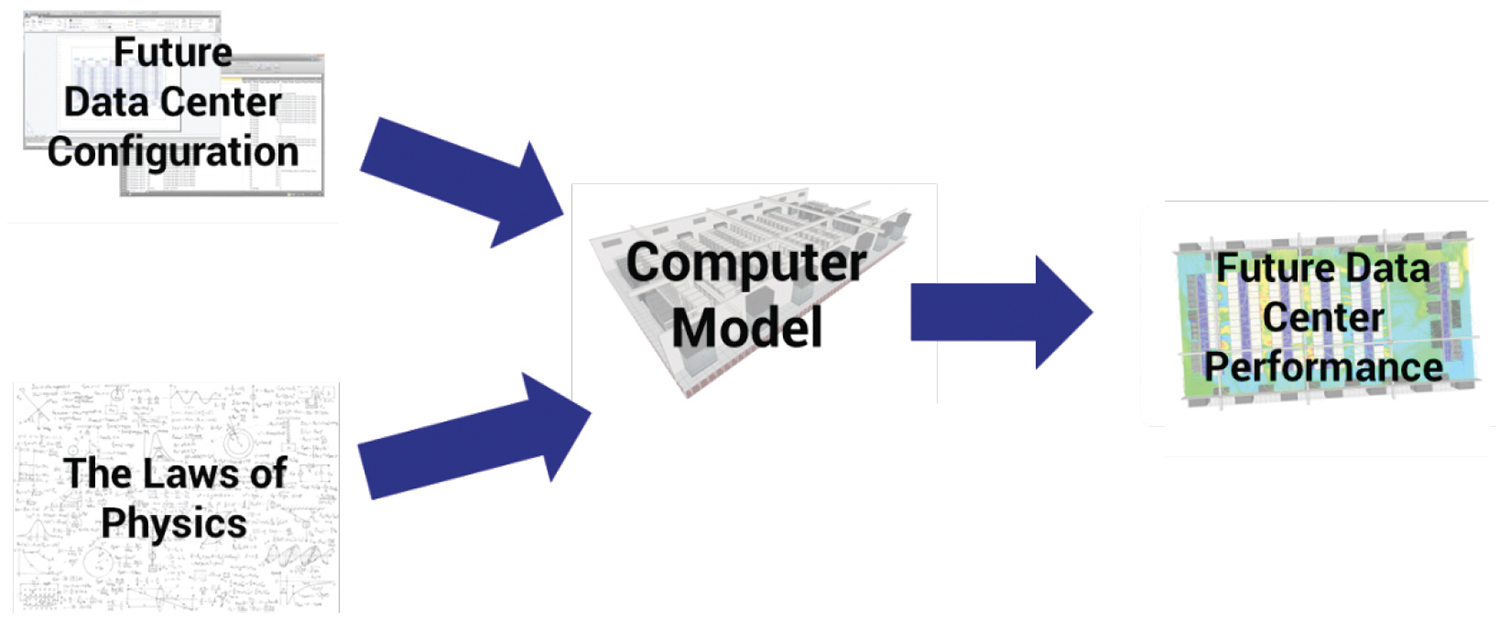
Figure 1. CFD software creates a virtual facility model and studies the physics of the cooling and power elements of the data center
What is a Predictive Model?
A predictive model, in a general sense, combines the physical attributed and operating data of a system and uses that to calculate an outcome in the future. The 6Sigma model provides complete 3D representation of a data center at any given point in its life cycle. Combining the physical elements of IT equipment, racks, cables, air handling units (AHUs), power distribution units (PDUs), etc., with computational fluid dynamics (CFD) and power modeling, enables designers and operators to predict the impact of their configuration on future data center performance. Compass uses commercially available performance modeling and CFD tools to model data center performance in the following ways:
• CFD software creates a virtual facility model and studies the physics of the cooling and power elements of the data center (see Figure 1).
• The modeling tool interrogates the individual components that make up the data center and compare their actual performance with the initial modeling prediction.
This proactive modeling process allows operators to fine tune performance and identify potential operational issues at the component level. A service provider, for example, could use this process to maximize the sellable capacity of the facility and/or its ability to meet the service level agreements (SLA) requirements for new as well as existing customers.
Case Study Essentials
For the purpose of this case study all of the calibrations and modeling are based upon Compass Data Center’s Shakopee, MN, facility with the following specifications (see Figure 2):
• 13,000 square feet (ft2) of raised floor space
• No columns on the data center floor
• 12-foot (ft) false ceiling used as a return air
plenum
• 36-inch (in.) raised floor
• 1.2 megwatt (MW) of critical IT load
• four rooftop air handlers in an N+1 configuration
• 336 perforated tiles (25% open) with dampers installed
• Customer type: service provider
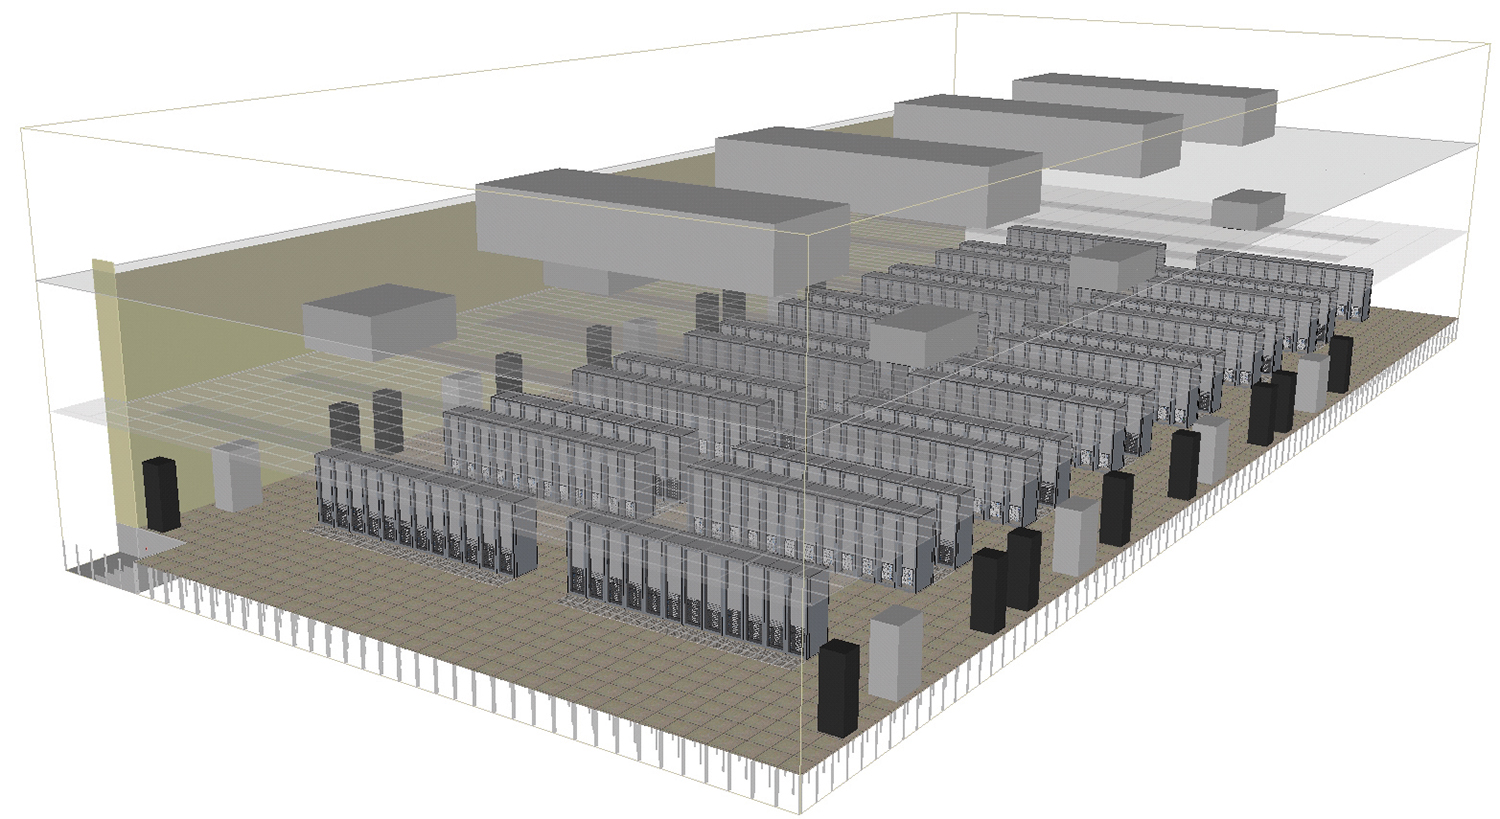
Figure 2. Data center room with rooftop AHUs
Cooling Baseline
The cooling system of this data center comprises 4 120-ton rooftop air handler units in an N+1 configuration (see Figure 3). The system provides a net cooling capacity that a) supports the data center’s 1.2-MW power requirement and b) delivers 156,000 cubic feet per minute (CFM) of airflow to the white space. The cooling units are controlled based on the total IT load present in the space. This method turns on AHUs as the load increases. Table 1 describes the scheme.
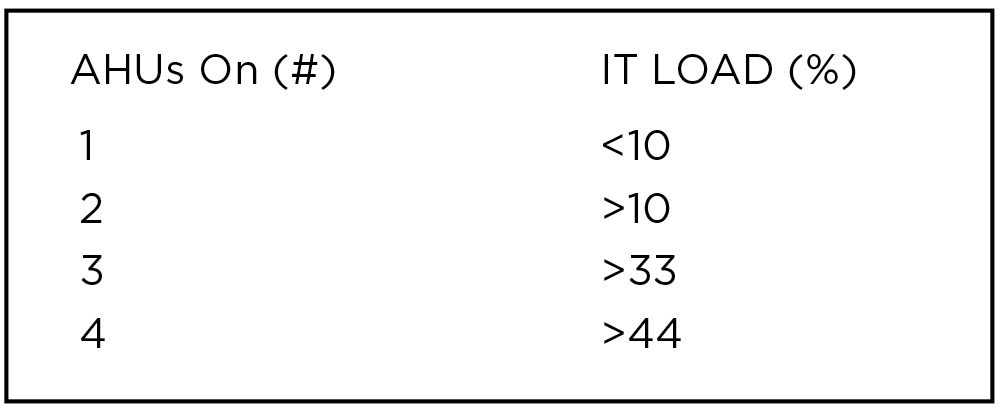
Table 2. Tests performed during calibration
These units have outside air economizers to leverage free cooling and increase efficiency. For the purpose of the calibration, the system was set to full recirculation mode with the outside air economization feature turned off. This allows the cooling system to operate at 100% mechanical cooling, which is representative of a standard operating day under the Design Day conditions.

Figure 3. Rooftop AHUs
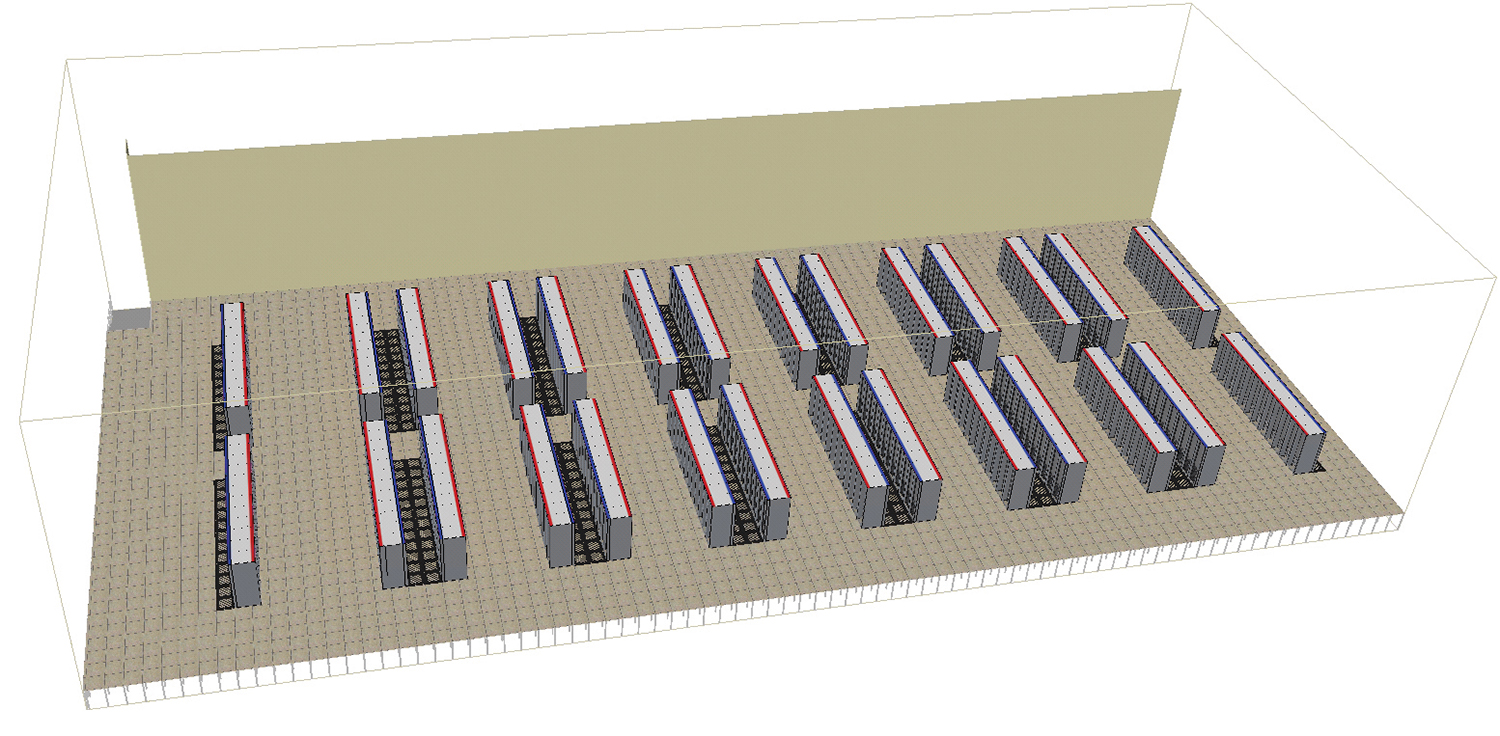
Figure 4. Cabinet and perforated tile layout. Note: Upon turnover, the customer is responsible for racking and stacking the IT equipment.
Cabinet Layout
The default cabinet layout is based on a standard Cold Aisle/Hot Aisle configuration (see Figure 4).
Airflow Delivery and Extraction
Because the cooling units are effectively outside the building, a long opening on one side of the room serves as a supply air plenum. The air travels down the 36-in.-wide plenum to a patent-pending air dam before entering the raised floor. The placement of the air dam ensures even pressurization of the raised floor during both normal and maintenance failure modes. Once past the air dam, the air enters a 36-in. raised floor and is released into the above floor by 336 perforated tiles (25% open) (see Figure 5).
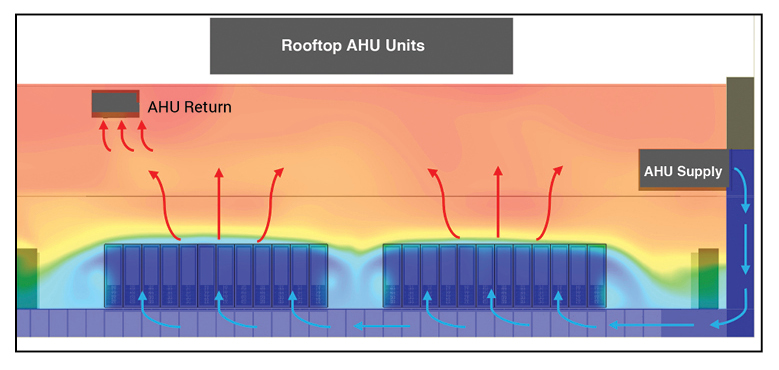
Figure 5. Airflow
Hot air from the servers then passes through ventilation grilles placed in the 12-ft false ceiling.
Commissioning and Calibration
Commissioning is a critical step in the calibration process because it eliminates extraneous variables that may affect subsequent reporting values. Upon the completion of the Integrated Systems Testing (IST), the calibration process begins. This calibration exercise is designed to enable the data center operator to compare actual data center performance against the modeled values.
Figure 6. Inconsistencies between model values and actual performance can be explored and examined prior to placing the facility into actual operation. These results provide a unique insight into whether the facility will operate as per the design intent in the local climate.
The actual process consists of conducting partial load tests in 25% increments and monitoring actual readings from specific building management system points, sensors, and devices that account for all the data center’s individual components.
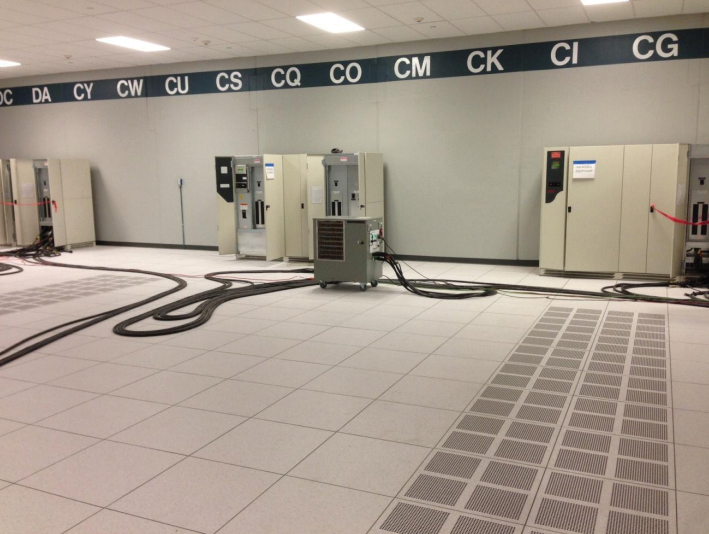
Figure 7. Load bank and PDUs during the test
As a result of this testing, inconsistencies between model values and actual performance can be explored and examined prior to placing the facility into actual operation. These results provide a unique insight into whether the facility will operate as per the design intent in the local climate or whether there are issues that will affect future operation that must be addressed. Figure 6 shows the process. Figure 7 shows load banks and PDUs as arranged for testing.
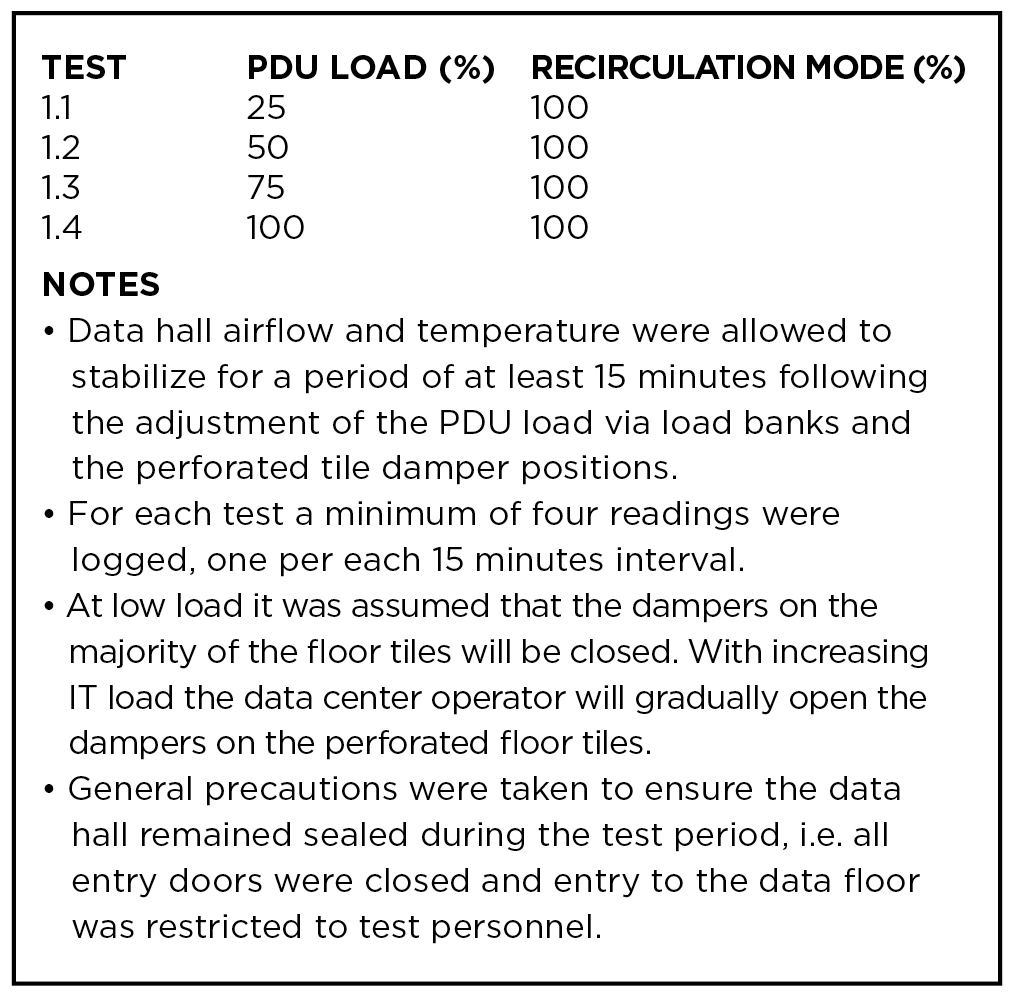
Table 2. Tests performed during calibration
All testing at Shakopee was performed by a third-party entity to eliminate the potential for any reporting bias in the testing. The end result of this calibration exercise is that the operator now has a clear understanding of the benchmark performance standards unique to their data center. This provides specific points of reference for all future analysis and modeling to determine the prospective performance impact of site moves, adds, or changes. Table 2 lists the tests performed during the calibration.
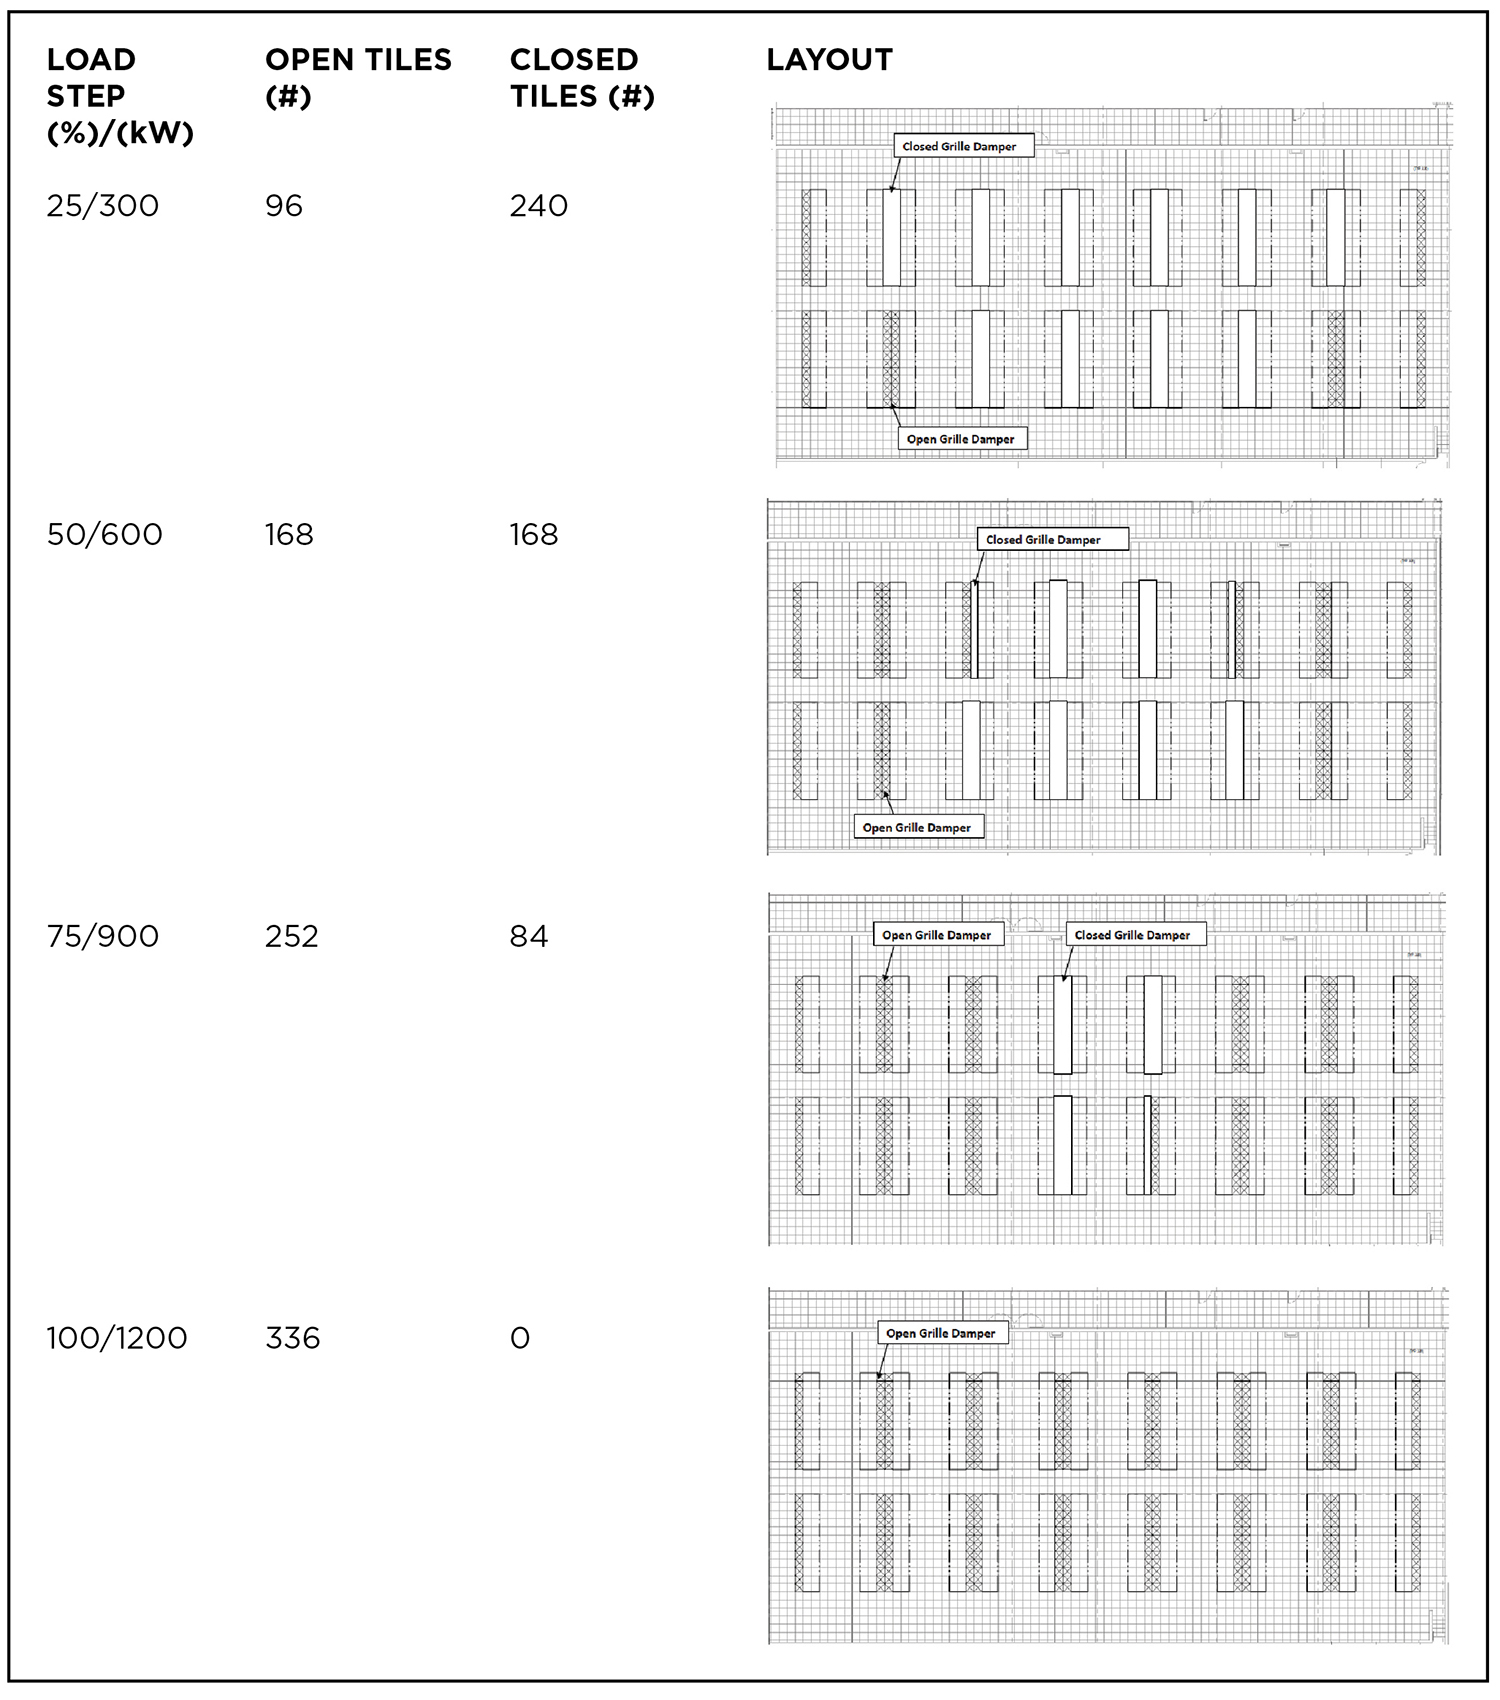
Table 3. Perforated tile configuration during testing
During the calibration, dampers on appropriate number of tiles were closed proportionally to coincide with the load step. Table 3 shows the perforated tile damper configuration used during the test.
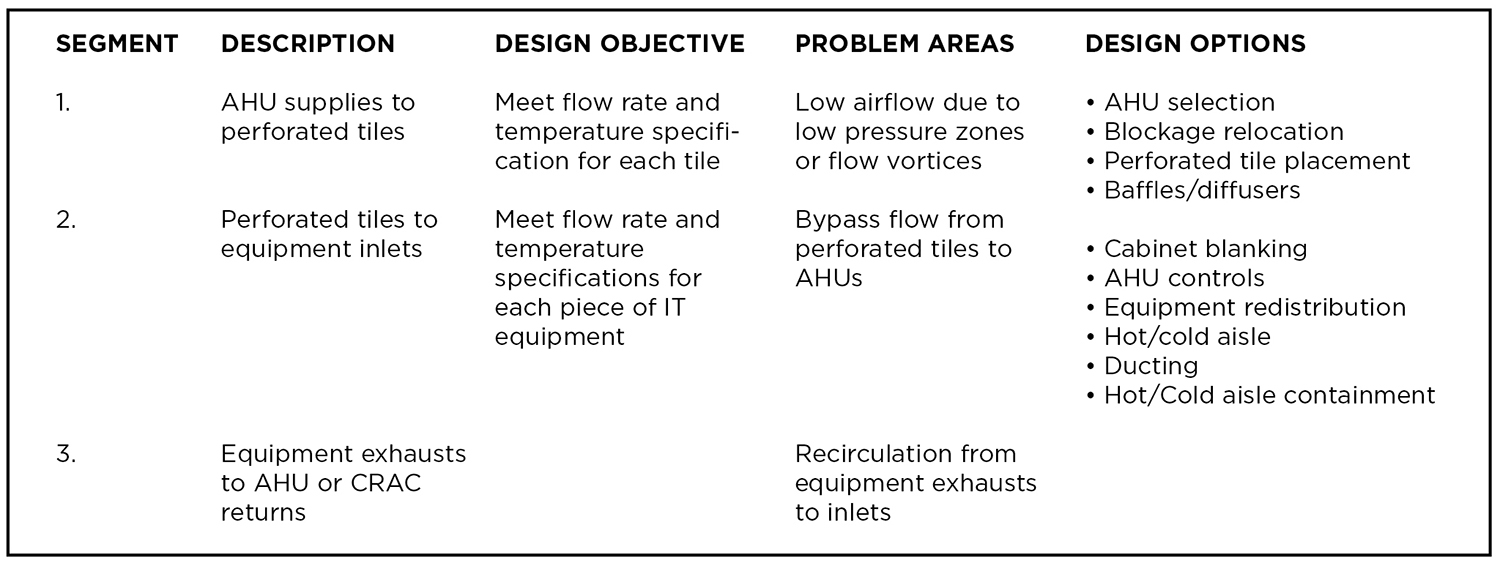
Table 4. CPM goals, test results, and potential adjustments
Analysis & Results
To properly interpret the results of the initial calibration testing, it’s important to understand the concept of cooling path management (CPM), which is the process of stepping through the full route taken by the cooling air and systematically minimizing or eliminating potential breakdowns. The ultimate goal of this exercise is meeting the air intake requirement for each unit of IT equipment. The objectives and associated changes are shown in Table 4.
Cooling paths are influenced by a number of variables, including the room configuration, IT equipment and its arrangement, and any changes that will fundamentally change the cooling paths. In order to proactively avoid cooling problems or inefficiencies that may creep in over time, CPM is, therefore, essential to the initial design of the room and to configuration management of the data center throughout its life span.
AHU Fans to Perforated Tiles (Cooling Path #1). CPM begins by tracing the airflow from the source (AHU fans) to the returns (AHU returns). The initial step consists of investigating the underfloor pressure. Figure 8 shows the pressure distribution in the raised floor. In this example, the underfloor pressure is uniform from the very onset; thereby, ensuring an even flow rate distribution.
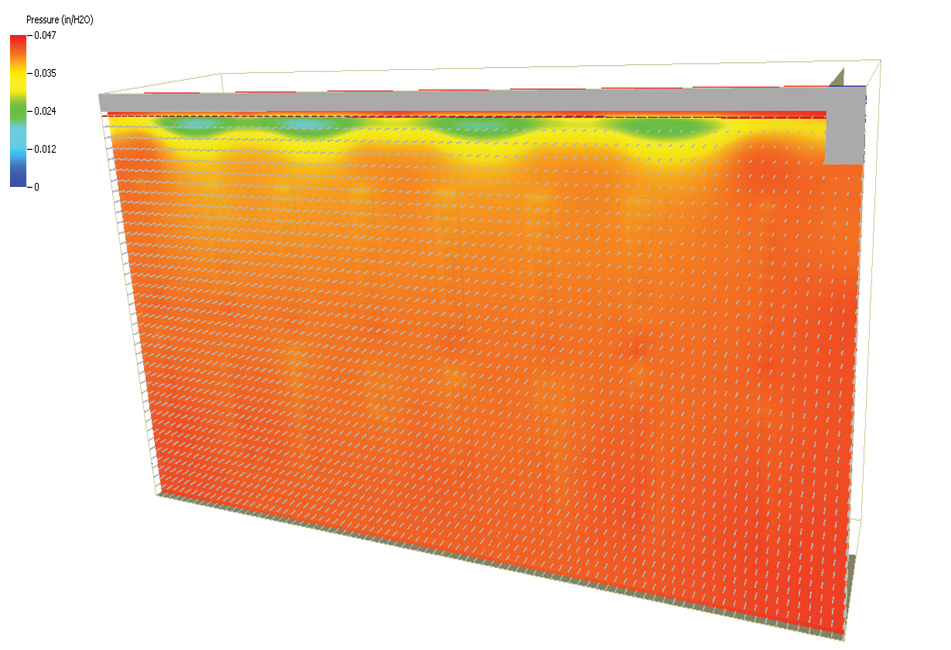
Figure 8 shows the pressure distribution in the raised floor. In this example, the underfloor pressure is uniform from the very onset; thereby, ensuring an even flow rate distribution.
From a calibration perspective, Figure 9 demonstrates that the results obtained from the simulation are aligned with the data collected during commissioning/calibration testing. The average underfloor pressure captured by software during the commissioning process was 0.05 in. of H20 as compared to 0.047 in. H20 predicted by 6SigmaDC.
The airflow variation across the 336 perforated tiles was determined to be 51 CFM. These data guaranteed an average target cooling capacity of 4 kW/cabinet compared to the installed 3.57 kW/cabinet (assuming that the data center operator uses the same type of perforated tiles as those initially installed). In this instance, the calibration efforts provided the benchmark for ongoing operations, and verified that the customer target requirements could be fulfilled prior to their taking ownership of the facility.
The important takeaway in this example is the ability of calibration testing to not only validate that the facility is capable of supporting its initial requirements but also to offer the end user a cost-saving mechanism to determine the impact of proposed modifications on the site’s performance, prior to their implementation. In short, hard experience no longer needs to be the primary mode of determining the performance impact of prospective moves, adds, and changes.

Table 5. Airflow simulations and measured results
During the commissioning process, all 336 perforated tiles were measured.
Table 5 is a results comparison of the measured and simulated flow from the perforated tiles.
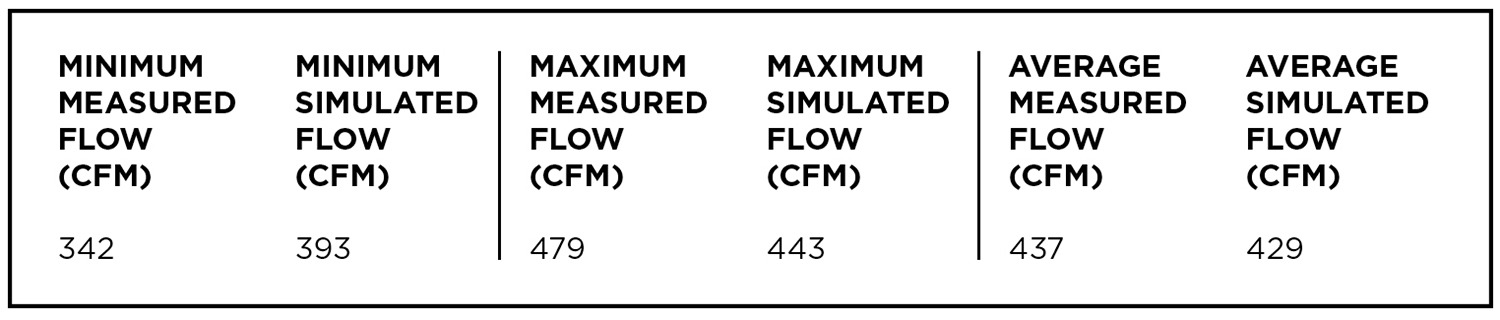
Table 6. Airflow distribution at the perforated tiles
The results show a 1% error between measured and simulated values. Let’s take a look at the flow distribution at the perforated tiles (see Table 6).
The flows appear to match up quite well. It is worth noting that the locations of the minimum and maximum flows are different between measured and simulated values. However, this is not of concern as the flows are within an acceptable margin of error. Any large discrepancy (> 10%) between simulated and measured would warrant further investigation (see Table 7). The next step in the calibration process examined the AHU supply temperatures.
Perforated Tiles to Cabinets (Cooling Path #2). Perforated tile to cabinet airflow (see Figure 10) is another key point of reference that should be included in calibration testing and determination. Airflow leaving the perforated tiles enters the inlets of the IT equipment with minimal bypass.
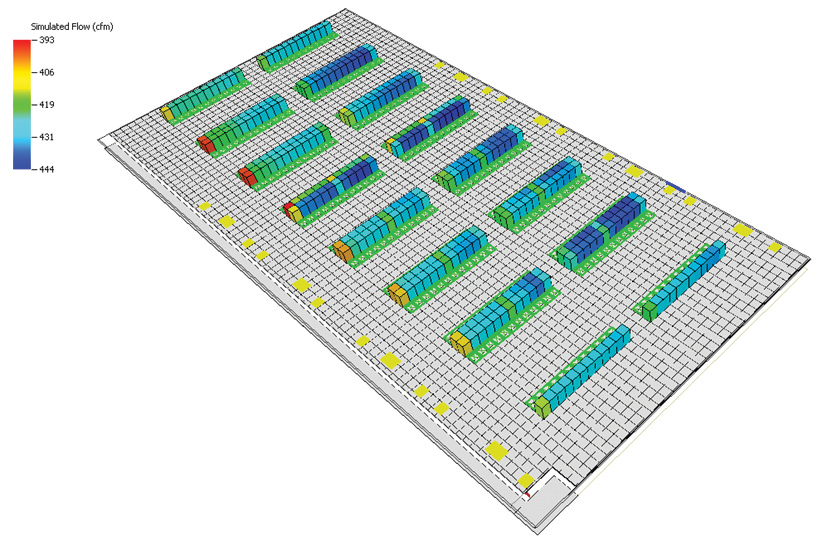
Figure 9. Simulated flow through the perforated tiles
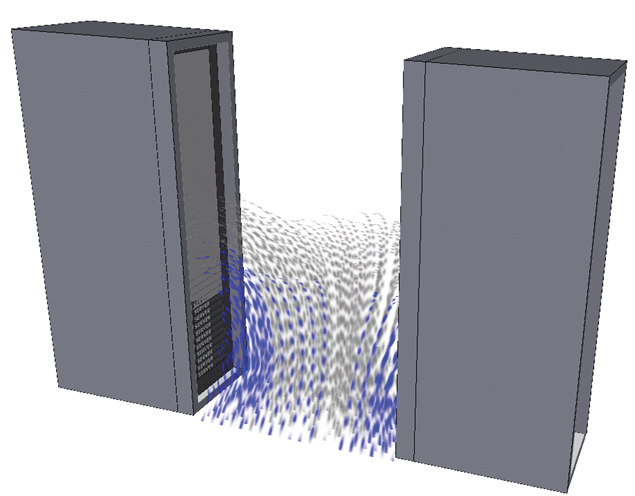
Figure 10. The blue particles cool the IT equipment, but the gray particles bypass the equipment.
Figure 10 shows how effective the perforated tiles are in terms of delivering the cold air to the IT equipment. The blue particles cool the IT equipment while the gray particles bypassing the equipment.
A key point of this testing is the ability to proactively identify solutions that can increase efficiency. For example, during this phase, testing helped determine that reducing fan speed would improve the site’s efficiency. As a result, the AHU fans were fitted with variable frequency drives (VFDs), which enables Compass to more effectively regulate this grille to cabinet airflow.
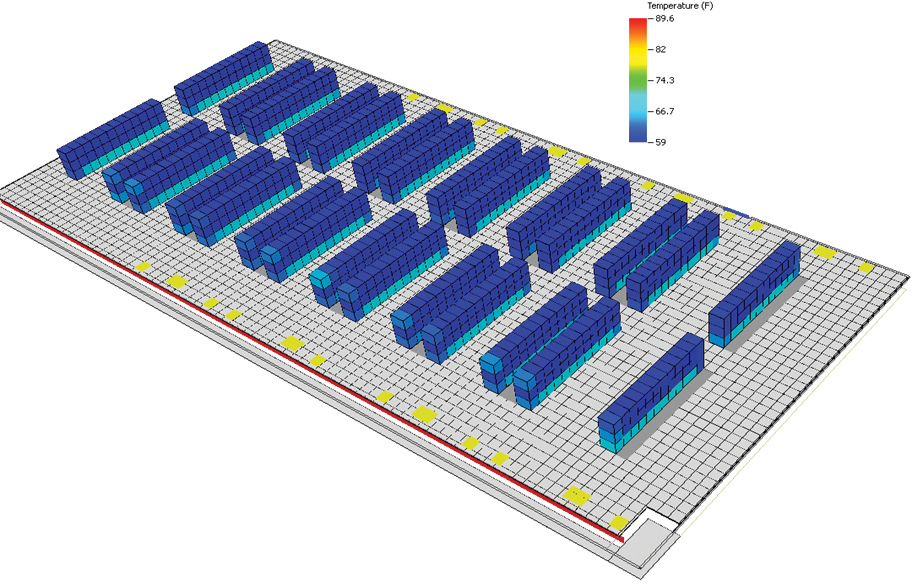
Figure 11. Inlet temperatures
It was also determined that inlet temperatures to the cabinets were on the lower scale of the ASHRAE allowable range (see Figure 11), this creating the potential to raise the air temperature within the room for operations. If the operator takes action and raises the supply air temperature, they will have immediate efficiency gains and see significant cost savings.
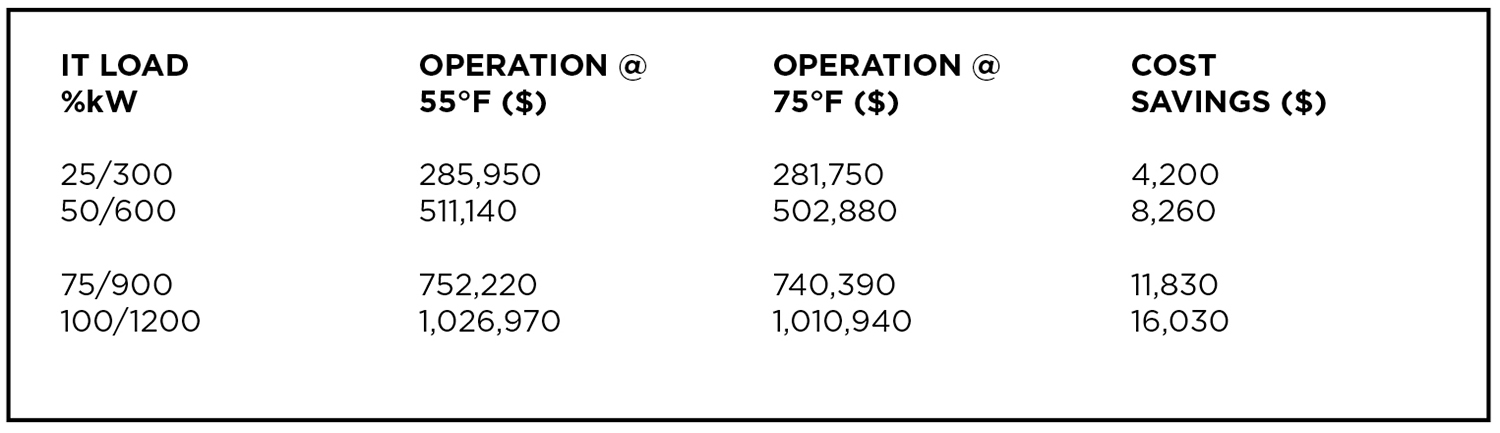
Table 8. Savings estimates based on IT loads
The analytical model can estimate these savings quickly. Table 8 shows the estimated annual cost savings based on IT load, supply air temperature setting for the facility and a power cost of seven cents per kilowatt-hour (U.S. national average). It is important to note the location of the data center because the model uses specific EnergyPlus TMY3 weather files published by the U.S. Department of Energy for its calculation.
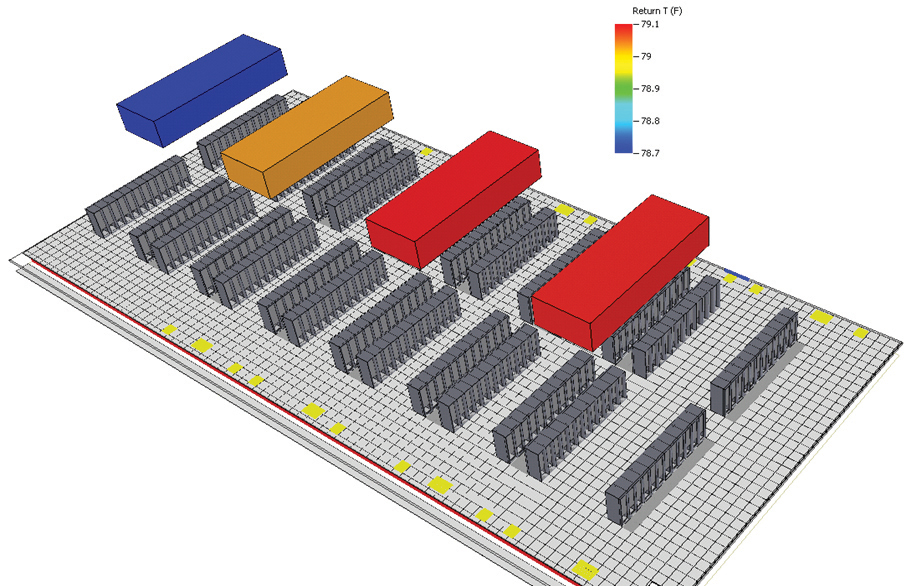
Figure 12. Cooling path three tracks airflow from the equipment exhaust to the returns of the AHU units
Cabinet Exhaust to AHU Returns (Cooling Path #3). Cooling path three tracks airflow from the equipment exhaust to the returns of the AHU units (see Figure 12). In this case, calibration testing identified that the inlet temperatures suggest that there was very little external or internal cabinet recirculation. The return temperatures and the capacities of the AHU units are fairly uniform. The table shows the comparison between measured and simulated AHU return temperatures:
Looking at the percentage cooling load utilized for each AHU unit, the measured load was around 75% and the simulated values show an average value of 80% for each AHU. This slight discrepancy was acceptable due to the differences between the measured and simulated supply and return temperatures; thereby, establishing the acceptable parameters for ongoing operation within the site.
Introducing Continuous Modeling
Up to this point, I have illustrated how calibration efforts can be used to both verify the suitability of the data center to successfully perform as originally designed and to prescribe the specific benchmarks for the site. This knowledge can be used to evaluate the impact of future operational modifications, which is the basis of continuous modeling.
The essential value of continuous modeling is its ability to facilitate more effective capacity planning. By modeling prospective changes before moving IT equipment in, a lot of important what-if’s can be answered (and costs avoided) while meeting all the SLA requirements.
Examples of continuous modeling applications include, but are not limited to:
• Creating custom cabinet layouts to predict the impact of various configurations
• Increasing cabinet power density or modeling custom cabinets
• Modeling Cold Aisle/Hot Aisle containment
• Changing the control systems that regulate VFDs to move capacity where needed
• Increasing the air temperature safely without breaking the temperature SLA
• Investigating upcoming AHU maintenance or AHU failures that can’t be achieved in a production environment
In each of these applications, the appropriate modeling tools are used in concert with initial calibration data to determine the best method of implementing a desired change. The ability to proactively identify the level of deviation from the site’s initial system benchmarks can aid in the identification of more effective alternatives that not only improve operational performance but also reduce the time and cost associated with their implementation.
Case History: Continuous Modeling
Total airflow in the facility described in this case study is based on the percentage of IT load in the data hall with a design criteria of 25°F (-4°C) ∆T. Careful tile management must be practiced in order to maintain proper static pressure under the raised floor and avoid potential hot spots. Using the calibrated model, Compass created two scenarios to understand the airflow behavior. This resulted in installing fewer perforated tiles than originally planned and better SLA compliance. Having the calibrated model gave a higher level of confidence for the results. The two scenarios are summarized following.
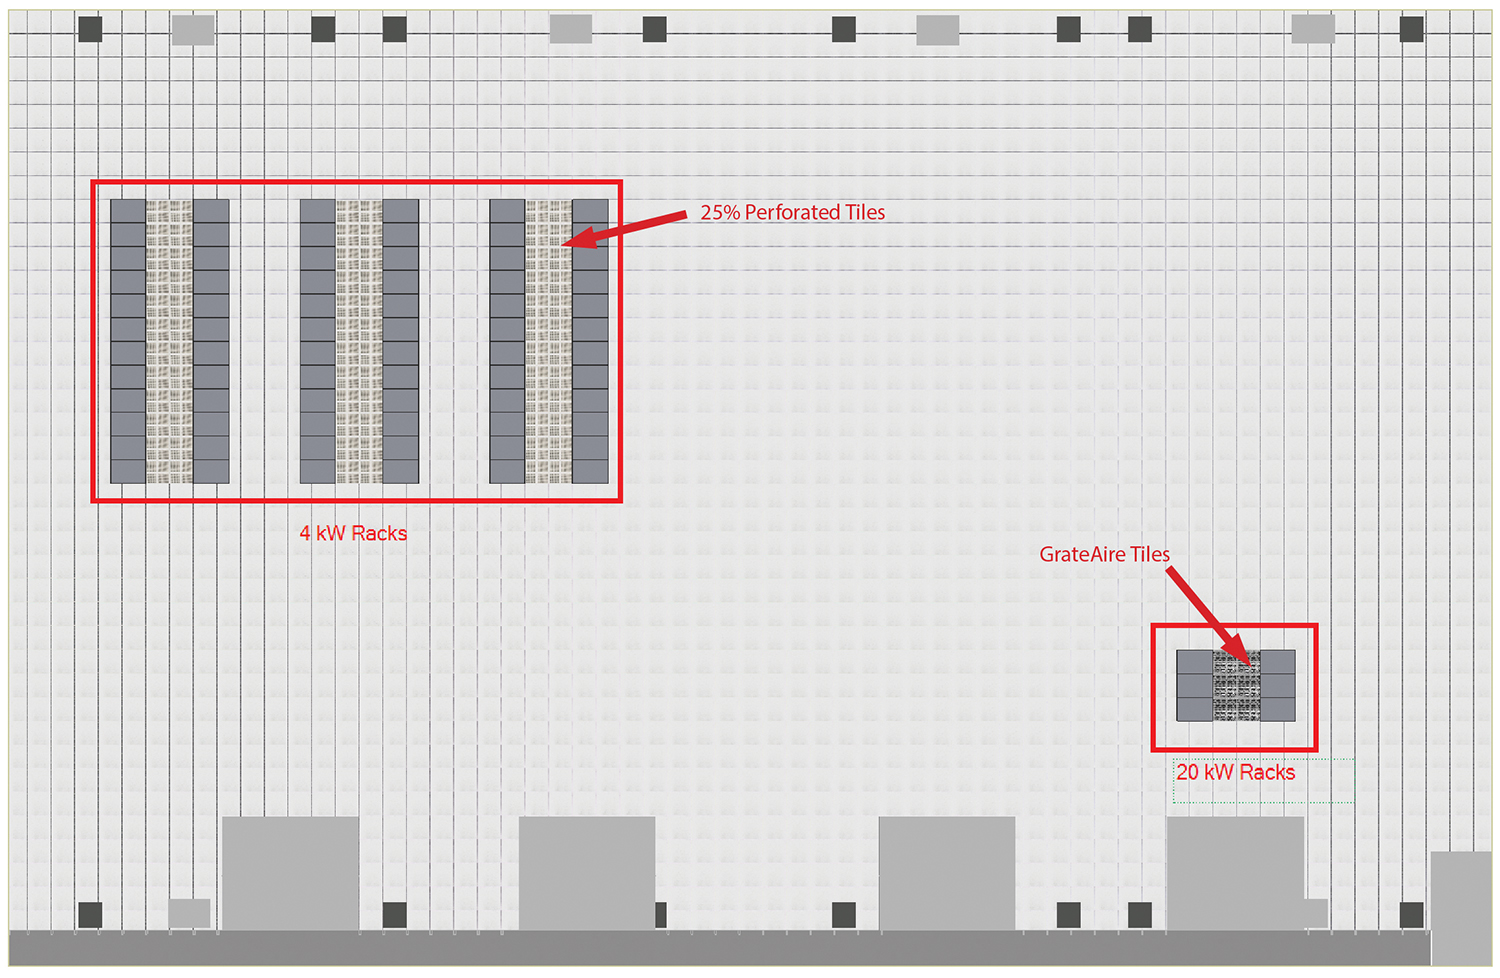
Figure 13. Case history equipment layout
Scenario 1: Less Than Ideal Management
There are 72 4-kW racks in one area of the raised floor and six 6 20-kW racks in the opposite corner (see Figure 13). The total IT load is 408 kW, which is equal to 34% of the total IT load available. The total design airflow at 1,200 kW is 156,000 CFM, meaning the total airflow delivered in this example is 53,040 CFM. A leakage rate of 12% is assumed, which means that 88% of the 53,040 CFM is distributed using the perforated tiles. Perforated tiles were provided in front of each rack. The 25% open tiles were used in front of the 4-kW racks and Tate GrateAire tiles were used in front of the 20-kW racks.
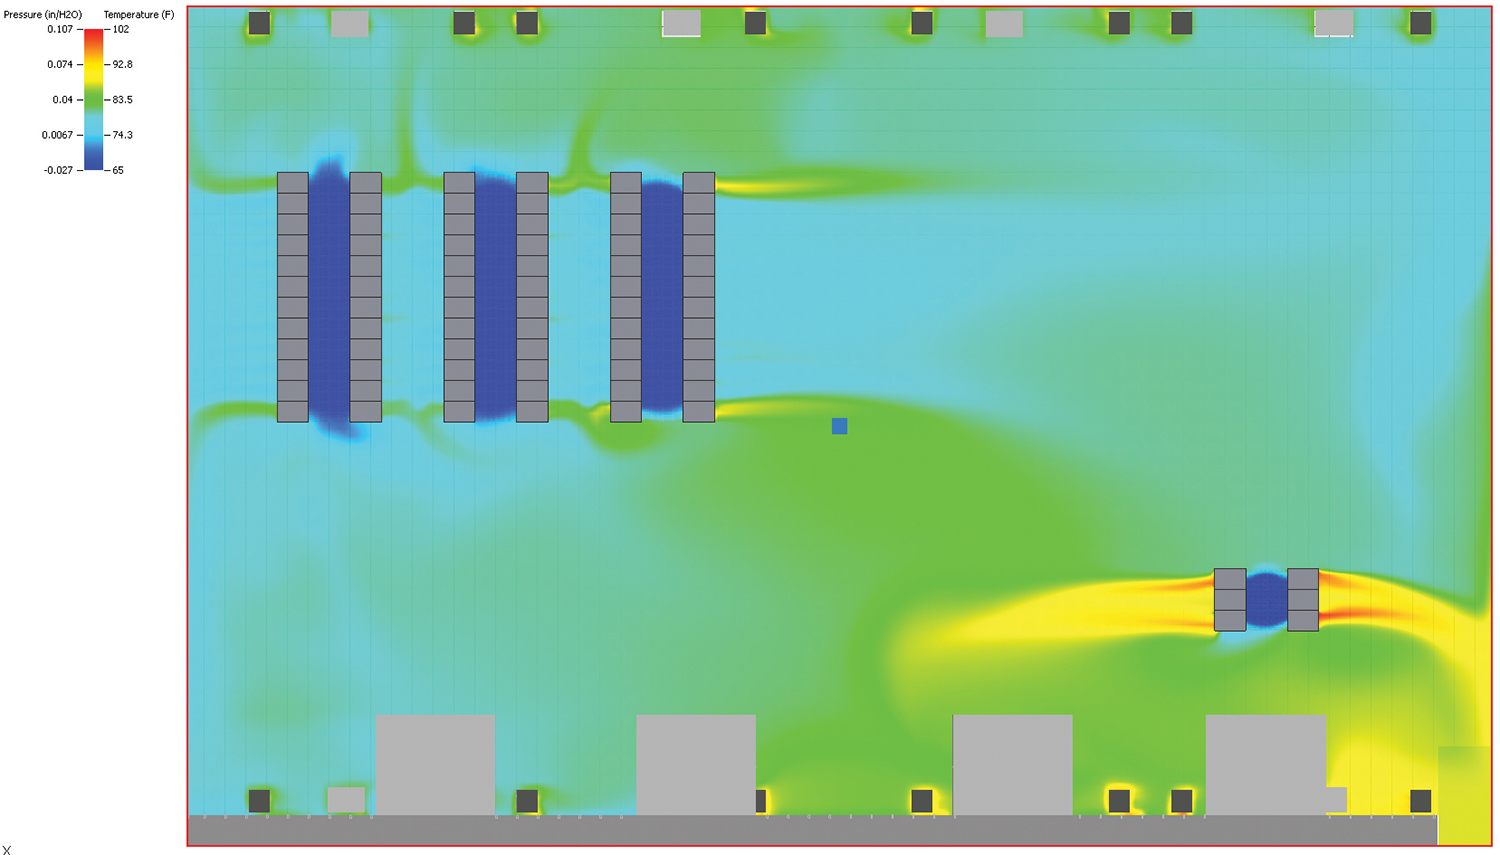
Figure 14. Scenario 1 data hall temperatures
The results of Scenario 1 demonstrate the temperature differences between the hot and cold aisles. For the area with 4-kW racks there is an average temperature difference of around 10°F (5.5 °C) between the Hot and Cold aisles, and the 20-kW racks have a temperature difference of around 30°F (16°C) (see Figure 14).
Scenario 2: Ideal Management
In this scenario, the racks were left in the same location, but the perforated tiles were adjusted to better distribute air based on the IT load. The 20-kW racks account for 120 kW of the total IT load while the 4-kW racks account for 288 kW of the total IT load. In an ideal floor layout, 29.4% of the airflow will be delivered to the 20-kW racks and 70.6% of the airflow will be delivered to the 4-kW racks. This will allow for an ideal average temperature difference across all racks.
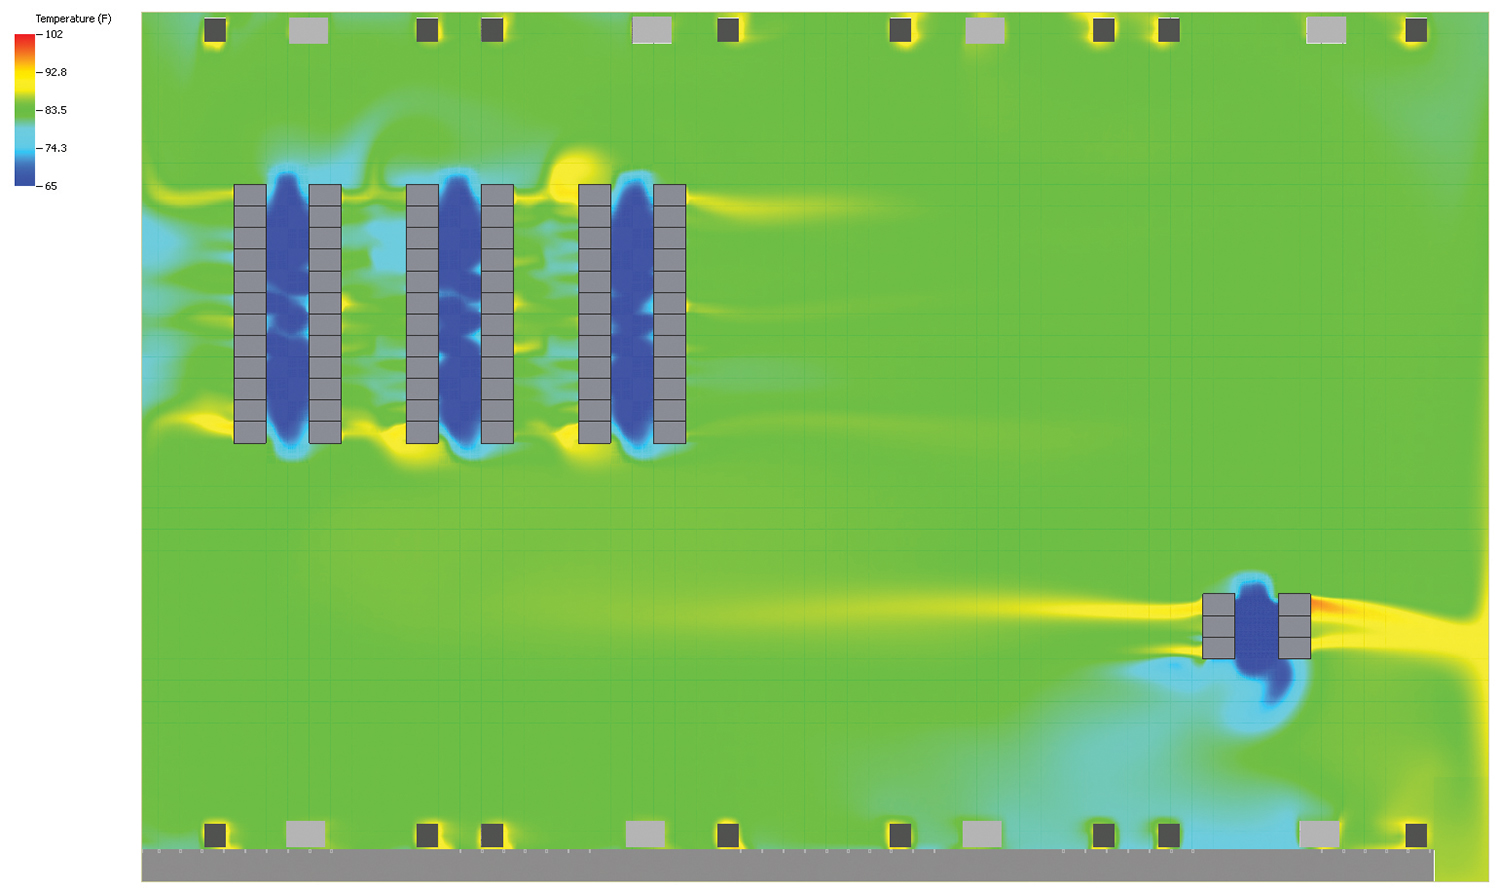
Figure 15. Scenario 2 data hall temperatures
Scenario 2 shows a much better airflow distribution than Scenario 1. The 20-kW racks now have around 25°F (14°C) difference between the hot and cold aisles (see Figure 15).
In general, it may stand to reason that if there are a total of 336 perforated tiles in the space and the space is running at 34% IT load, 114 perforated tiles should be open. The model validated that if 114 perforated tiles were opened, the underfloor static pressure would drop off and potentially cause hot spots due to lack of airflow.
Furthermore, continuous modeling will allow operators a better opportunity to match growth with actual demand. Using this process, operators can validate capacity and avoid wasted capital expense due to poor capacity planning.
Conclusion
To a large extent, a lack of evaluative tools has historically forced data center operators to accept on faith their new data center’s ability to meet its design requirements. Recent developments in modeling applications not only address this long-standing short coming, but also provide operators with an unprecedented level of control. The availability of these tools provide end users with proactive analytical capabilities that manifest themselves in more effective capacity planning and efficient data center operation.
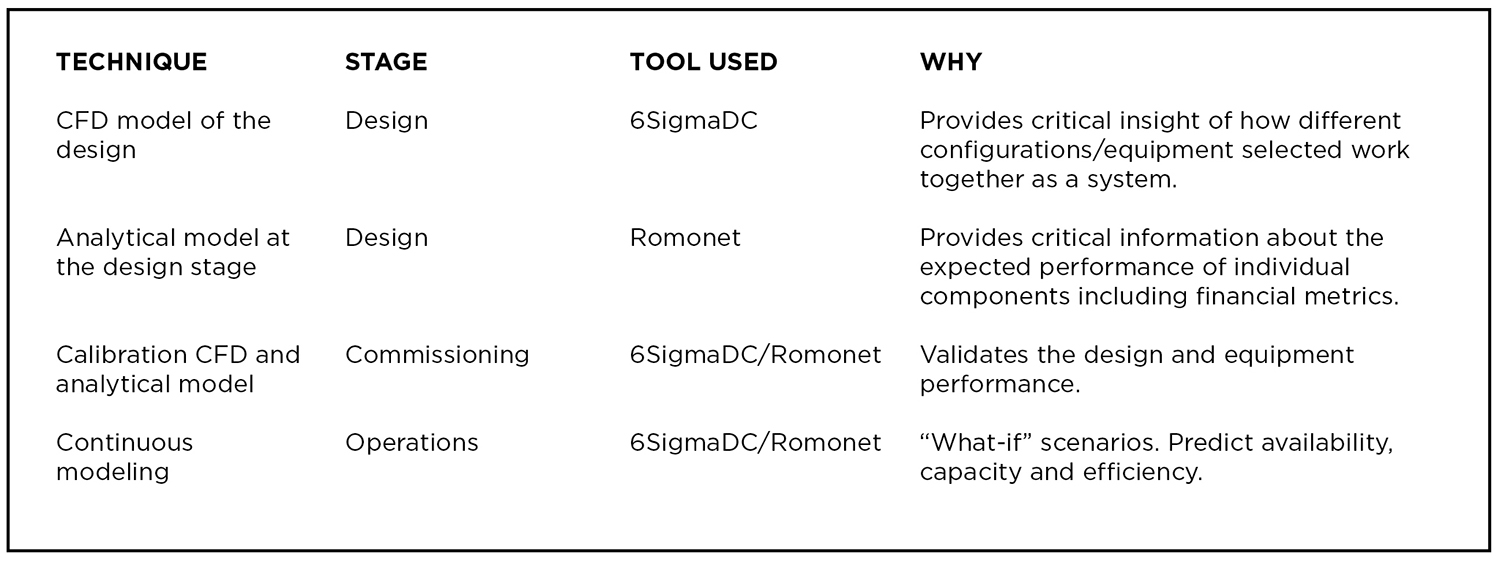
Table 9. Summary of the techniques used to develop in each step of model development and verification
Through the combination of rigorous calibration testing, measurement, and continuous modeling, operators can evaluate the impact of prospective operational modifications prior to their implementation and ensure that they are cost-effectively implemented without negatively affecting site performance. This enhanced level of control is essential for effectively managing data centers in an environment that will continue to be characterized by its dynamic nature and increasing application complexity. Finally, Table 9 summarizes the reasons why these techniques are valuable and provide a positive impact in data center operations.
Most importantly, all of these help the data center owner and operator make a more informed decision.

Jose Ruiz
Jose Ruiz is an accomplished data center professional with a proven track record of success. Mr. Ruiz serves as Compass Datacenters’ director of Engineering where he is responsible for all of the company’s sales engineering and development support activities. Prior to joining Compass, he spent four years serving in various sales engineering positions and was responsible for a global range of projects at Digital Realty Trust. Mr. Ruiz is an expert on CFD modeling.
Prior to Digital Realty Trust, Mr. Ruiz was a pilot in the United States Navy where he was awarded two Navy Achievement Medals for leadership and outstanding performance. He continues to serve in the Navy’s Individual Ready Reserve. Mr. Ruiz is a graduate of the University of Massachusetts with a degree in Bio-Mechanical Engineering.


 Uptime Institute, 2019
 2020
2020