2014 Data Center Industry Survey
The fourth annual Uptime Institute Data Center Industry Survey provides an overview of global industry trends by surveying 1,000 data center operators and IT practitioners. Uptime Institute collected responses via email February through April 2014 and presented preliminary results in May 2014 at the 9th Uptime Institute Symposium: Empowering the Data Center Professional. This document provides the full results and analysis.
I. Survey Demographics
Uptime Institute focused its analysis on the end-user survey respondents. The majority of survey participants are data center managers, followed by smaller percentages of IT managers and senior executives. The U.S. and Canada make up a significant portion of the response, with growing numbers of participants from around the globe.
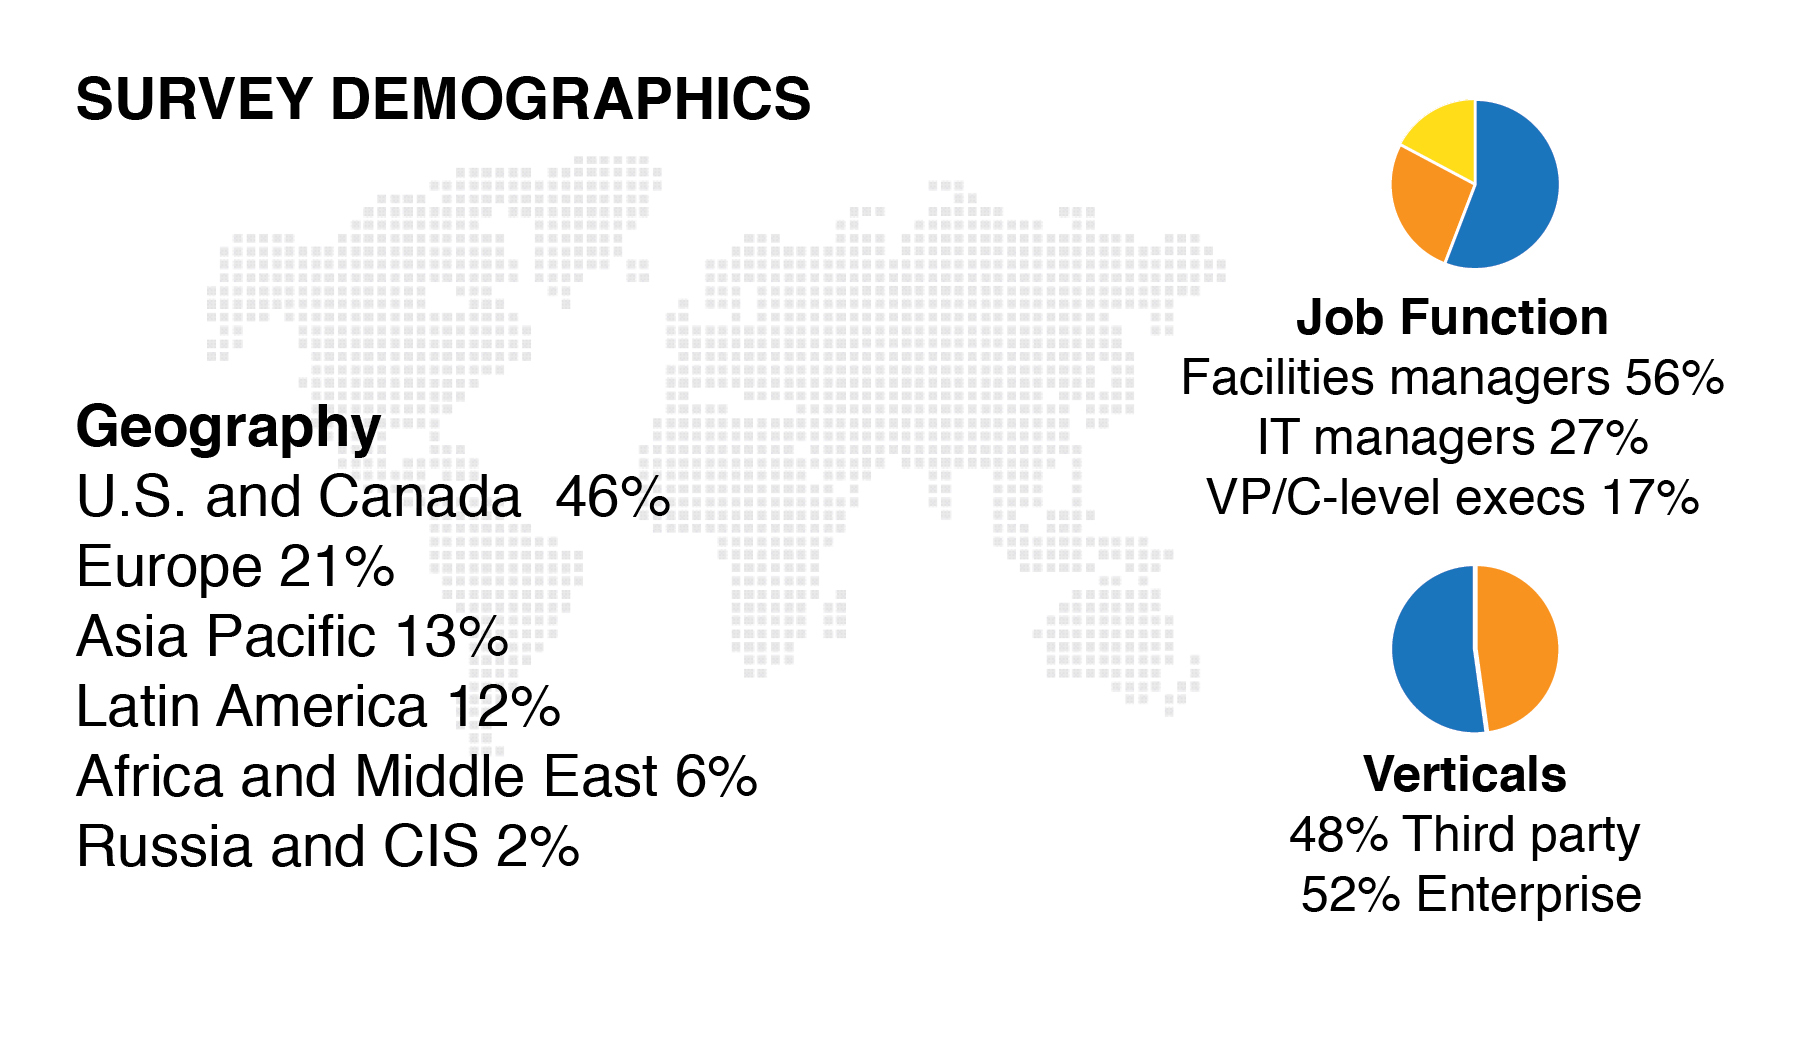
About half of the end-user respondents work for third-party commercial data center companies (colocation or cloud computing providers), and the other half work for enterprises in vertical industries such as financial services (11%), manufacturing (7%), healthcare (4%), government (4%), and other industries (26%).
In various sections throughout this survey, the financial services industry’s responses have been broken out from those of traditional enterprise companies. Across multiple focus areas, the responses of financial services organizations differ significantly from those of other verticals.
Previous annual surveys in 2011, 2012, and 2013 showed that large organizations (defined in this context as companies managing over 5,000 servers) were adopting new technologies, outsourcing less-critical workloads, and pursuing energy efficiency goals much faster than smaller companies.
For 2014, we analyzed the results further and found that the data center maturity gap is not just a matter of size, but also specific to a single industry (banking). This difference is most likely due to the massive investment financial organizations have in IT, especially in relation to their overall cost structures. A financial organization’s efficiency at deploying IT correlates directly to its profitability in a way that may not be as obvious to other companies.
When the response profiles of the financial organizations and the colocation providers are compared, a pattern starts to emerge – both banks and colos run their data center operations as a business.
We will explore the implications of these parallels throughout the survey data.
II. Data center budgets
In each year’s survey, we ask participants to compare their organization’s current spending on data centers (including real estate, infrastructure equipment, staffing, operations, etc.) to the previous year. Every year, the answers to these questions reveal massive growth in the colocation and multi-tenant data center (MTDC) industry compared to enterprise spending.
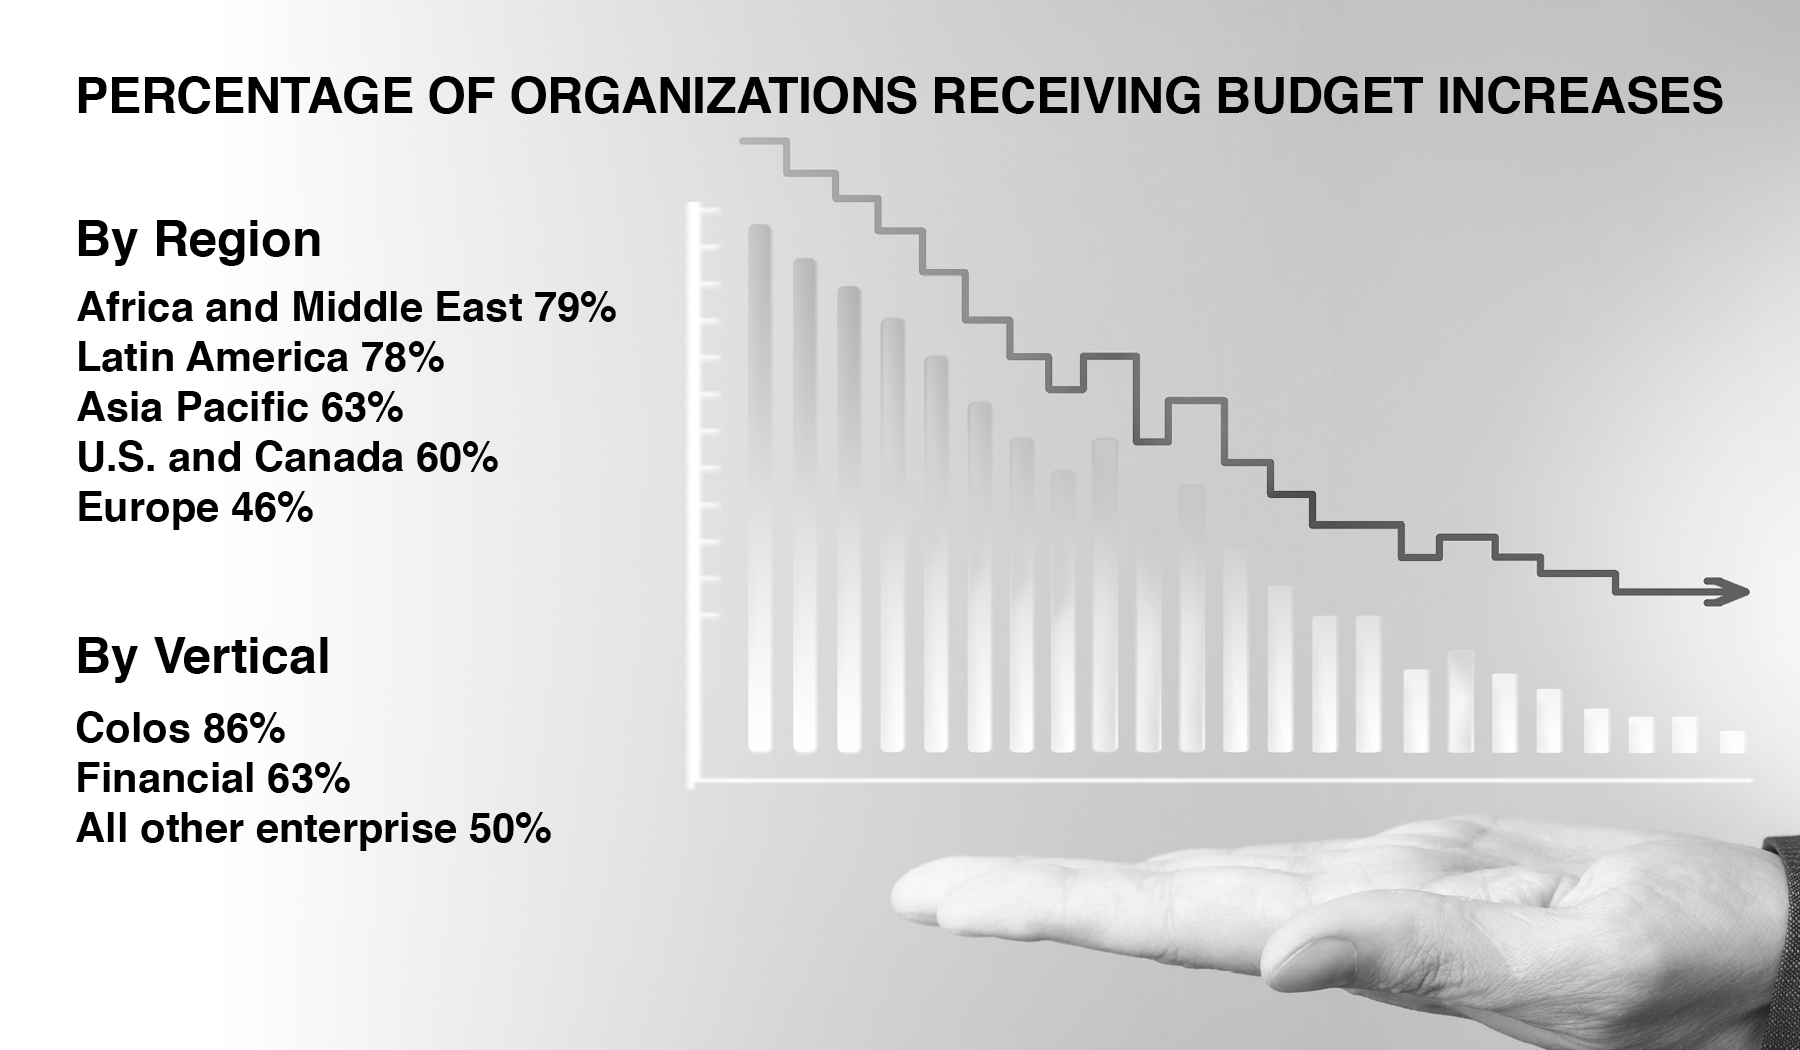
In 2014, the vast majority of third-party data center respondents (86%) report receiving budget increases, versus 63% of financial firms and just 50% of the other enterprise companies. This gap is similar to the 2013 results: 77% of third-party respondents increased budget, versus just 47% of enterprise companies.
With half of all enterprises reporting stagnant or shrinking data center budgets and colocation operators reporting massive growth, our conclusion is that increasingly, enterprise data center workloads are shifting to third-party providers.
This is not to say that the enterprise data centers are going away any time soon. These organizations will continue to squeeze a return on their investments in enterprise data center assets. The value of a performing, fully or partially depreciated asset cannot be disregarded.
According to surveys from Uptime Institute’s executive programs, nearly every enterprise has chosen to host some percentage of its IT workloads off-premise, in a MTDC, cloud, or other third-party environment. Anecdotal reports to Uptime Institute lead us to believe this to be a fairly recent development (within the last 5 years).
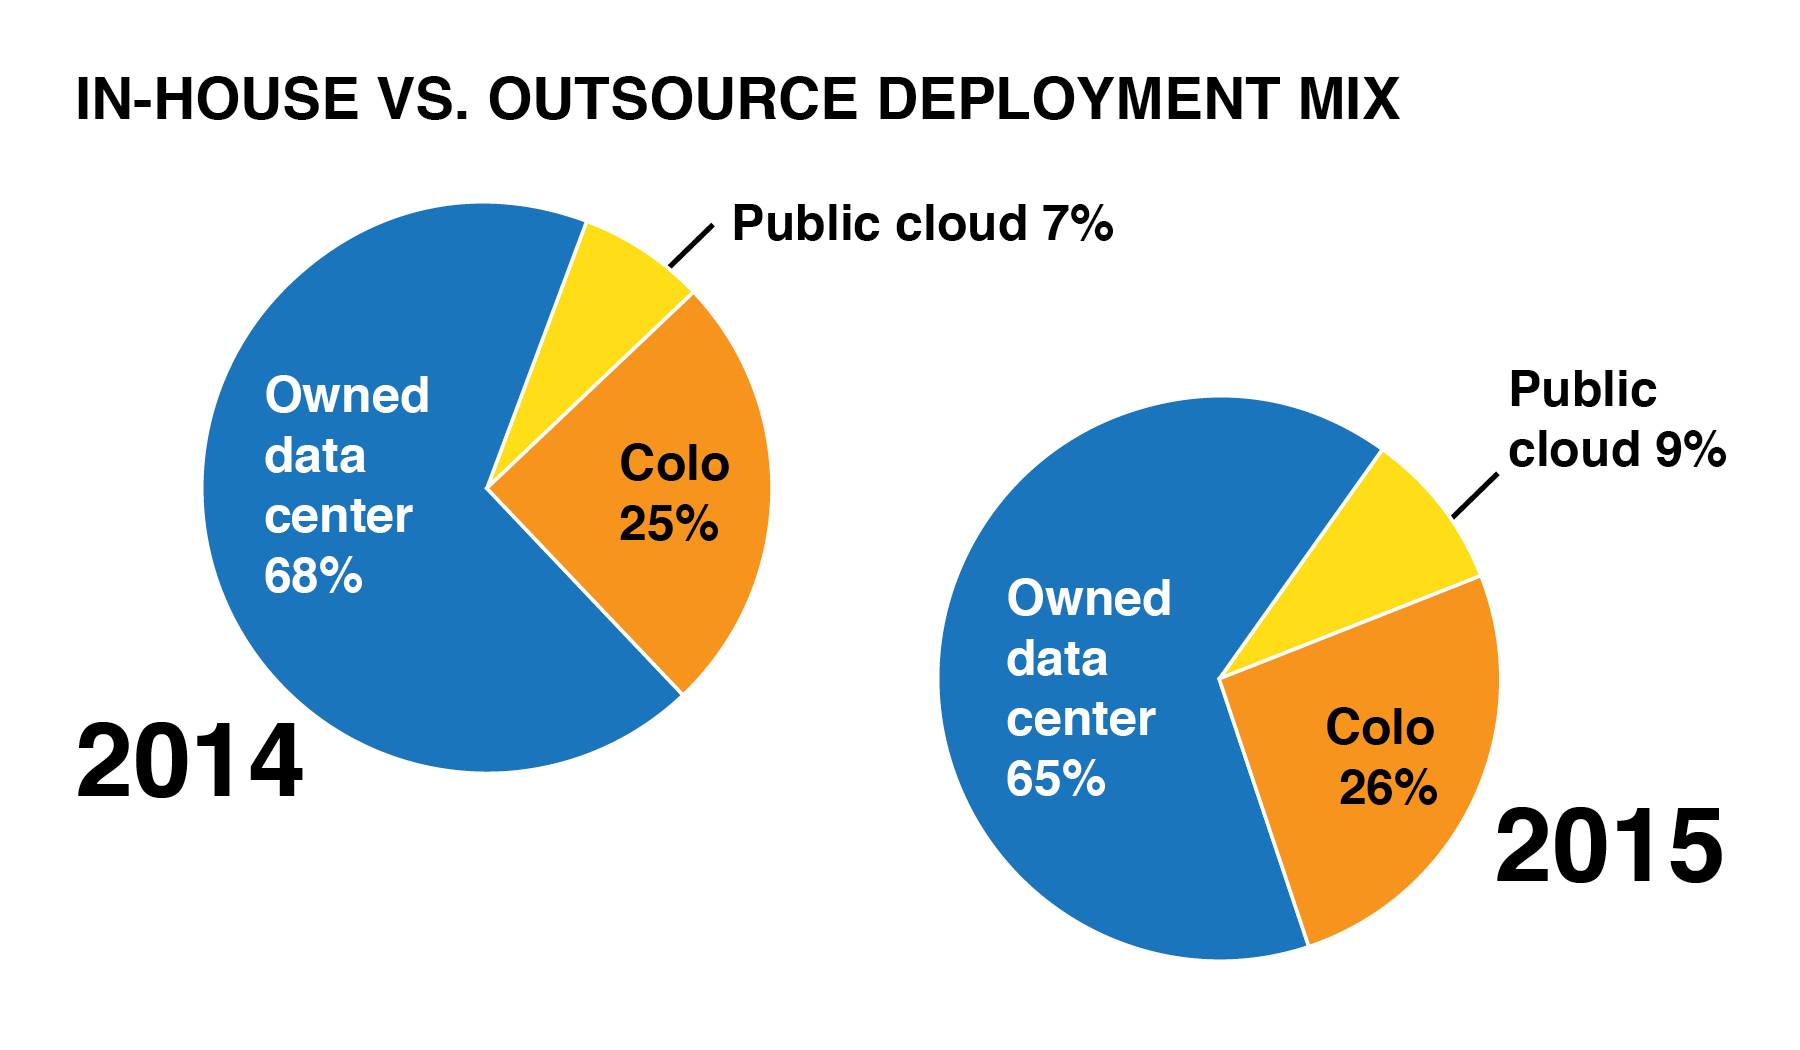
Yet, while nearly every company is deploying off-premise computing, the percentage of workloads hosted in these environments appears to be fairly static as a percentage of overall compute. The figure below represents enterprise organizations’ IT deployment mix today, and projected deployment mix in 2014. This indicates that the growth trends in off-premise computing will continue as overall enterprise IT workloads continue to grow. This finding also indicates that there is no imminent rebound or recoil in the circular trend of outsourcing-insourcing-outsourcing commonly held in IT and other key enterprise functions such as call centers.
This report will delve into the drivers and decision-making challenges for enterprise IT organizations contracting MTDCs and cloud computing in Section IV.
III. IT Efficiency
A special focus in 2014’s survey is an assessment of the behaviors, management strategies, and technologies used to improve IT efficiency.
Over the past several years, Uptime Institute has documented the rise in adoption of Power Usage Effectiveness (PUE) and the meager gains achieved by further pursuing that metric. Based on Uptime Institute’s field experience and feedback from the Uptime Institute Network (a user group of large data center owners and operators) around the world, enterprise IT executives are overly focused on PUE.
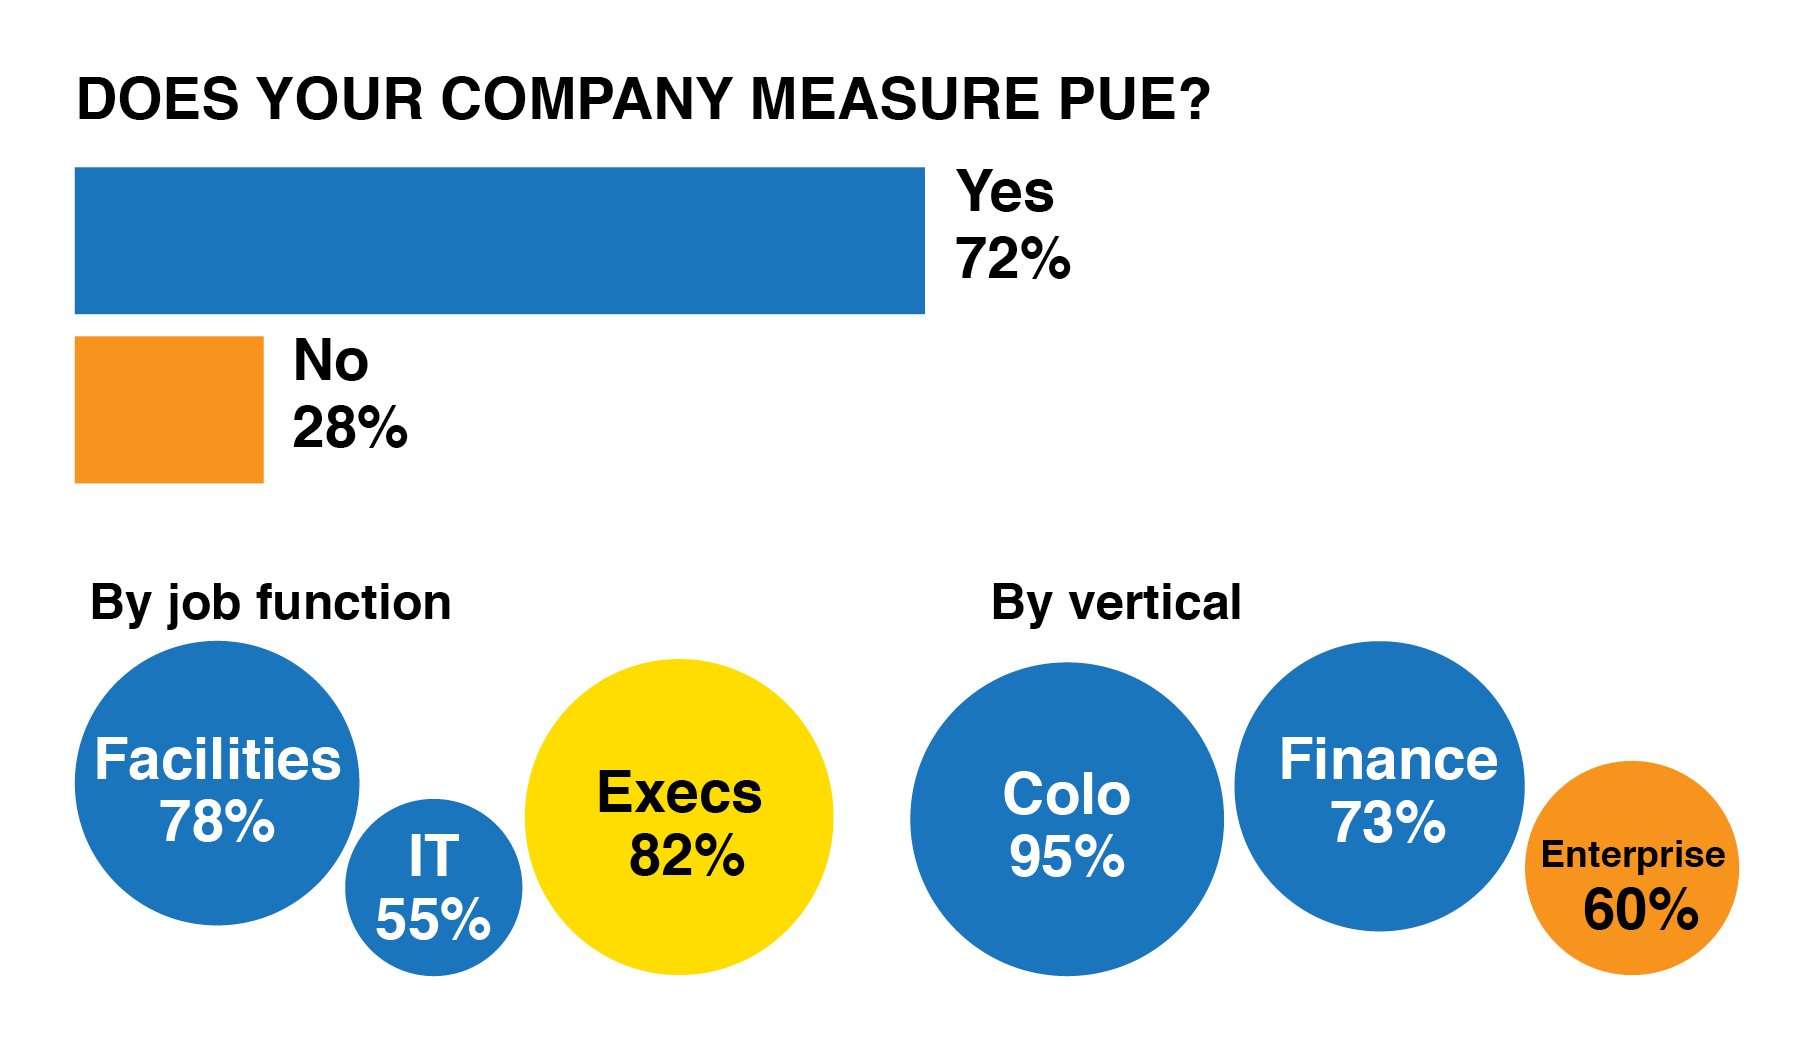
The vast majority (72%) of respondents measure PUE. Isolating the responses by job function, a huge percentage of executives (82%) are tracking that metric and reporting it to their corporate management.
PUE is an effective engineering ratio that data center facilities teams use to capture baseline data and track the results of efficiency improvements to mechanical and electrical infrastructure. It is also useful for design teams to compare equipment- or topology-level solutions. But as industry adoption of PUE has expanded, the metric is increasingly being misused as a methodology to cut costs and prove stewardship of corporate and/or environmental resources
In 2007, Uptime Institute surveyed its Network members, and found an average PUE of 2.50. The average PUE improved from 2.50 in 2007 to 1.89 in 2011 in Uptime Institute’s data center industry survey.
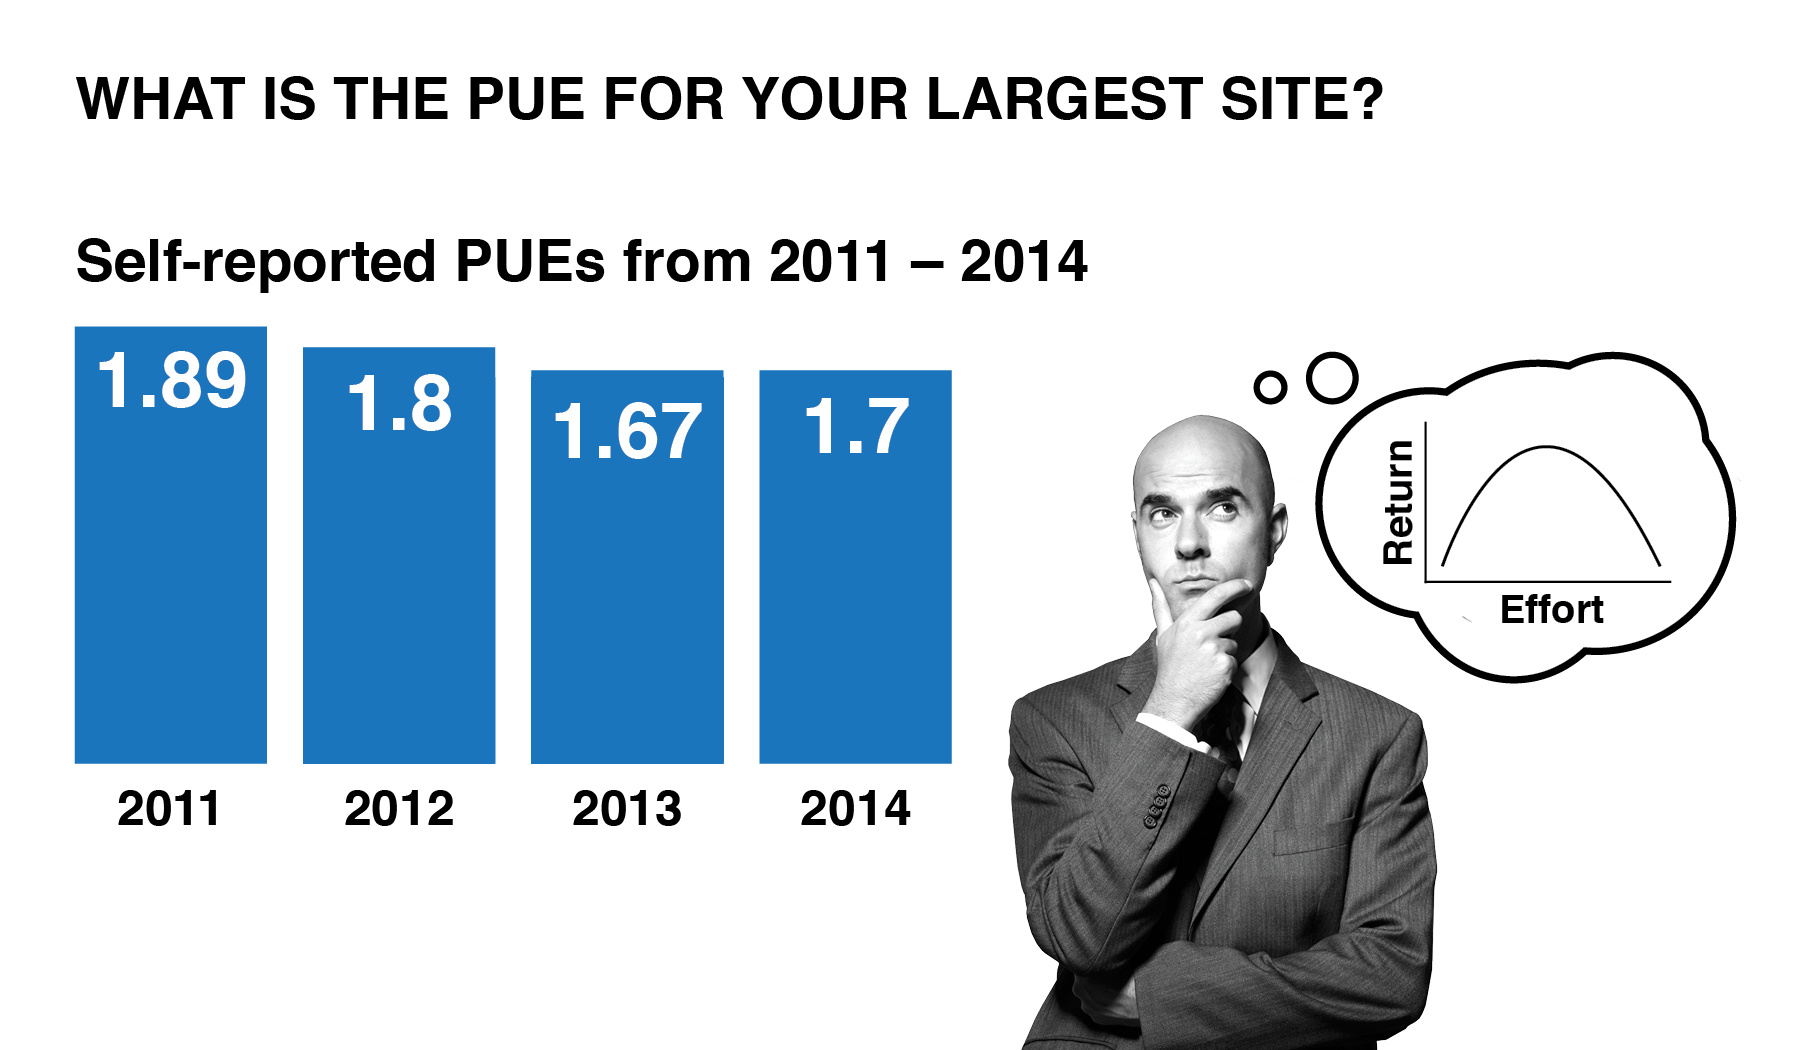
From 2011 to today, the average self-reported PUE has only improved from 1.89 to 1.7. The biggest infrastructure efficiency gains happened five years ago, and further improvements will require significant investment and effort, with increasingly diminishing returns.
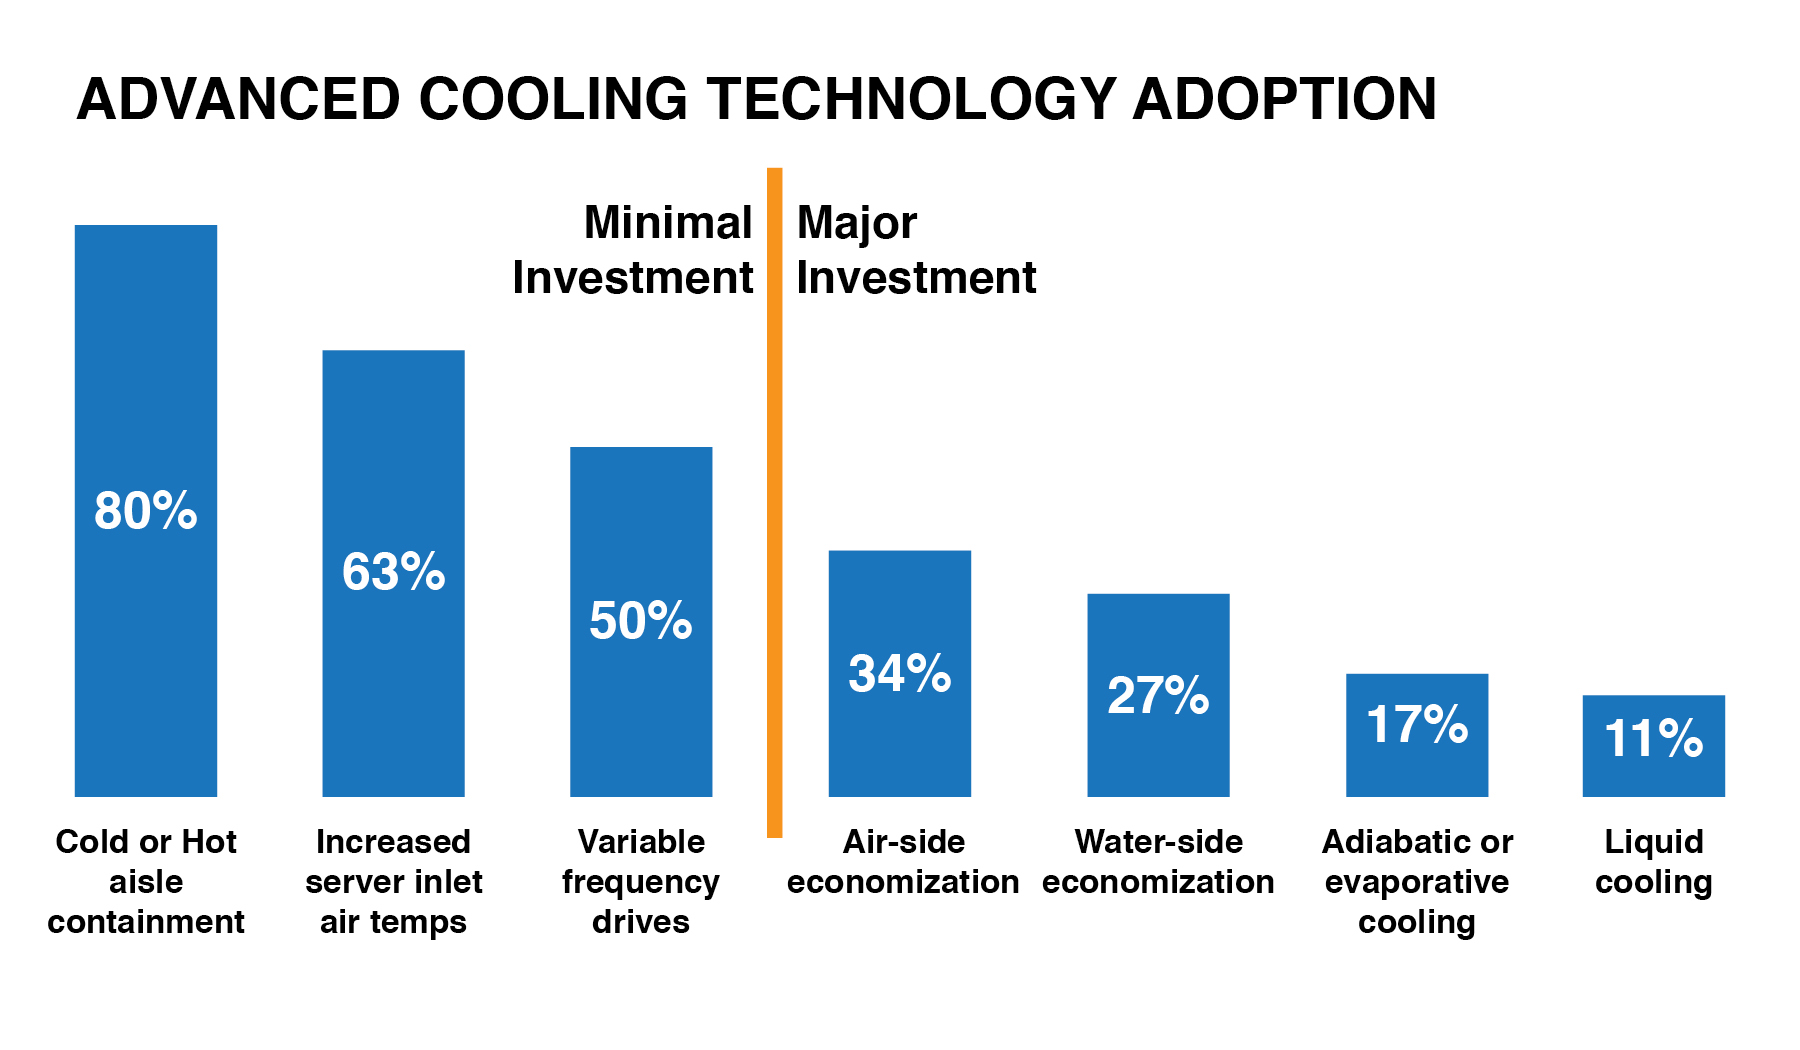
The figure following represents adoption of various data center cooling approaches to improve efficiency. The low-capital cost approaches have largely been adopted by data center operators. And yet, executives pressure for further reduction in PUE. High-cost efficiency investments in technologies and design approaches may provide negative financial payback and zero improvement of systemic IT efficiency problems.
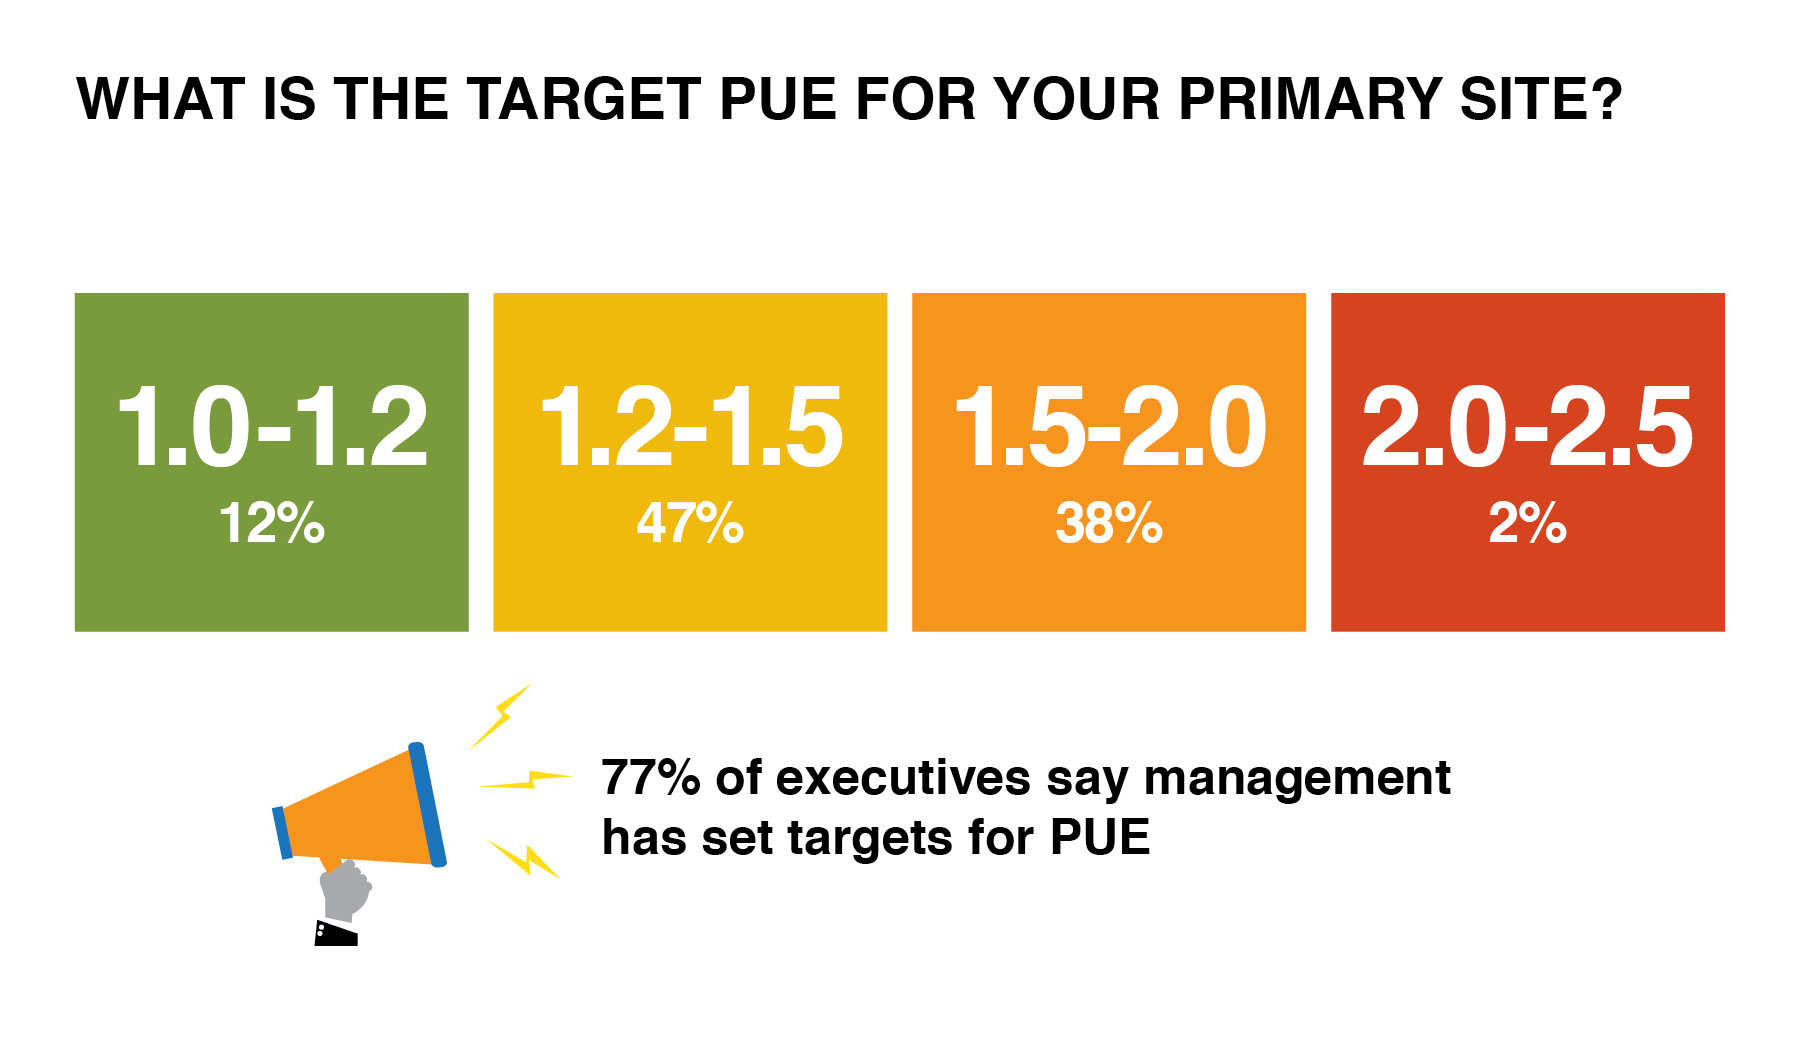
Many companies’ targets for PUE are far lower than their reported current state. By focusing on PUE, IT executives are spending effort and capital for diminishing returns and continue to ignore the underlying drivers of poor IT utilization.
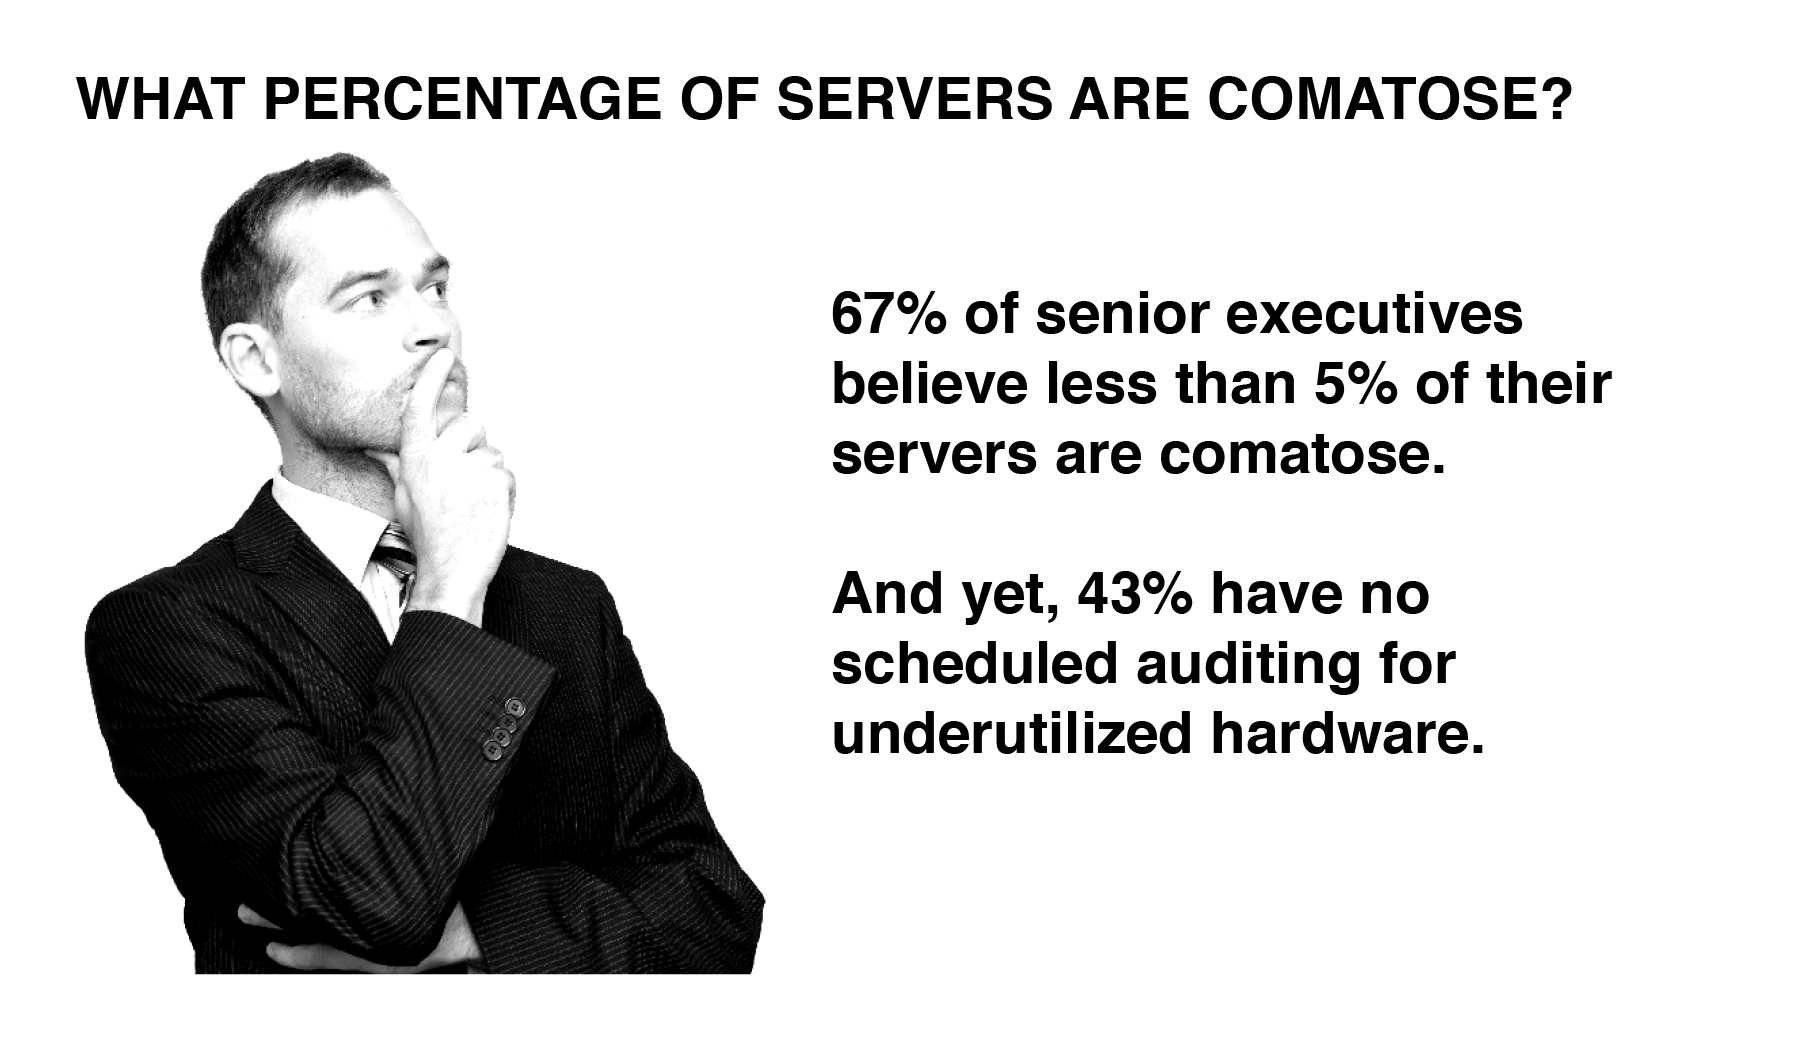
For example, Uptime Institute estimates of 20% of servers in data centers are obsolete, outdated, or unused. Yet, very few survey respondents believe their server populations include comatose machines. Nearly half of survey respondents have no scheduled auditing to identify and remove unused hardware.
Historically, IT energy efficiency has been driven by data center facilities management. According to the Uptime Institute’s Annual Data Center Industry Survey (2011-2014), less than 20% of companies report that their IT departments pay the data center power bill, and the vast majority of companies allocate this cost to the facilities or real estate budgets.
This lopsided financial arrangement fosters unaccountable IT growth, inaccurate planning, and waste. This is why 67% of the senior IT executives believe comatose hardware is not a problem.
Uptime Institute launched the Server Roundup contest in October 2011 to raise awareness about the removal and recycling of comatose and obsolete IT equipment and reduce data center energy use. Uptime Institute invited companies around the globe to help address and solve this problem by participating in the Server Roundup, an initiative to promote IT and Facilities integration and improve data center energy efficiency.
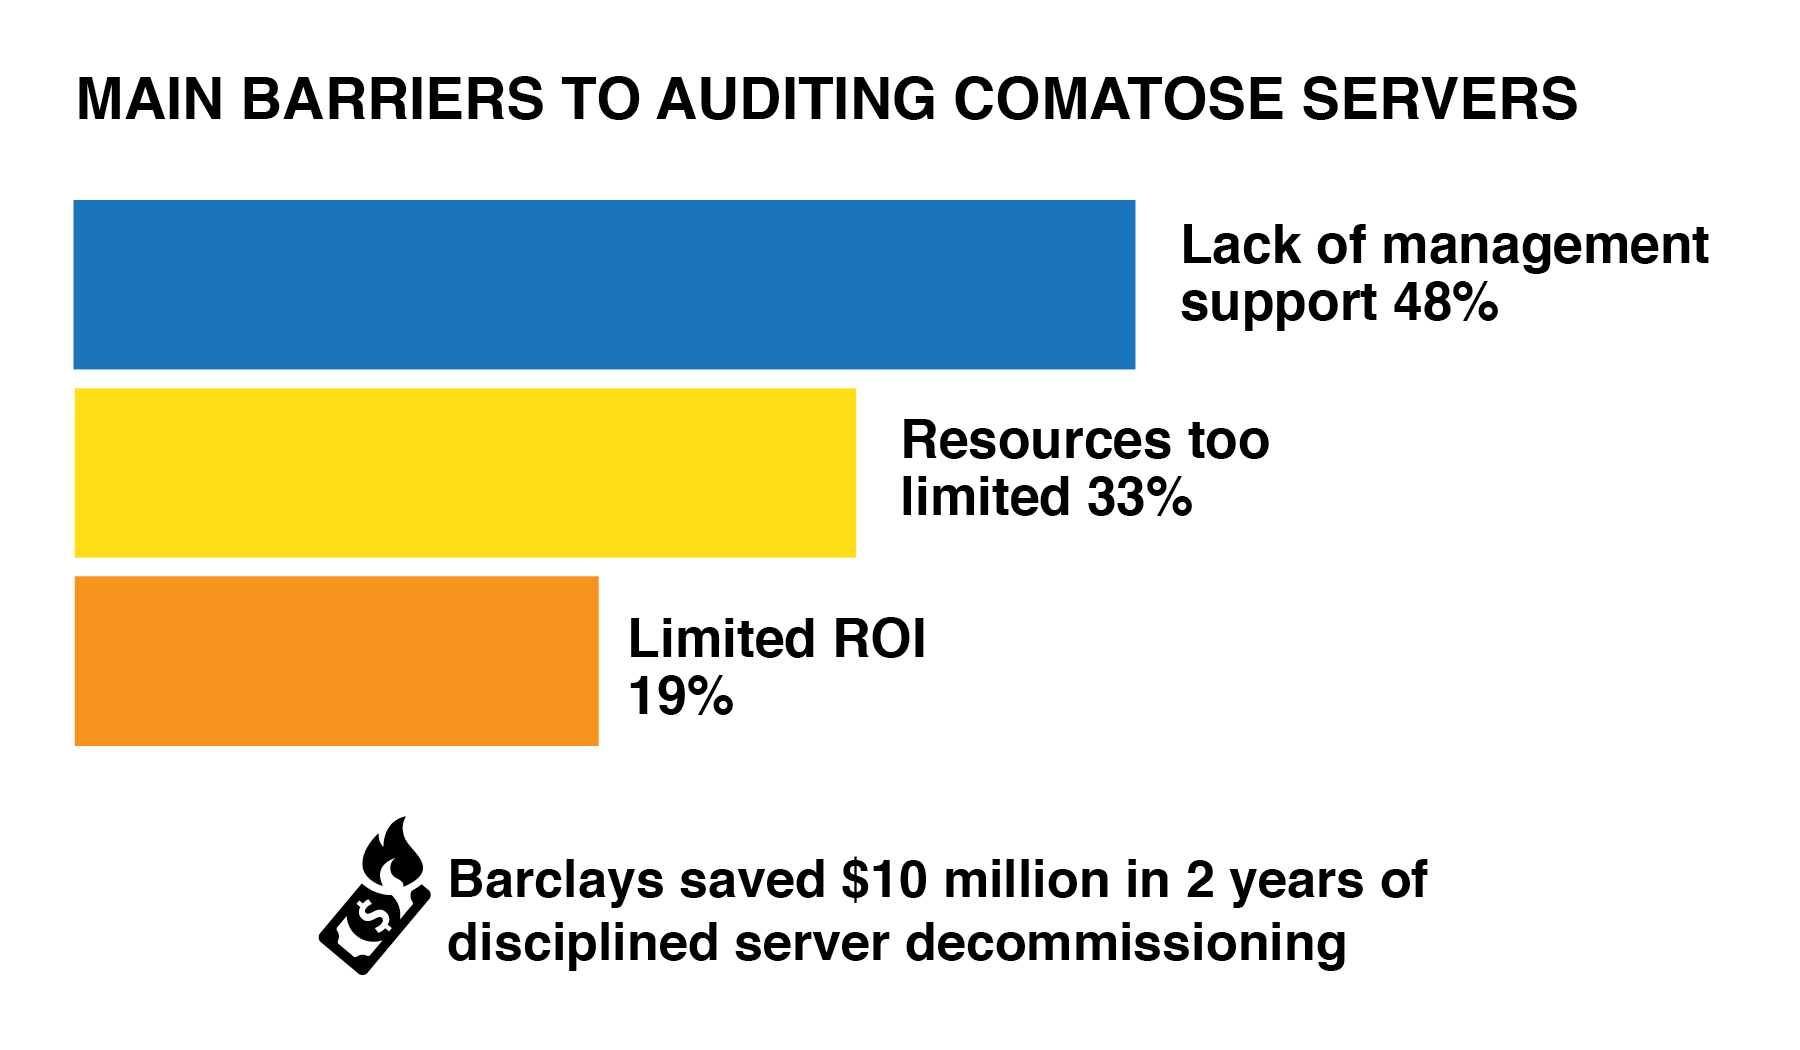
In 2 years of participating in Server Roundup, the financial firm Barclays has removed nearly 15,000 servers and saved over US$10M. Server Roundup overwhelmingly proves that disciplined hardware decommissioning can provide a significant financial impact.
Yet despite these huge savings and intangible benefits to the overall IT organization, many firms are not applying the same level of diligence and discipline to a server decommissioning plan, as noted previously.
This is the crux of the data center efficiency challenge ahead—convincing more organizations of the massive return on investment in addressing IT instead of relentlessly pursuing physical infrastructure efficiency.
Organizations need to hold IT operations teams accountable to root out inefficiencies, of which comatose servers are only the most obvious and egregious example.
For nearly a decade, Uptime Institute has recommended enterprise IT executives take a holistic approach to significantly reduce the cost and resource consumption of compute infrastructure. That approach is outlined here.
IV. Enterprise Adoption of Third-Party Data Centers and IT Services
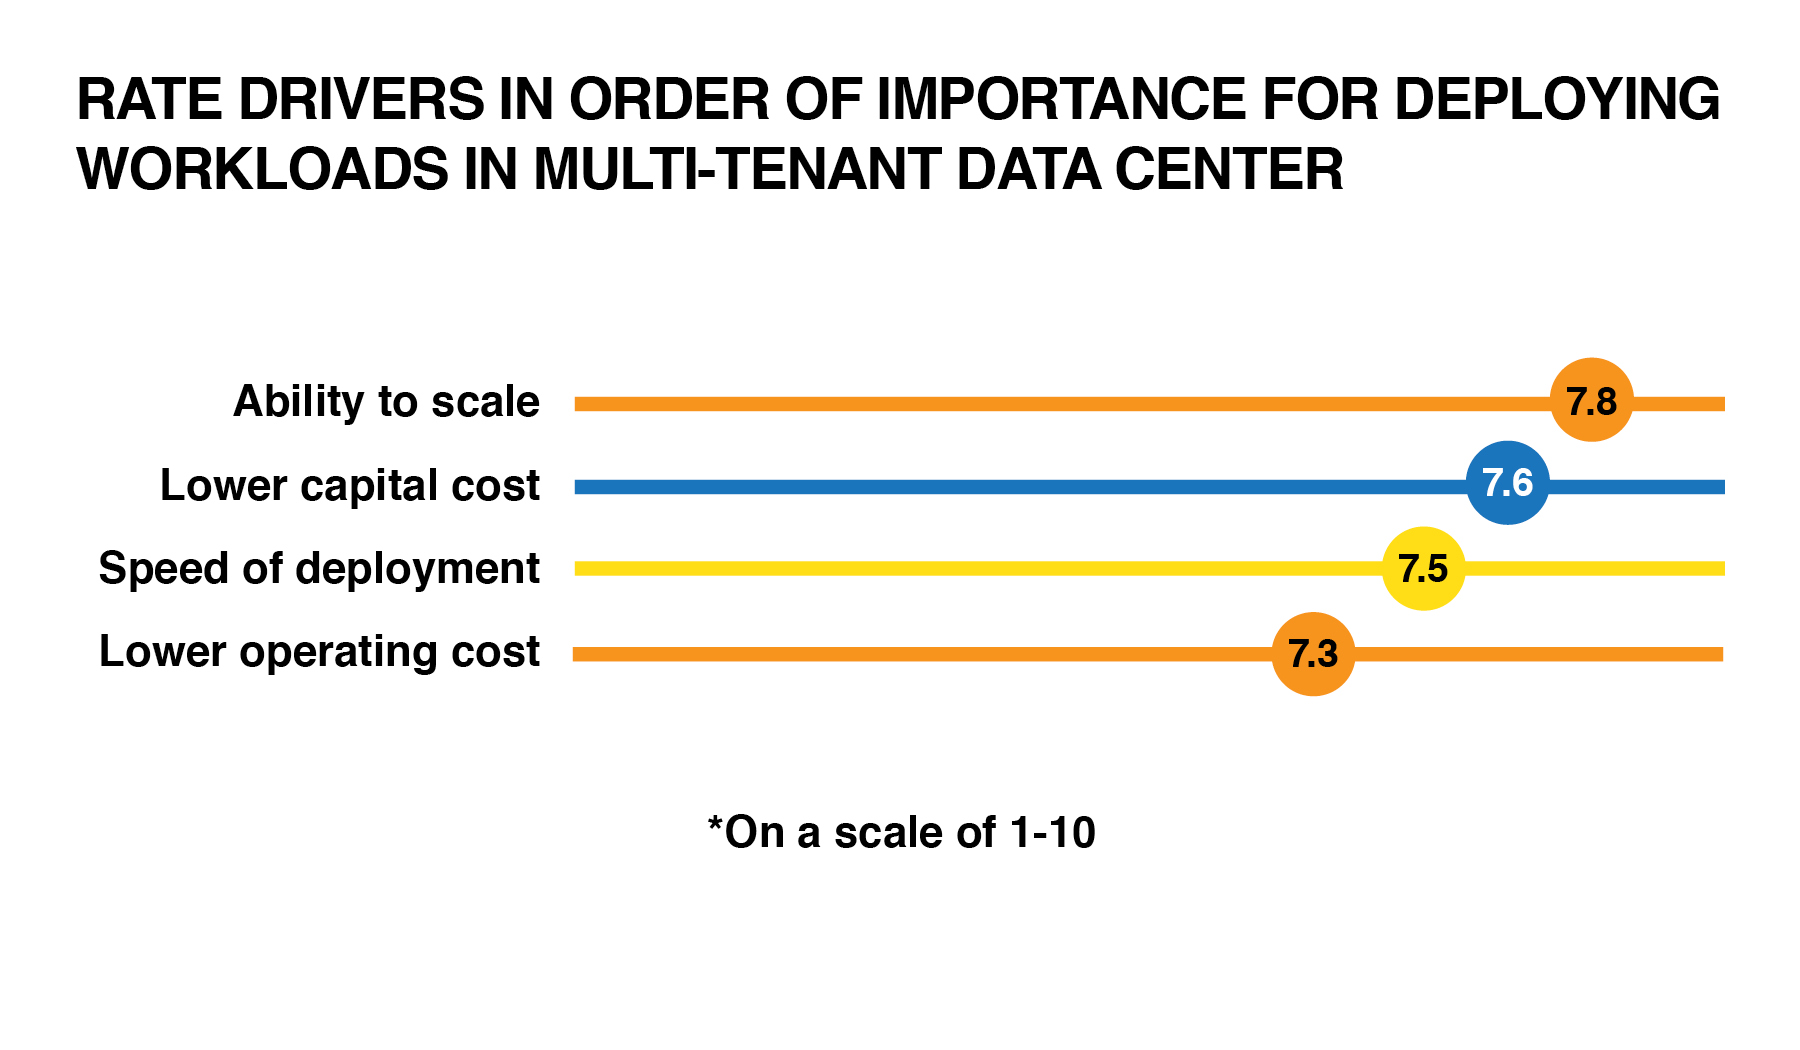
As stated earlier, nearly every enterprise organization is using some combination of in-house IT and off-premise computing. There are a number of drivers for this trend, including the ability to right-size deployments, lower the cost of investment, and getting IT workloads into production quickly.
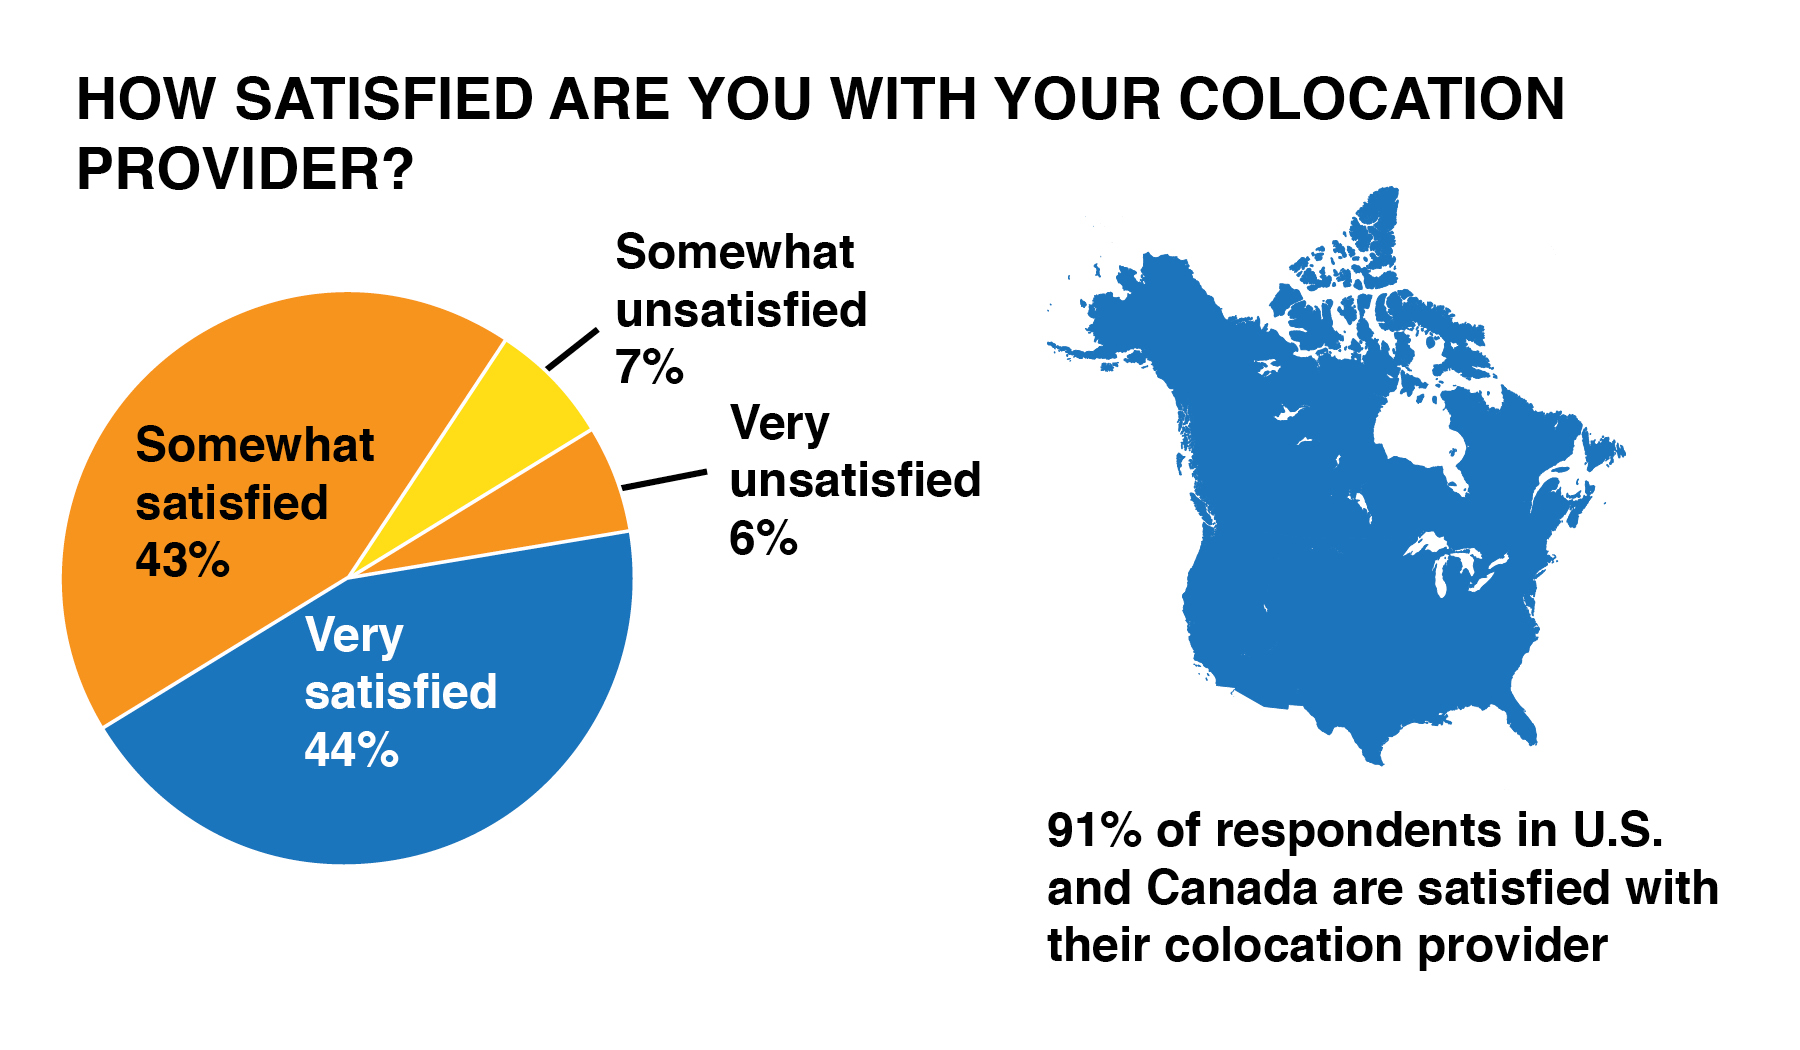
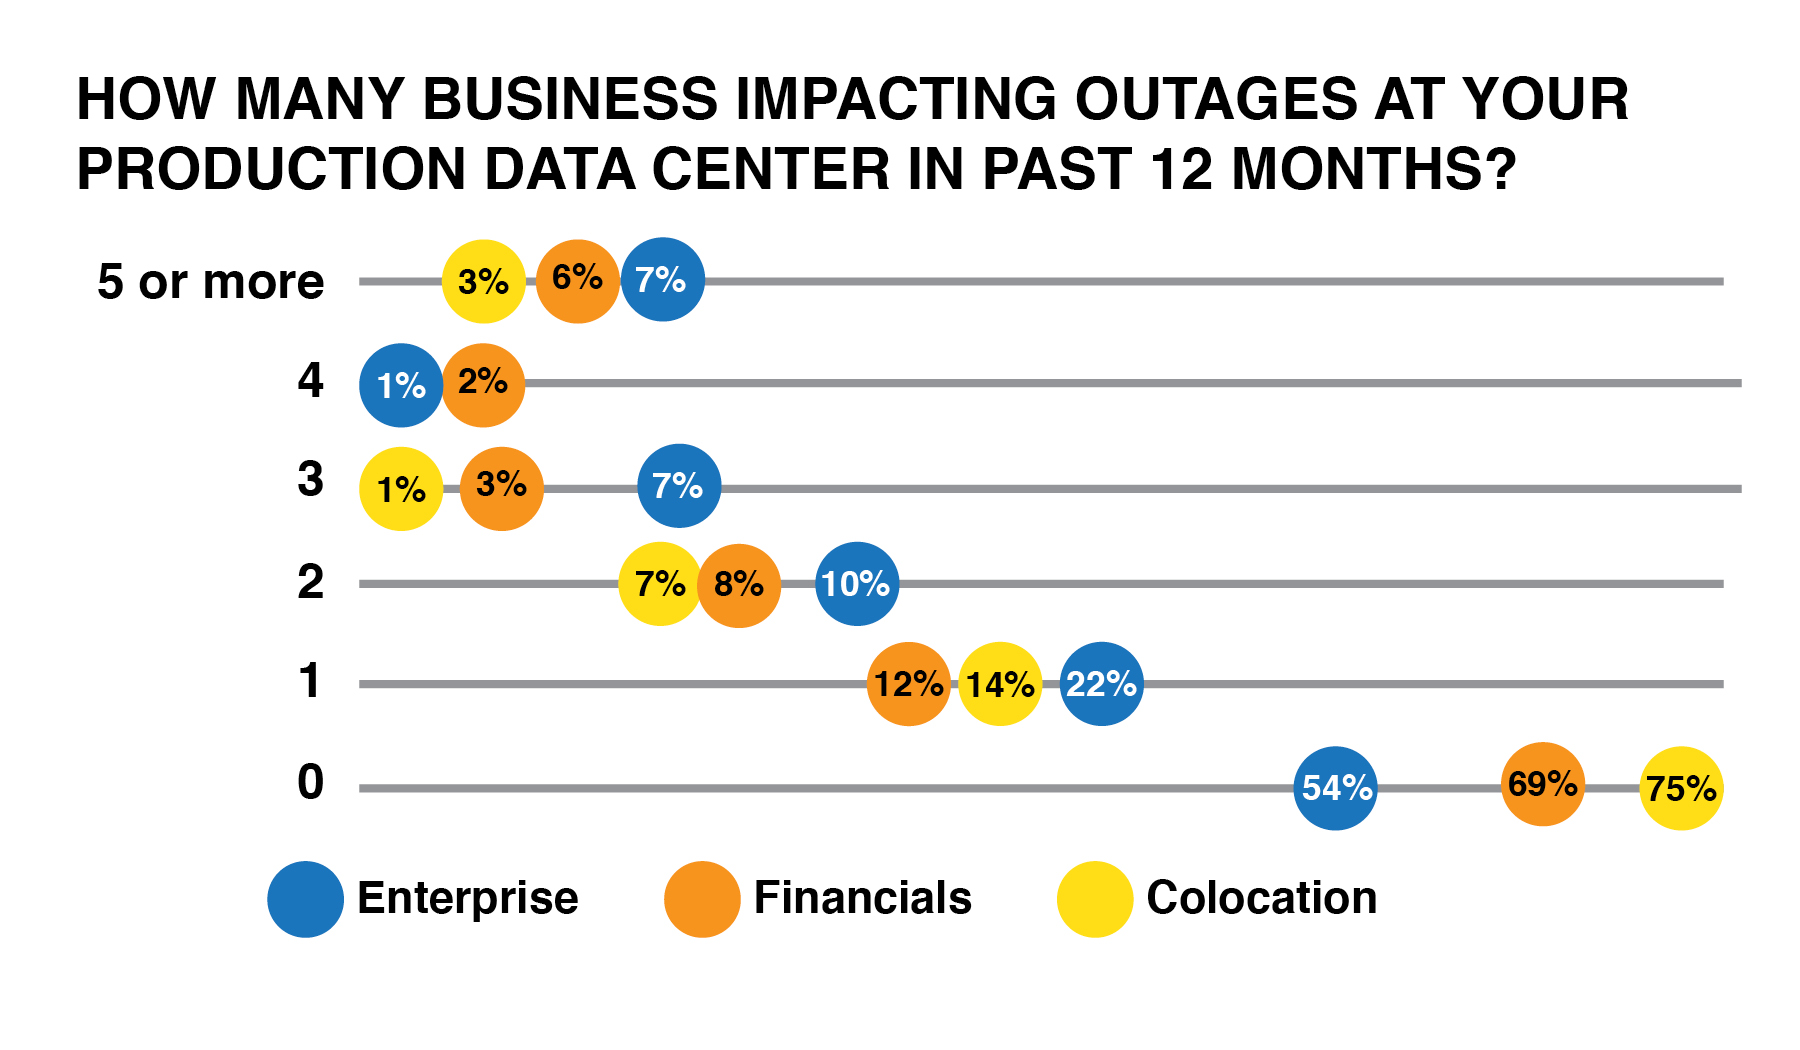
So far, enterprise organizations have largely been satisfied with their experiences using multi-tenant data center providers. In fact, in this unverified and self-reported survey, the colocation operators report fewer outages than their enterprise counterparts.
Despite many enterprise organizations currently reporting satisfaction with colocation providers, the deployment to off-premise computing has not always been a smooth transition. In Uptime Institute’s experience, many large enterprise organizations historically ran their own data centers, and only recently started deploying into third-party sites at scale. The facilities and corporate real estate teams who are often responsible for managing these companies have limited experience in contract terms, service level agreements, pricing, and other challenges specific to an outsourced IT relationship.
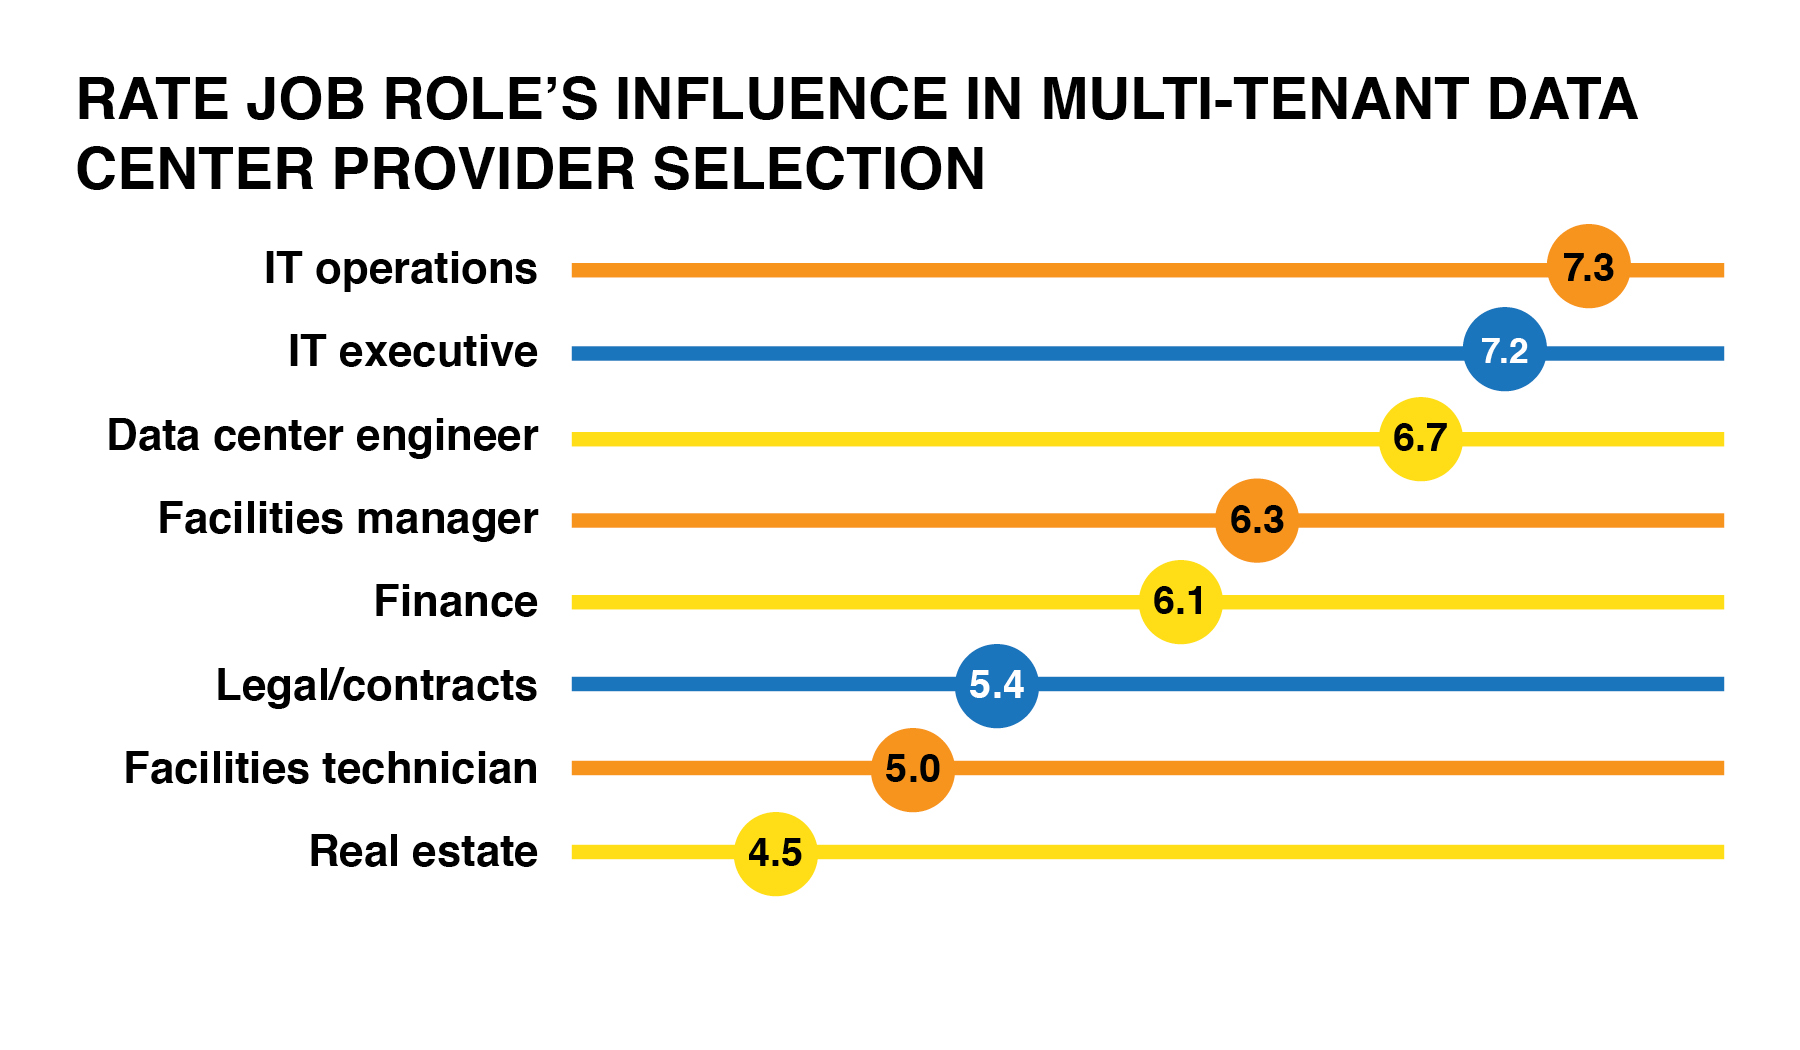
In fact, the decision over whether to outsource an IT workload and where to host it typically comes from the IT department, and not the management team that ultimately holds responsibility for that contract.
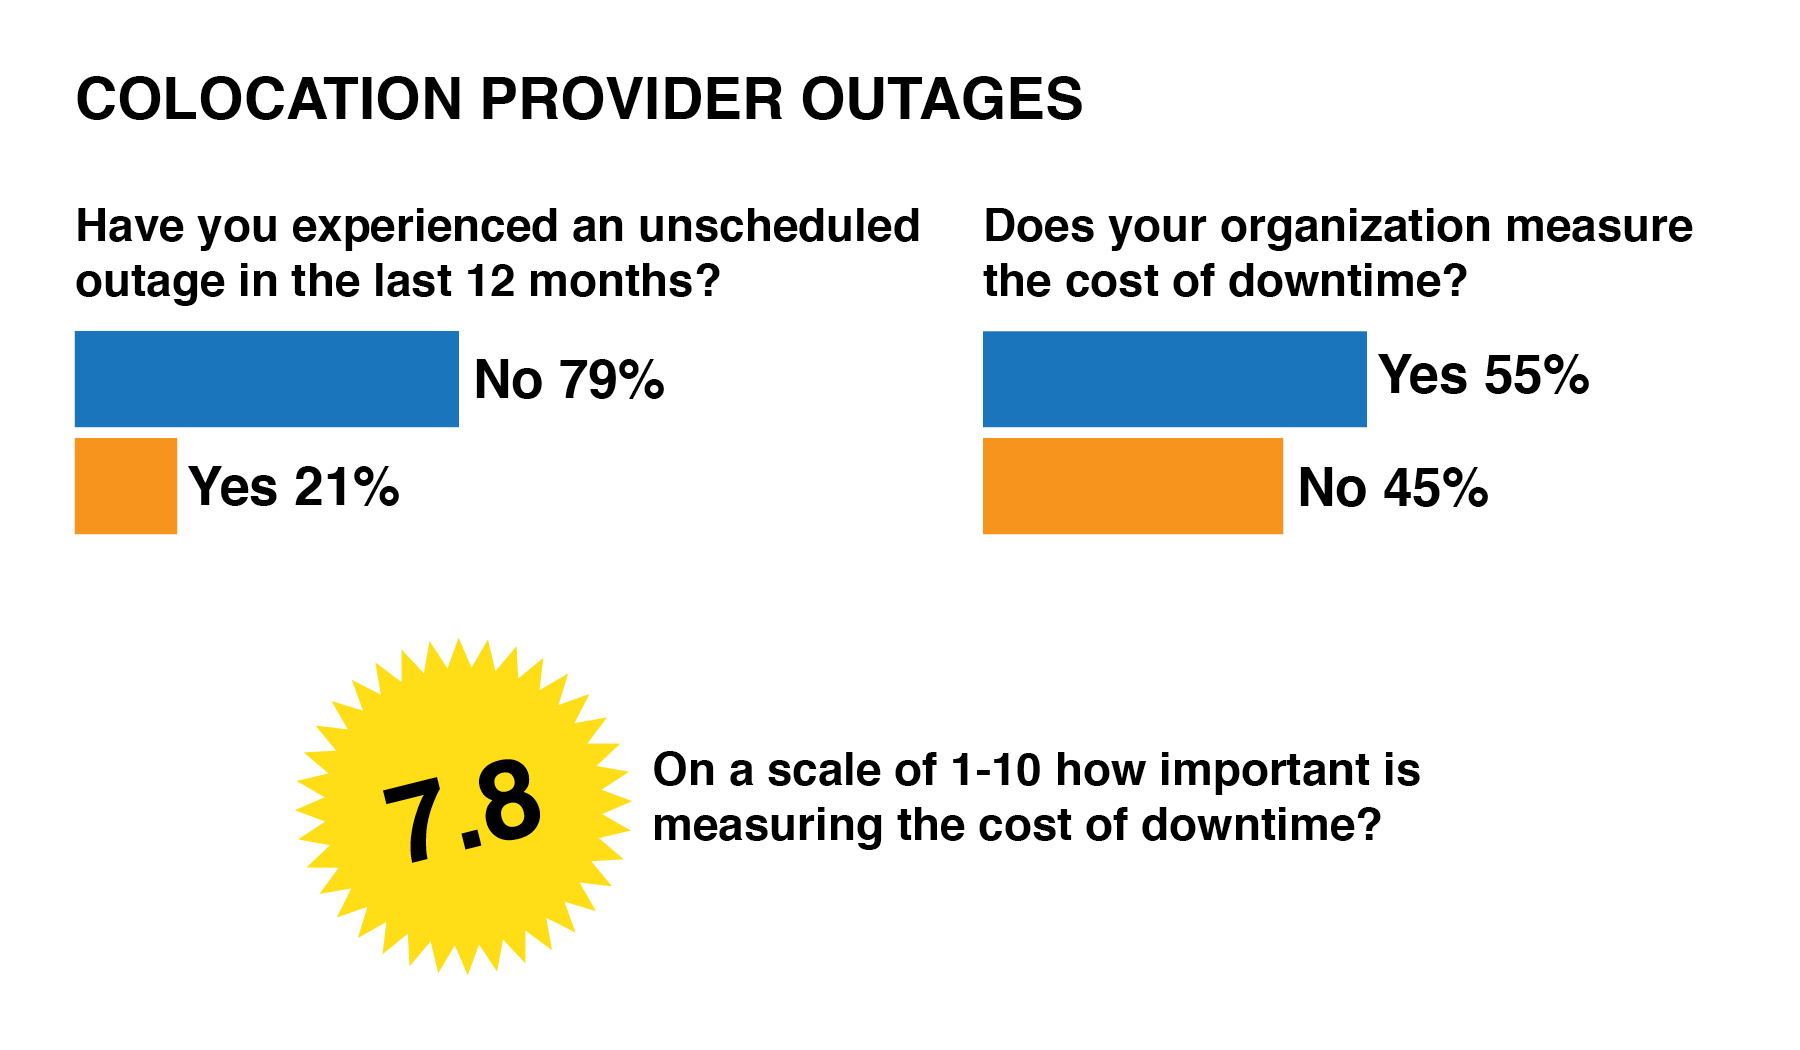
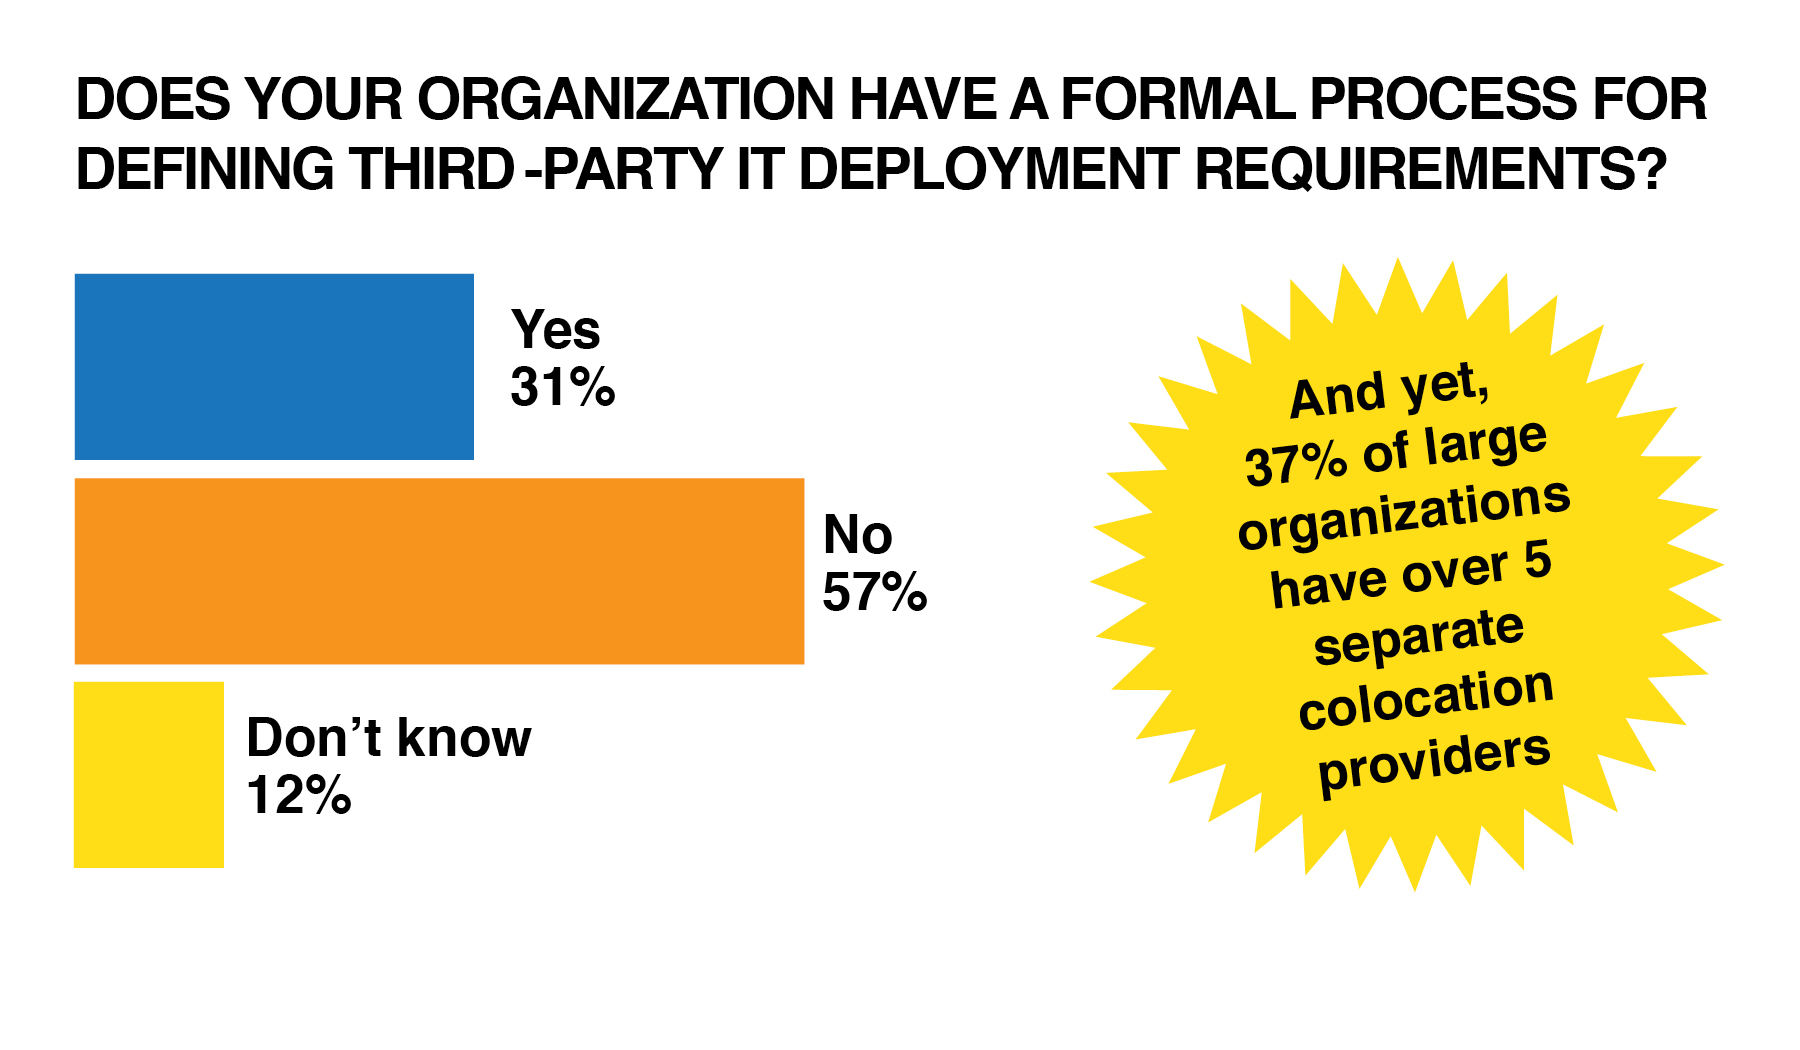
The facilities managers and data center engineers are expected to become experts in third-party data center management on the fly—to learn on the job. All the while, the usage of third-party data center providers is rapidly expanding, and very few enterprises have formalized requirements for engaging with the MTDC market. A large percentage cannot track the cost of downtime for their organizations.
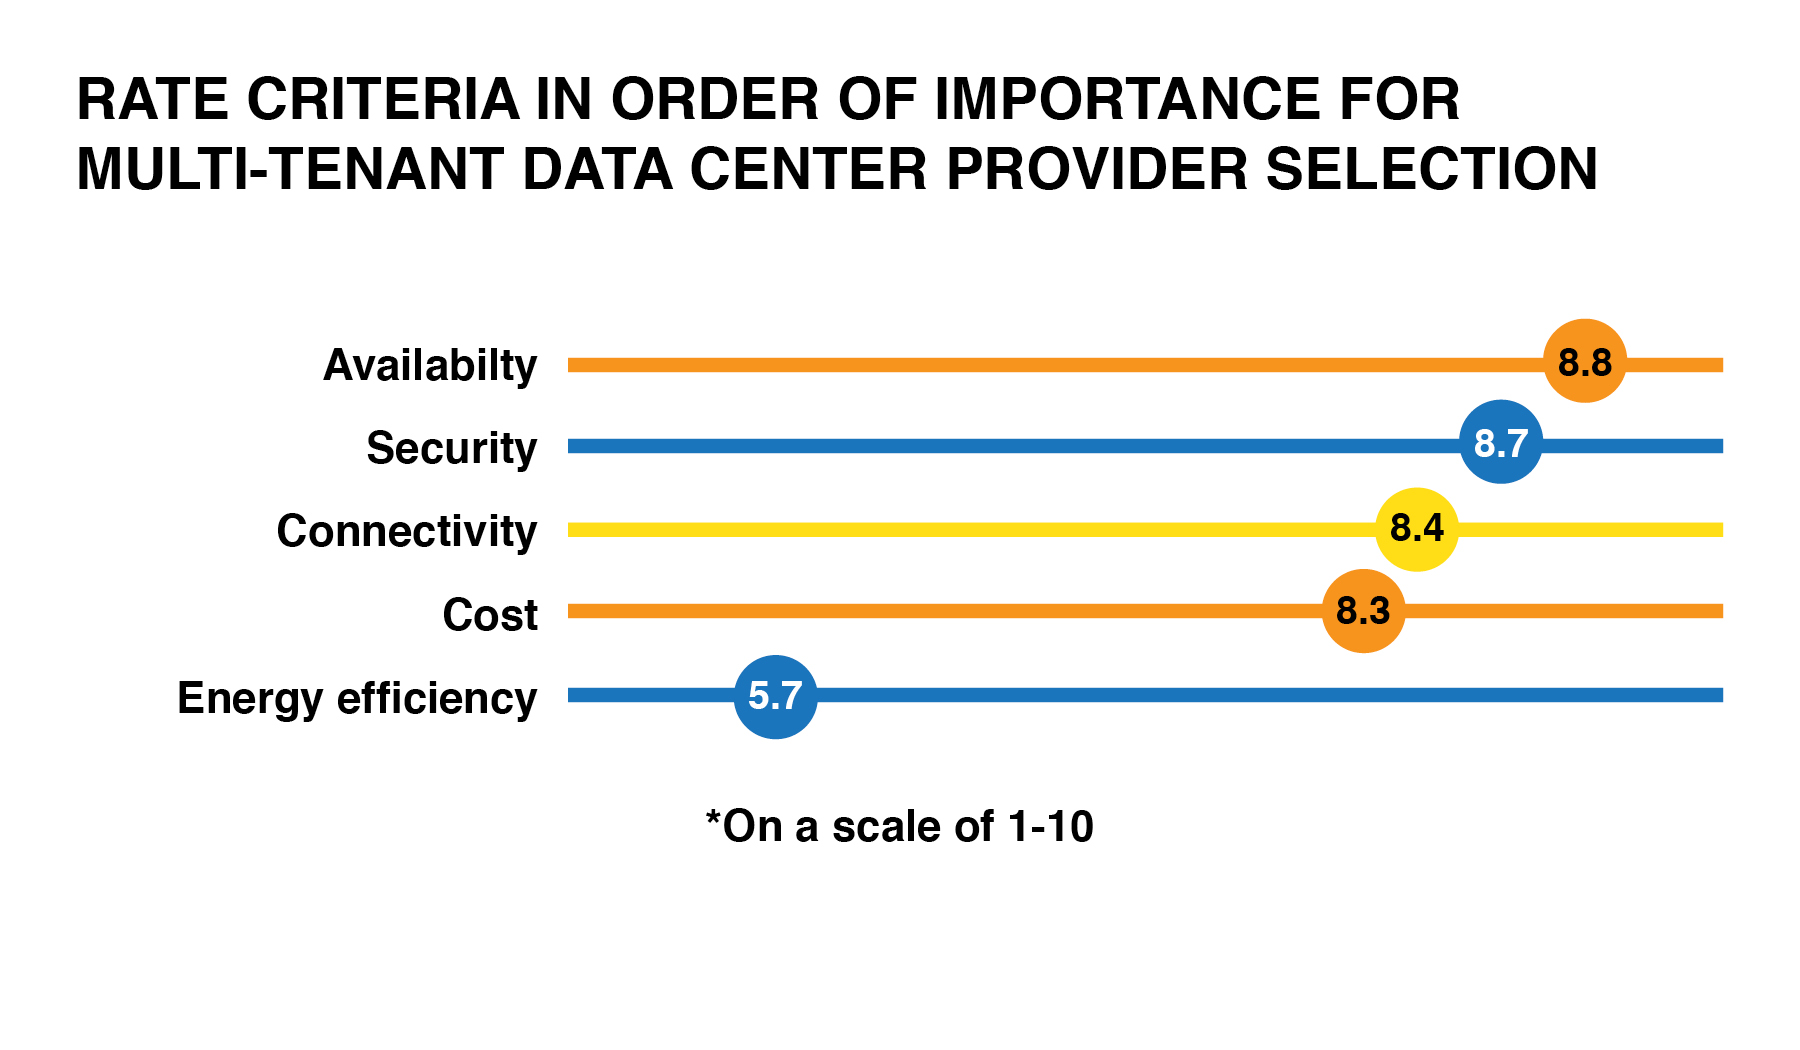
The vast majority of enterprise organizations are blasting workloads into off-premise computing environments, but they don’t know where they are going, or what their staff are supposed to do when they get there. Many organizations are making decisions on a very limited selection of criteria and inputs.
 Ultimately, this was the primary reason Uptime Institute developed the FORCSS™ Methodology in 2012.
Uptime Institute FORCSS is a means to capture, compare, prioritize, and communicate the benefits, costs, and impacts of multiple IT deployment alternatives. Deployment alternatives may include owned/existing data centers, commercial data centers (wholesale, retail, colocation, managed service), or IaaS (including cloud) that is procured on a scale or limited basis.
FORCSS provides organizations with the flexibility to develop specific responses to varying organizational needs. A case study series will present the process of applying the FORCSS Factors to specific deployment options and present the outcome of the FORCSS Index—a concise structure that can be understood by non-IT executive management.
Please refer to the FORCSS Introduction and FORCSS Case Study 1.
Conclusions
- Enterprise companies are investing less in their own data centers. Instead, they are deploying their IT in off-premise data center environments. This trend goes back through the 4 years Uptime Institute has conducted this survey. This trend is leading to massive spending in the MTDC market. This spending does not show signs of abating.
- Although more IT workloads are moving to third-party providers (especially new workloads), the enterprise-owned data center will continue to be responsible for much core IT production for the foreseeable future.
- Enterprise organizations are satisfied with the performance of their current MTDC providers, but very few companies have the expertise or processes in place yet to manage or even make the most effective decisions about off-premise computing options.
- As noted in previous years, IT efficiency efforts have largely been limited to data center facilities management and design teams. Very little work has been done to address the systemic IT inefficiencies that have plagued the industry for nearly a decade. But as senior executives push for more improvements in efficiency, many will realize they are running out of return on investment; hopefully, they will turn to improving IT utilization.
- A large majority (75%) of survey participants said the data center industry needs a new energy efficiency metric.
Appendix
Additional 2014 survey responses:
i. If your organization has adopted Cold Aisle or Hot Aisle containment, approximately what percentage of your cabinets uses this design?
a. Less than 10% contained: 22%
b. 10-25% contained: 13%
c. 25-50% contained: 12%
d. 50% contained: 7%
e. 50-75% contained: 16%
f. 75-100% contained: 30%
ii. Would your organization consider a data center that did not include the following designs/technologies?
a. Raised floor: 52% yes
b. Mechanical cooling: 24% yes
c. Generator: 8% yes
d. Uninterruptible power supply: 7% yes
iii. Does management receive reports on data center energy costs?
a. Yes: 71%
b. No: 29%
iv. Does management set targets for reducing data center energy costs?
a. Yes: 54%
b. No: 46%
v. How does your organization measure PUE?
a. PUE Category 0: 30%
b. PUE Category 1: 25%
c. PUE Category 2: 19%
d. PUE Category 3: 11%
e. Alternative method: 8%
f. Don’t know: 7%
vi. Does your company report PUE publicly?
a. Yes; 10%
b. No; 90%
vii. Has your organization achieved environmental or sustainability certifications for any of its data centers?
a. Colo/MTDC: 35% yes
b. Financial Services: 46% yes
c. Other Enterprises: 21% yes
viii. Considering your company’s primary multi-tenant or colocation provider, what is the length of the commitment you have made to that provider?
a. Under 2 years
i. Financial Services: 28%
ii. Other Enterprise: 36%
b. 2-3 years
i. Financial Services: 11%
ii. Other Enterprise: 22%
c. 3-5 years
i. Financial Services: 30%
ii. Other Enterprise: 21%
d. Over 5 years
i. Financial Services: 32%
ii. Other Enterprise: 21%
ix. If your organization measures the cost of data center downtime, how do you use that information?
a. Report to management: 88%
b. Rationalize equipment purchases: 51%
c. Rationalize services purchases: 42%
d. Rationalize increased staff or staff training: 39%
e. Rationalize software purchases: 32%
x. Does your organization perform unscheduled drills that simulate data center emergencies?
a. Yes: 44%
b. No: 56%
xi. Considering your organization’s largest enterprise data center, what staffing model is used for facilities staff?
a. 24 hours a day, 7 days a week: 70%
b. Other: 30%
Email Uptime Institute Director of Content and Publications Matt Stansberry with any questions or feedback: mstansberry@uptimeinstitute.com.
This paper provides analysis and commentary of the Uptime Institute survey responses. Uptime Institute makes reasonable efforts to facilitate a survey that is reliable and relevant. All participant responses are assumed to be in good faith. Uptime Institute does not verify or endorse the responses of the participants; any claims to savings or benefits are entirely the representations of the survey participants.