
Documenting Underfloor Conditions in an Operational Data Center
Excel is the basis of a surprisingly simple visual tool to document underfloor conditions
By Chad Beery, ATD
Engineers regularly employ pictures and drawings to communicate design ideas. They sketch on whiteboards during a meeting, talk with their hands and sometimes even sketch on the back of napkins. In fact, the deliverables produced by design engineers and consultants include drawings—although today these are typically computer-generated. And while it is true that engineers and design consultants rely on all sorts of images, it is equally true that sometimes only a photograph can capture and convey important details accurately. The composite underfloor picture is one such instance.
Take, for example, a large enterprise that has a 14,000-square-foot (ft2) computer room with a 30-inch raised floor. Chilled-water air-handling units fed from a piping loop in the raised floor provided cooling, with most of the piping having been installed in the early 1990s. As part of a room refresh, the enterprise engaged Peters, Tschantz & Associates to develop a plan to replace the piping without interrupting service to the active computer room.
Even with a very clear underfloor plenum, replacing piping without interrupting service in a computer room is a difficult task—demolition and welding present hazards to sensitive equipment, and floor space for rigging and staging is at a premium. In this case, extensive copper and fiber data cables as well as power whips run under the floor compounded the complexity. In many areas, the cabling had been abandoned in place as equipment was removed. Over time, the problem became worse, as more and more abandoned cables made it even less clear what was in service and what could be safely removed.
Peters, Tschantz & Associates began its design work with a field investigation to help it fully understand the existing conditions. We were able to document the existing piping and create a three-dimensional model (Revit) of the piping. We knew that understanding the location of the power and data cabling was crucial to completing this project successfully.
Simple observation told us that it would be very impractical, if not impossible, to document and present the underfloor condition with enough detail to accurately convey the complexity of the work. As an alternative, we developed a technique to create a composite photograph of the entire underfloor plenum (see Figure 1).
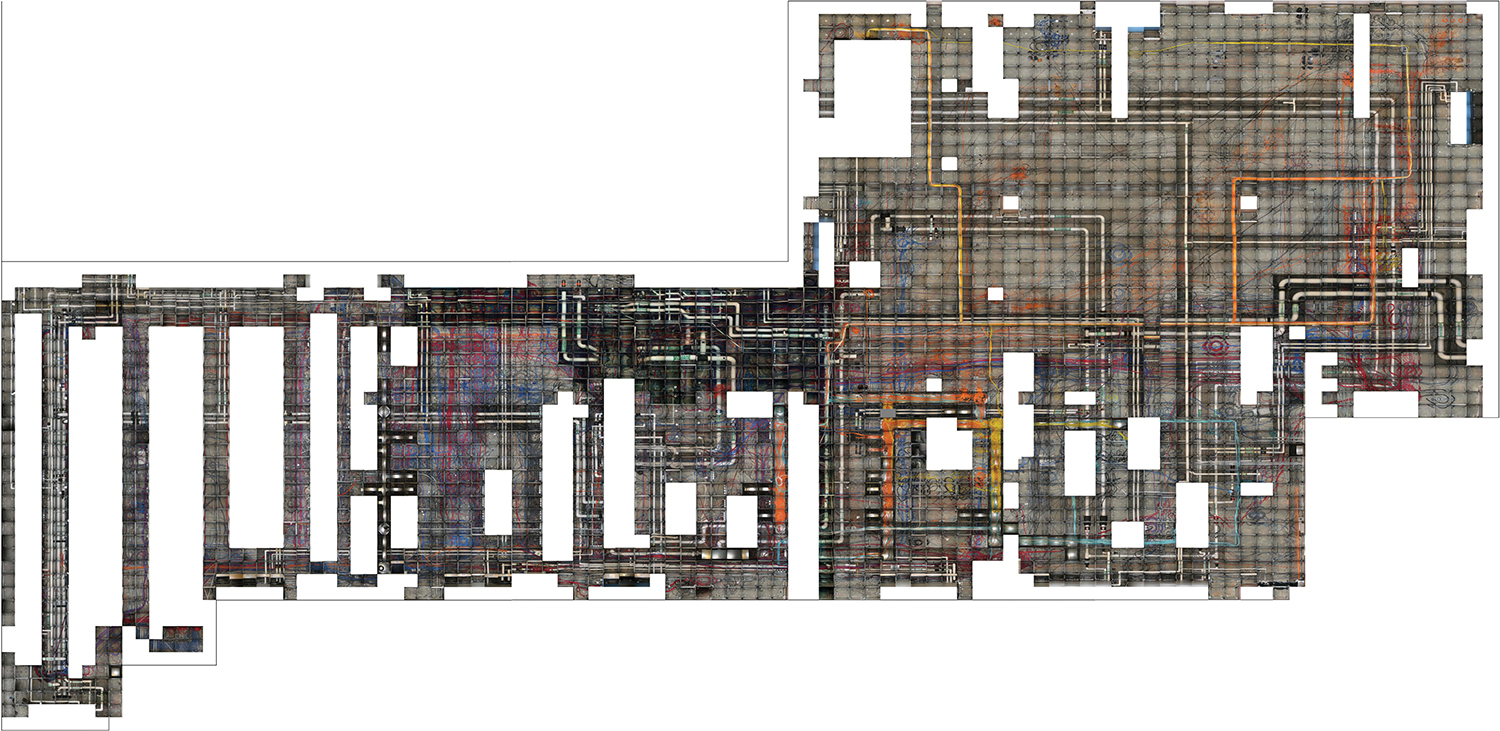
Overview of the entire facility pieced together using individual photos and Excel.
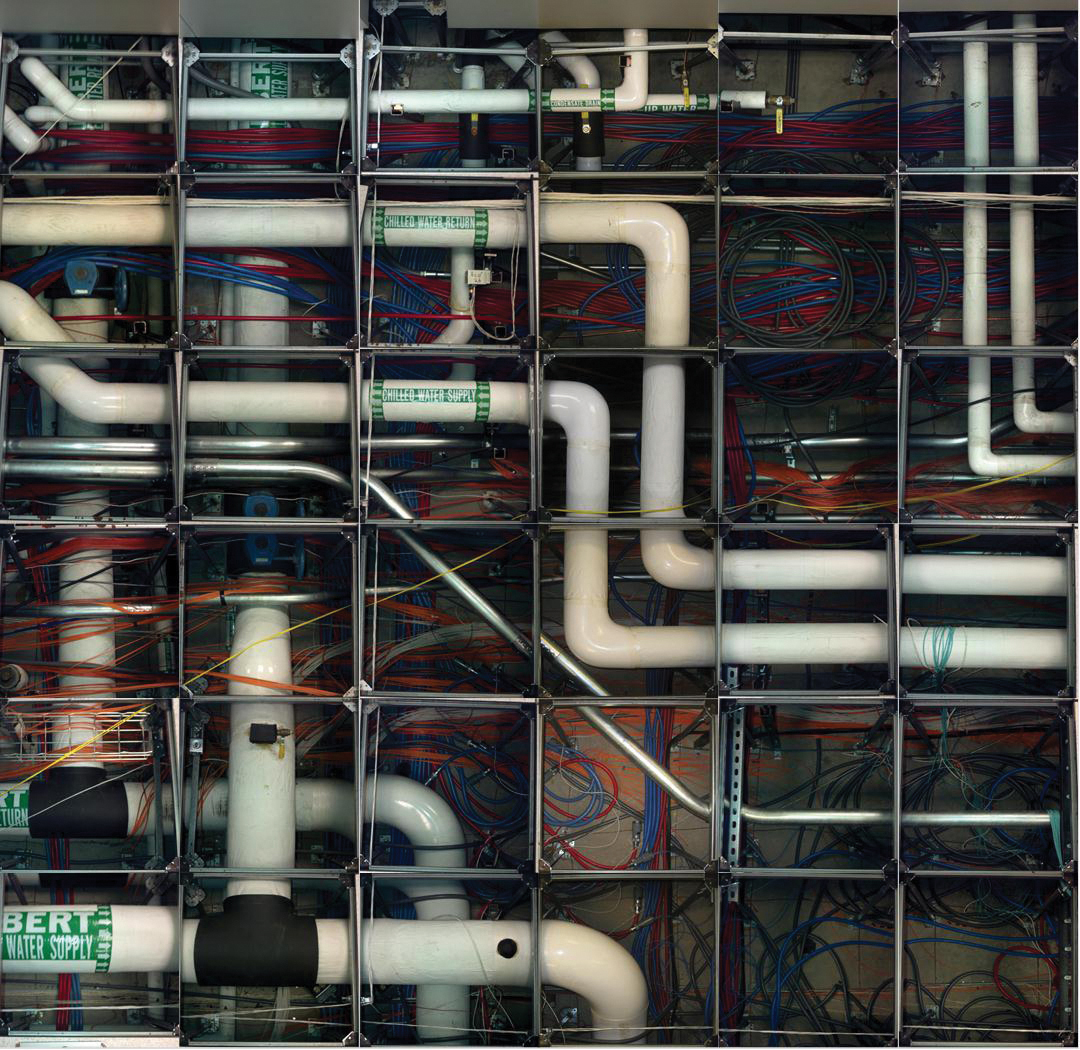
First, we established a labeling nomenclature for floor tiles (letters for columns, numbers for rows). Then we lifted the floor tiles one at a time, so that we could take a digital photograph of the underfloor plenum directly beneath each tile. In some cases, equipment such as PDUs, CRACs and IT cabinets on the tiles blocked our efforts. As the photographs were taken, we recorded their addresses on a dry erase board laid next to the open tile.
Post-processing work began as soon as the last of the photographs was taken. We renamed the photographs using the column-and-row nomenclature. We cropped all the photos to a 1:1 aspect ratio (see Figure 3) to match the 24-by-24-inch floor tile opening and then compressed the files.
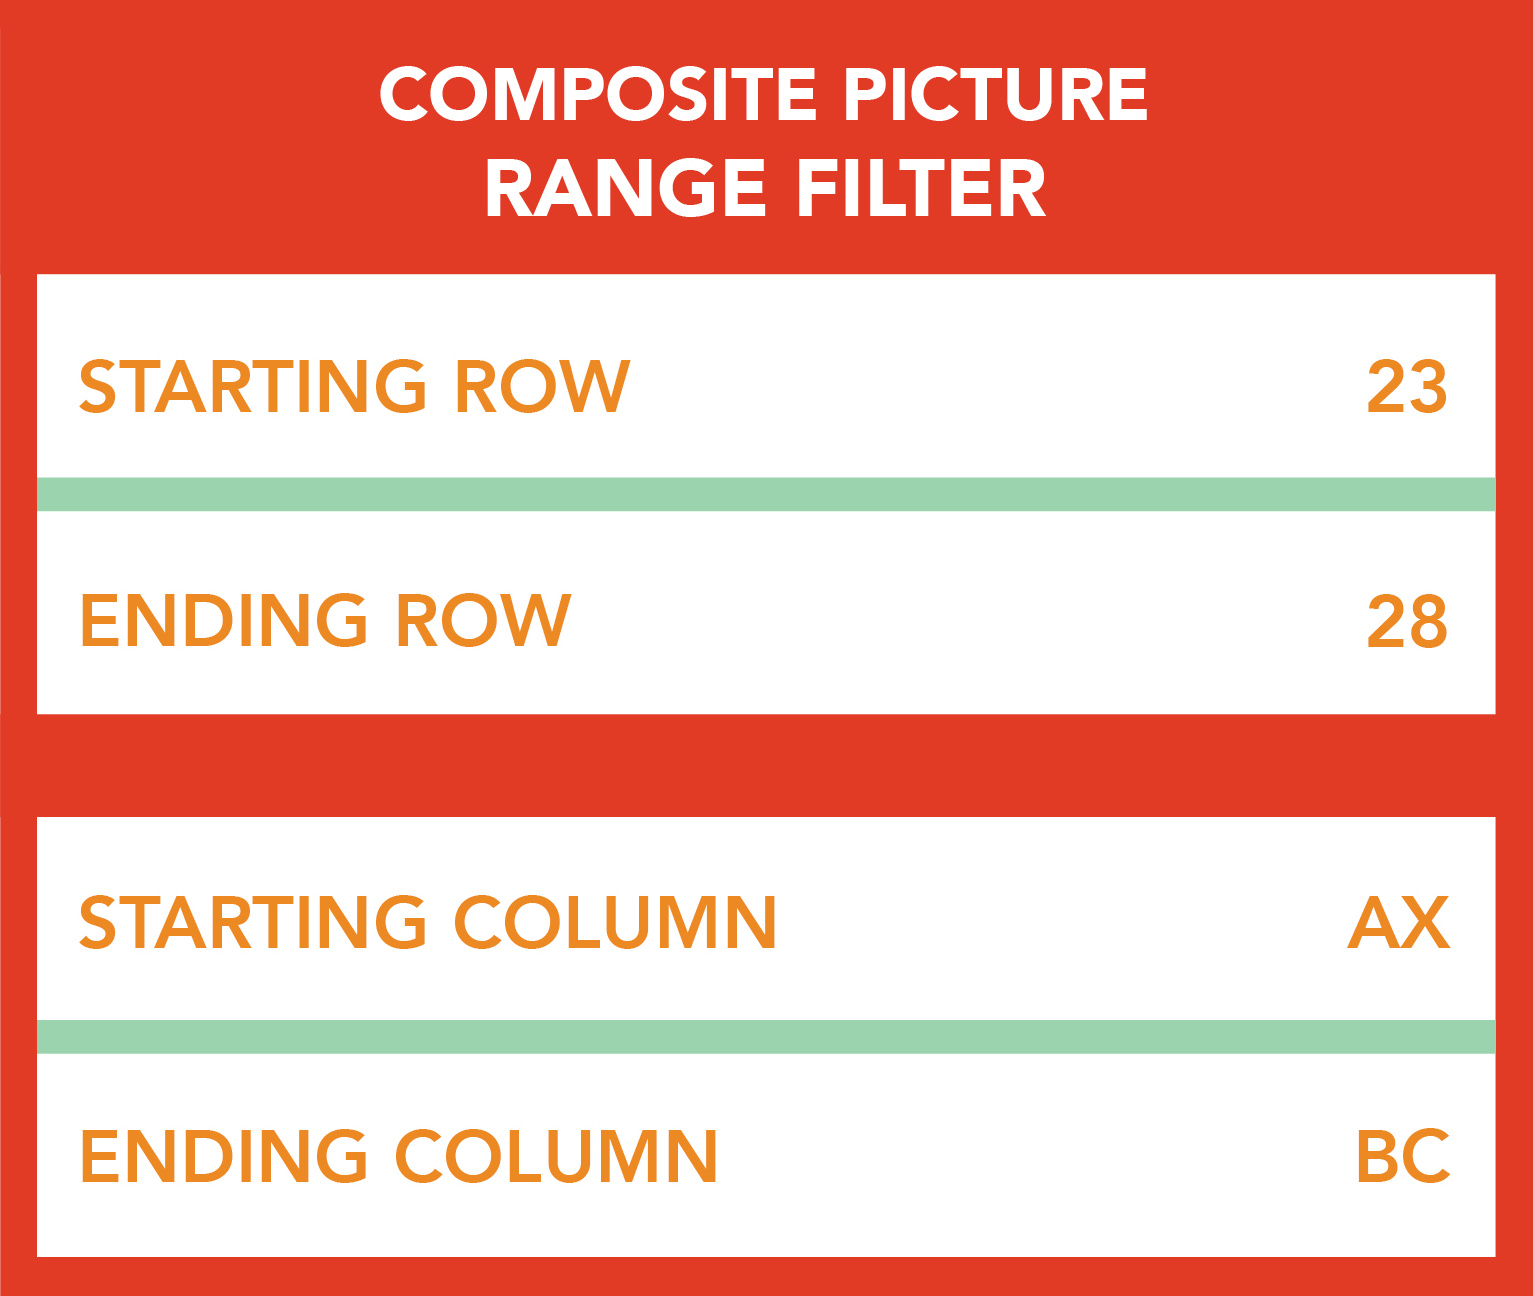
Filter tools allow user to select portion of floor for composite picture to reduce file size and processing time.
Next, we constructed a grid matching the floor tile layout in Microsoft Excel, using cell borders to outline the room. A VBA macro written by our design team scans through a folder of pictures, reading their addresses from their file names and inserting them in the proper location in the grid. The result is a single file composed of over 2,500 individual pictures.
As can be expected, the file is quite large. To allow for higher-resolution photographs of smaller regions of the floor, the macro was enhanced to allow the user to filter for a specific location in the room, instead of generating a picture of the entire room (see Figure 4), which helps us generate composite pictures of small areas of the floor quickly.
The individual grids were assembled digitally in an Excel filter.
Because of the size of the picture, the client wanted us to develop a method of identifying each floor tile on the composite photo, so we added a user-selected label-view function to the macro. These labels greatly ease the referencing specific floor tiles in reports, meetings or telephone conversations (see Figure 5).
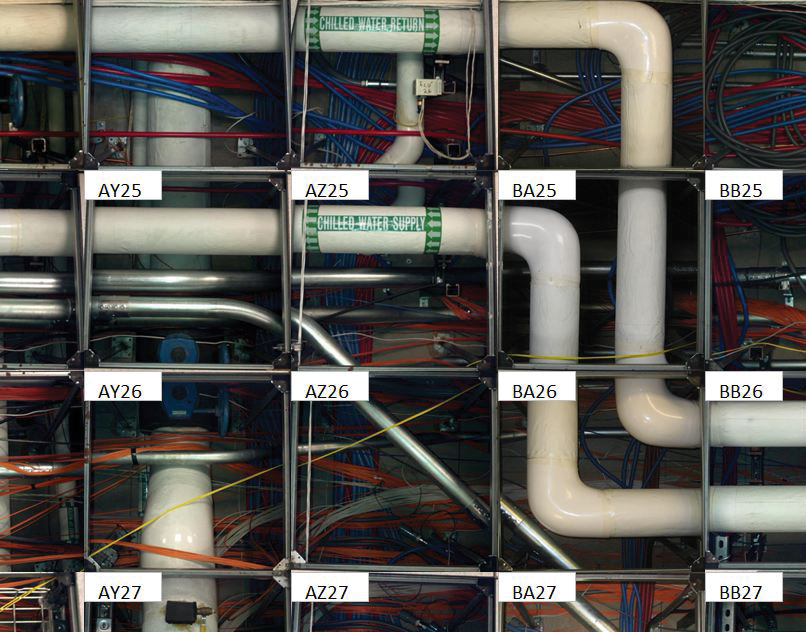
The final version included labels that described the grid locations.
Having an accurate record of underfloor conditions has been helpful to the engineers as they plan minor moves, adds and changes in the computer room; as well as for developing master planning strategies for system replacement and upgrade. Concepts that seem practical on the surface (looking above the floor only) can be reviewed after looking deeper (under the floor).
The facilities staff has also found the composite photo useful for conveying the need for underfloor cleanup of abandoned cabling.
In one case, the photo was used to overcome a manager’s reluctance to approve a project for removal of underfloor cabling.
While photographs do not appear poised to take the place of traditional engineering drawings in the near future, this project is an example of how an innovative use of technology can provide great benefit to the designer, facility owner and installing contractor.
 Chad Beery, PE, ATD, LEED AP, is one of the three ATDs at Peters, Tschantz & Associates, Inc. in Akron, OH. The firm’s 30+ employees provide MEP engineering services to a variety of industries, with a focus on the mission-critical and health-care sectors. Since joining the firm in 2007, Mr. Beery has been involved in many different project types. His mission-critical work has involved data center design, equipment replacements, CFD modeling and redundancy and capacity consulting. Another important part of his work has been numerous control system design projects, both new and retrofit. Enjoying hands-on work and seeing systems in action, Mr. Beery has also developed system commissioning skills on a number of projects ranging from data centers to schools to research facilities.

 2020
2020


