
Global PUEs — are they going anywhere?
Regular readers of Uptime Institute’s annual data center survey, the longest running of its kind, already know that the industry average power usage effectiveness (PUE, a ratio of total site power and IT power) has trended sideways in recent years. Since 2020, it has been stuck in the 1.55 to 1.59 band.
Even going back further, we would see only a trivial improvement in the headline number. For many data center industry watchers, including regulators, this flatlining has become a cause for concern — an apparent lack of advancement raises questions about operators’ commitment to energy performance and environmental sustainability.
Why is global PUE lingering in near stasis? Has the industry come up against long-term practical limits? The leaps in efficiency that marked the early years of PUE were largely due to the adoption of best practices around air-flow management (e.g., blanking panels and containment systems) and the fine-tuning of controls.
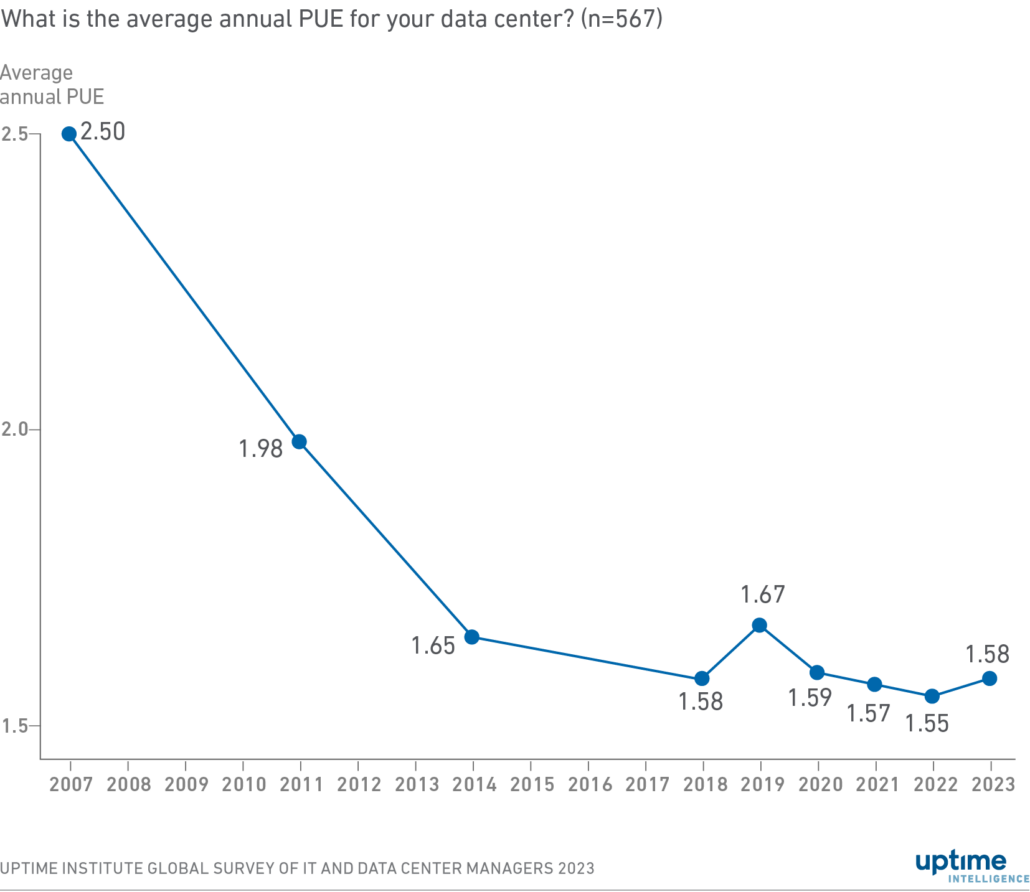
In addition, new builds benefited from the use of better-performing cooling designs (especially optimized compressors and new types of heat rejection) and more efficient power distribution equipment. The combined results of these measures were dramatic: the industry average PUE dropped from 2.5 in 2007 to 1.98 in 2011, reaching 1.65 by 2014 (see Figure 1).
Figure 1. Industry-wide PUE improvement slows, then stops
The business reality of return on investment shapes the long-term trajectory of PUE. Gains from operational improvement and technical innovation naturally taper off due to diminishing returns because the most cost-effective upgrades are performed first. The expense of a major refurbishment in an existing facility is often difficult to justify for the energy savings alone — if the project is feasible at all without risking service disruption. Although PUE gains would naturally have slowed as a result, they should not have come to a full stop.
A closer look at the data indicates they likely have not; underlying improvements have masked shifts in other factors. Uptime’s 2023 survey questionnaire included new and refined questions to understand the industry PUE dynamics better. In the interest of accuracy, the survey primarily asked respondents for the PUE at the specific data center they are most familiar with rather than the largest facility of the operator’s organization. When the two differed, we also asked for the annualized PUE of the latter facility; this methodological change has not meaningfully affected the resulting average PUEs.
The biggest component in the flatlining of the headline PUE number is a richer geographical mix of surveyed data centers. North American and European participants used to dominate Uptime’s annual survey. In 2018, for example, nearly two-thirds of the responses came from these regions. By 2023, this proportion has fallen to less than half, as the survey’s panel has been gradually expanded into other territories to take a more global view.
This matters due to differences in climates: ambient conditions across Asia, the Middle East, Africa and Latin America tend to be more taxing on cooling systems, which use more energy to cool the same IT load.
Another factor is that in some regions, particularly in Africa and Latin America, facilities in our sample tend to be smaller in capacity, with many being around 1 megawatt (MW) or less in commissioned UPS system capacity. And smaller sites lend themselves to the use of air-cooled direct expansion air conditioning units, which typically use more energy.
Prevailingly hot and / or humid climates and less efficient cooling systems mean that in the Middle East, Africa and Latin American regions, the average PUE readings are above 1.7 — in contrast, North America and Europe are hovering around 1.5.
Directionally, industry PUEs should see gradual improvement in the coming years. Newer data centers tend to use more efficient cooling designs, leveraging not only leading-edge equipment and optimized controls but also relaxed temperature set points, following ASHRAE’s thermal guidelines. Newer data centers also tend toward larger capacity, which means an even stronger focus on infrastructure energy performance.
Figure 2. Average PUE by age of facility (1 MW and above)
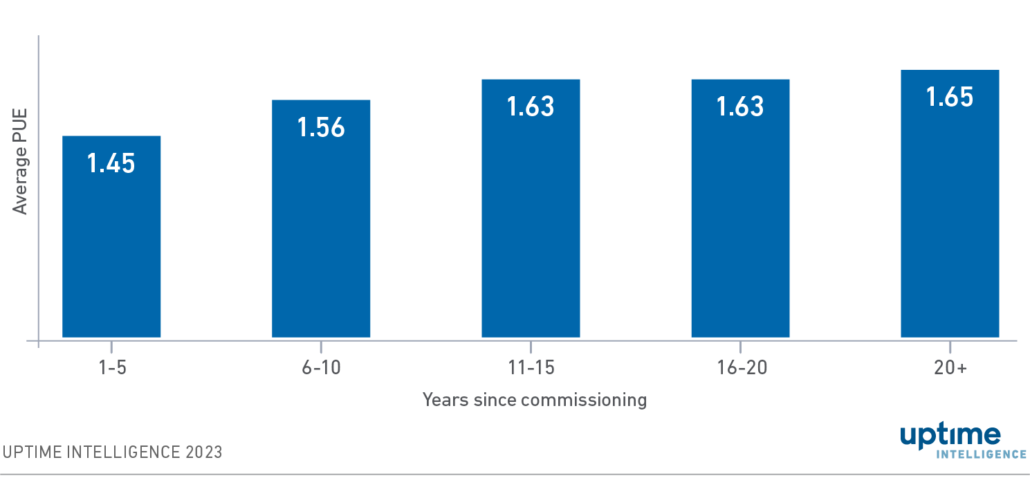
Uptime’s data lends support to this theory. Facilities that are larger than 1 MW and less than 15 years old average around 1.48 PUE globally (see Figure 2). Those data centers built in the past five years are even more promising for energy efficiency and sustainability, with an average global PUE of around 1.45. North America and Europe lead these, as most of the new sites from these regions in the survey achieve annualized PUEs that are better than 1.4. Directionally, this is the level where global average PUEs are headed, but a large number of smaller facilities, arguably less optimized for energy, weigh on averages.
The Uptime Intelligence View
Uptime Institute’s headline PUE figure will move together with IT workloads migrating out of legacy (statistically older than 20 years) facilities into new and preferably larger data centers — a process that will take years to deliver incremental improvements to global PUEs. But this is putting too fine a point on PUE itself: the energy performance of digital infrastructure hinges primarily on the efficiency of IT, not facilities. The most effective energy performance and sustainability efforts need to examine the opportunities for savings on both sides of the decimal point.

 2019, Getty


