Looking for the x-factor in data center efficiency
The suitability of a data center environment is primarily judged by its effect on the long-term health of IT hardware. Facility operators define their temperature and humidity set points with a view to balancing hardware failure rates against the associated capital and operational expenditures, with the former historically prioritized.
Over the past decade, this balance has shifted in favor of facility efficiencies as data center operators have gradually lifted their temperature (and humidity) limits from a typical 65°F to 68°F (18°C to 20°C) to somewhere between 72°F and 77°F (22°C and 25°C). However, many operators remain reluctant to further relax their temperature settings even for new data center designs, let alone their existing footprint.
This conservative stance goes against the empirical evidence. Industry body ASHRAE issued its failure rate guidance, called x-factor, almost a decade ago, yet it remains underused in key data center planning and design decisions. As a result, data centers have larger, and thus more expensive, cooling systems that use more energy than the data justifies.
Operators (and their tenants) that do follow x-factor in their cooling design and control strategy may reap the benefits not only in lower construction costs and energy savings but also in the possibility of fewer IT hardware failures. This Uptime Intelligence Update offers an overview of what x-factor is, what it indicates and what cooling optimization opportunities it presents.
Navigating x-factor data
ASHRAE and IT vendors tend to agree that it is best to operate hardware well below the specified temperature limits as standard. This is both to extract the maximum performance and to minimize the thermal stress on components — heat accelerates wear, which ultimately increases the likelihood of failures. Hard disk drives, with their moving parts, are the most prone to failure under heat stress.
X-factor is a dimensionless quantity that estimates how the annualized likelihood of IT hardware component failures change with inlet temperature. The proportional change to failure rates assumes continuous operation at a given temperature when compared with the baseline of 68°F (20°C) — a temperature set point historically preferred by many operators. Based on empirical data from IT vendors and published in 2014, x-factor comprises three data series:
- X-factor numbers, which indicate the average (typical) hardware configuration of a server.
- Upper-bound numbers, which reflect the server hardware configurations that are more prone to temperature-related failures. For example, less heat-resistant system designs or those with a lot of hard disk drives.
- Lower-bound numbers, which reflect the server hardware configurations that are less likely than the average to develop failures. For example, those designs that are optimized for airflow and heat distribution or are diskless.
Figure 1 depicts the correlation between the likelihood of failure rate and the temperature up to 90.5°F (32.5°C), which is just above the upper limit of ASHRAE’s allowable envelope for Class A1 data center environments. These x-factor numbers represent changes in the likelihood of annualized IT component failures when operated at the chosen temperature continuously.
Figure 1. X-factor data visualized up to 90.5°F (32.5°C)
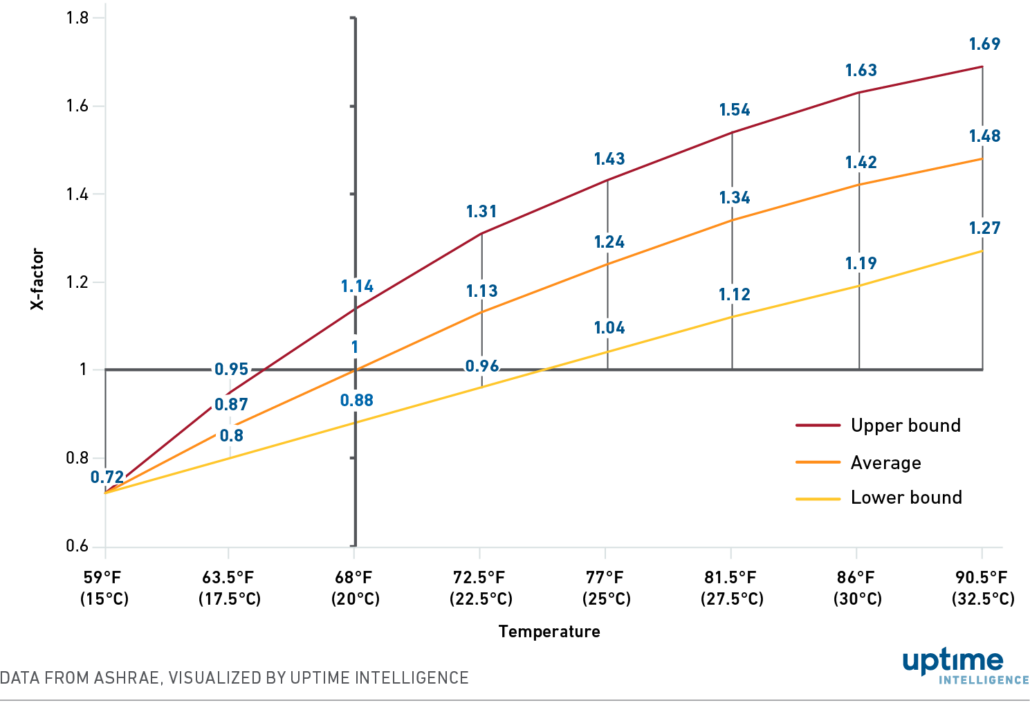
For example, x-factor data indicates that when IT hardware operates at a constant 77°F (25°C) to reduce cooling energy needs, the annualized component failure rates will likely increase anywhere between 4% and 43% (midpoint 24%) when compared with the baseline at 68°F (20°C). This elevated x-factor quantifies the outcome of the accelerated wear on the hardware.
These failures do not necessarily represent a complete failure of an IT system, but cover any type of hardware failure, including redundant components. Some failures will manifest themselves in system instability and restarts. It is worth noting that modern IT systems are typically designed and warranted to operate in temperatures up to 95°F (32°C) as standard, although this may be dependent on the configuration.
Giving x-factor dimension: failure rate scenarios
Unfortunately, a key piece of information is missing that affects the trade-off calculations: the actual baseline failure rate before x-factor is applied. For business confidentiality reasons, IT vendors do not publish their respective field data, not even their calculated figures based on accelerated aging tests, such as the mean time between failures or failures in time. Based on what Uptime Intelligence was able to gather from the limited disclosures and academic publications, the following information can be surmised:
- The best, most durable IT system designs may have an annualized baseline failure rate of around 2% or less. This is due to good thermal management, robust build quality and the selection of components based on their durability.
- The difference in annualized failure rates between the most and least durable hardware is probably a factor of three or four (i.e., 6% to 8% of IT systems that develop a component failure in a year).
- Unsurprisingly, hard disk drives are the most common source of failure. In most cases, these do not result in a system outage or data loss due to the ubiquitous use of data redundancy techniques.
As an example, if there is an assumed 4% baseline failure rate, operating constantly at 77°F (25°C) will mean an increase in typical IT system component failures by approximately 1 percentage point. X-factor’s average, upper bound and lower bound series also indicate that not all IT hardware reacts to the higher temperature in the same way. At 77°F (25°C), the respective increases are 1.16 percentage points for the upper bound of x-factor and 0.64 percentage point for the lower bound likelihoods of failure.
If a facility were to operate constantly at 81.5°F (27.5°C), which is just above the upper limit of ASHRAE’s recommended envelope, the typical annualized likelihood of failure increases by 1.36 percentage points, with the upper bound adding 1.6 percentage points and the lower bound adding just under 1 percentage point. Figure 2 shows these x-factor correlations for a 4% annualized failure rate baseline scenario.
Figure 2. Upper, average and lower bound annualized failure rates at a 4% baseline
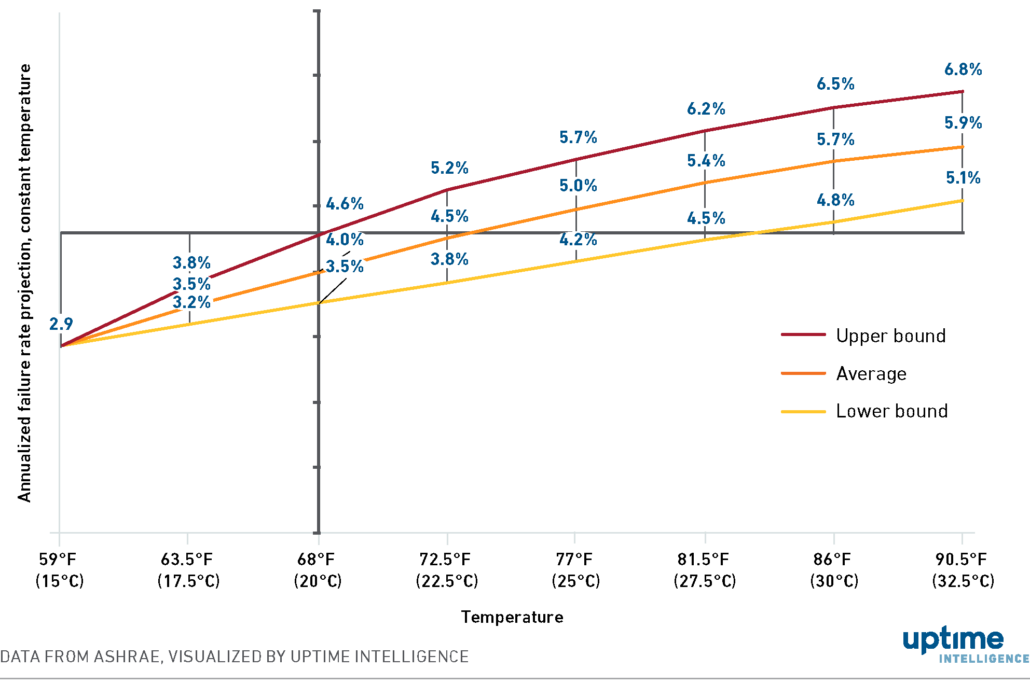
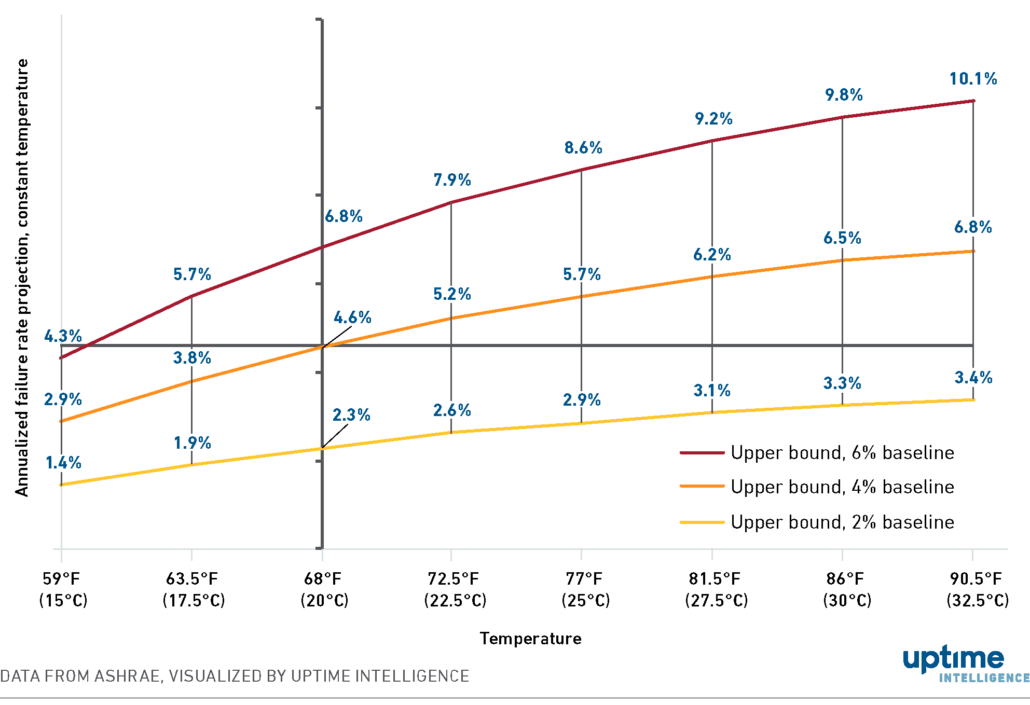
Figure 3 applies the upper bound x-factor to three example baseline rates (2%, 4% and 6%) to show the likelihood of annualized IT component failures at a given constant operating temperature.
Figure 3. Upper bound failure rate scenarios at 2%, 4% and 6% baselines
Arguably, these are marginal increases. Yet, it is not a complete picture. As servers age, failure rates escalate — anecdotally, by the fourth year of a server’s life span there is often a noticeable increase. This is largely accounted for by the mechanical components (i.e., motors and actuators) in hard disk drives wearing out in greater numbers and, to a lesser extent, instability due to voltage sags and other issues with embedded power components. Uptime Intelligence’s data shows that IT operators are retaining servers for longer than before, with a five-year average refresh cycle — a substantial number of servers are now older than seven years.
When running many aging servers, particularly the older legacy systems found in some larger enterprise IT environments, the chances of a marked increase in failures will likely deter operators from pursuing aggressive operating temperature targets, regardless of the energy efficiency benefits.
For new builds (or full refurbishments) with largely or fully new IT systems, the scale tilts toward designing for an elevated upper temperature set point to optimize energy and water consumption, while reducing mechanical equipment sizes and the associated power infrastructure to save on capital costs.
Temperature excursions: leaner cooling, not more failures
The true potential of using x-factor data in design decisions, however, lies not with constant warmer operation, but to allow the data hall’s temperature to change across a wider range in the allowable operating envelope. The business case for this is not built on further savings on cooling energy — those have largely been captured already by operating closer to the upper limits of the recommended envelope. In temperate climates, numerous data center facilities have already achieved annualized PUEs of around 1.2 or better by taking advantage of the recommended envelope and economization.
Adopting the use of ASHRAE’s allowable envelope (A1, up to 90.6°F / 32.6°C) for excursions into higher temperatures allows for a much leaner cooling and power infrastructure, including the downsizing, or elimination even, of mechanical refrigeration capacity. This is not only less expensive for the same IT capacity but may also reduce both maintenance tasks and the risk of cooling component failures.
A further boon, which is important for sites that are limited by their substation power envelope, is that more electrical capacity can be allocated to the IT load instead of reserving it for peak cooling energy needs (when the data center is fully utilized during the worst-case climatic conditions assumed for the facility design).
What x-factor data reveals is that controlled, short-duration temperature increases may have an effect on IT failure rates, but that impact is immaterial from a financial / operational perspective even if it is statistically significant (not easily explained by random chance). This is because the limited number of hours spent in those further elevated temperatures will only marginally accelerate component wear.
Take a facility located in Washington DC as an example, assuming the primary use of evaporative or adiabatic economization for cooling. Tracking wet-bulb conditions (the temperature to which the air can be cooled down by absorbing moisture) closely at a delta of 7.2°F (4°C) or less would have an imperceptible effect on the likelihood of IT failures when compared with operating at a constant 77°F (25°C). This is because the data hall would only spend an average of 320 hours a year above 77°F (25°C); the influence of the x-factor is mitigated when IT operates at excursion temperatures for less than 3.7% of the hours in a year.
Since the climate of Washington DC is not exceptional, this approach should be broadly applicable. The likelihood of component failures would increase only marginally in most of the popular data center locations across the world if operators let temperatures rise to the allowable limit of Class A1.
But letting temperatures rise for a leaner cooling and power infrastructure is only half the x-factor story. Opening up the lower set point can effectively bring x-factor down. Allowing the temperature to fall to track ambient conditions would help reduce failure rates, often below the baseline rate. This is because the facility could spend a great number of hours, sometimes the majority of the year, in temperatures around or below the baseline temperature of 68°F (20°C).
First published in the 2015 revision of its thermal guidelines and updated in 2021, ASHRAE estimated the annualized x-factors for several US and global locations, calculating multiple scenarios for several types of cooling systems. What these scenarios have in common is that they all assume the use of economizers that track ambient dry- or wet-bulb conditions within the allowable ranges.
The results strongly indicated that adopting wider temperature ranges to take advantage of ambient conditions would, in many climates, deliver substantial benefits in IT failure rates when compared with a constant operating temperature, such as 77°F (25°C). These gains from deceleration of wear are often more than offset by the acceleration effect from excursions into the upper bound of the allowable range. This means IT component failures will likely come down in most cases.
Yet despite these benefits, the adoption of wide temperature bands (as opposed to tightly controlling for a targeted set point) remains sporadic, even for new data center builds. The practice is only relatively common in some large technical computing applications and cloud facilities that opt for direct outside air systems.
In upcoming reports, Uptime Intelligence will dive deeper into how x-factor calculations and IT hardware thermal trends inform facility cooling strategies for future builds and refurbishments.
The Uptime Intelligence View
ASHRAE’s x-factor data indicates that the data center industry by and large is still overprotective of IT hardware, and it does so at great expense in capital expenditures and energy costs — and against growing pressure on sustainability credentials. Taking full advantage of advanced cooling systems and control strategies promises to bring not only energy efficiency but a leaner cooling infrastructure, possibly lowered IT failure rates and improved sustainability credentials for the business. Despite the complexities involved in engineering (and in departing from past practices), this optimization opportunity is too big to ignore.
 2020
2020


 2020
2020


