Industry Perspective: Three Accredited Tier Designers (ATDs) discuss 25 years of data center evolution
The experiences of Christopher Johnston, Elie Siam, and Dennis Julian are very different. Yet, their experiences as Accredited Tier Designers (ATDs) all highlight the pace of change in the industry. Somehow, though, despite significant changes in how IT services are delivered and business practices affect design, the challenge of meeting reliability goals remains very much the same, complicated only by greater energy concerns and increased density. All three men agree that Uptime Institute’s Tiers and ATD programs have helped raise the level of practice worldwide and the quality of facilities. In this installment, Elie Siam of Pierre Dammous & Partners examines worldwide trends with a perspective honed in the Uptime Institute’s EMEA region. This is the second of three ATD interviews from the May 2014 Issue of the Uptime Institute Journal.
Mathworks data hall, a Pierre Dammous & Partners project.
Elie Siam graduated in 1993 from the American University of Beirut and joined Pierre Dammous & Partners (PDP) in 1994 as a design engineer. PDP is an engineering consulting firm with offices in Beirut, Riyadh, and Abu Dhabi. The firm is dedicated to the supply of quality services in mechanical, electrical, plumbing, fire, and telecommunications systems. After multiple successes, Mr. Siam became the lead of the team for resolving mission-critical facilities problems and eventually proved to be a local authority in the Electrical Engineering field. He is an active contributor to Lebanese Standards and a Building Services Instructor at Lebanon’s Notre Dame University. He has special qualifications in telecommunications and data networks and established highly performing systems for large banks (Credit Libanais, SGBL, SGBJ, Fransabank, CSC, BBAC, LCB, BLOM), telecom companies (IDM, STC), universities (LAU, Balamand), and leading media companies (Annahar, VTR, Bloomberg).
Elie, please tell me about yourself.
I have been headquartered in Beirut and worked here since 1993, when I graduated from the American University of Beirut as an electrical engineer and started work at Pierre Dammous & Partners (PDP) in 1994, so just over 20 years now.
A substantial part of our work at PDP is related to telecom and power infrastructure.
When PDP started with server rooms and then data centers, I decided to get an ATD accreditation, due to my exposure to networks.
We have done a lot of data center projects, not all of them Tier Certified. The issue is that the data center market in Lebanon is small, but clients are becoming more aware. Consequently, we are doing more Tier designs. Tier III is the most commonly requested, mostly from banking institutions.
The central bank of Lebanon has asked for qualifying banks to go to Tier III and now the market is picking up.
We are also starting to do design and construction management for data centers outside Lebanon as in Dubai (Bloomberg Currency House), Amman (Societé Générale de Banque – Jordanie), or Larnaca (CSC bank). We also did large colocation data centers for a major telecom company in Riyadh and Dammam.
Which project are you most proud of?
Well, I’ve worked on many kinds of projects, including hospitality, health care, and data centers. My last data center project was for a Saudi Arabian telecom company, and that was a 25-MW facility to house 1,200 server racks. It was awarded Tier III Certification of Design Documents.
Our responsibility was to do the design up to construction drawings, but we were not involved in the construction phase. The client was going to go for a Tier Certification of Constructed Facility, but, again, we are not involved in this process. It is a very nice, large-scale project.
The project is composed of two parts. The first part is a power plant building that can generate 25 MW of redundant continuous power, and the second part is the data center building.
Is the bulk of your work in Beirut?
By number of projects, yes. By the number of racks, no. One project in Saudi Arabia or the Gulf countries could be like 50 projects in Beirut. When you design a project in the Gulf Countries, it’s for 1,200 racks, and when you design one in Beirut, it’s for about 25 racks.
What drives the larger projects to Saudi Arabia?
Money, and the population. The population of Lebanon is about 4 million. Saudi Arabia has about 25-30 million people. It is also fiscally larger. I’m not sure of the numbers, but Saudi Arabia has something like US$60 billion in terms of annual budget surplus. Lebanon has an annual budget deficit of US$4.5 billion.
Tourism in Lebanon, one of the main pillars of the economy, is tending to zero, due to political issues in Syria. Consequently, we have economic issues affecting growth.
Is it difficult for a Lebanese company to get projects in Saudi Arabia?
Yes, it can be difficult. You have to know people there. You have to be qualified. You have to be known to be qualified. You can be qualified, but if you can’t prove it you won’t get work, so you have to be known to be qualified so you can grasp jobs.
We have a branch office in Dubai for Dubai and UAE projects and also for some projects in Saudi Arabia as well. We‘ve done many projects in Jeddah and Riyadh, so people know us there.
Also, we are partly owned by an American company called Ted Jacob Engineering Group, which owns 25% of PDP. This ownership facilitates the way we can get introduced to projects in the Gulf because our partner is well known in the region.
Tell me about some of your current projects.
We are working on three new data centers, each above 200 kW. Two of them belong to Fransabank (main site and business continuity site) while the third belongs to CSC bank. All of them will be going for Tier III Certification. We’re also working on several other smaller scale data center projects.
One of the major data centers currently in construction in Lebanon is for Audi Bank, which is designed and executed by Schneider Electric. The second project is for another banking institution called Credit Libanais. It is 95% complete, as of April 2014. We are the designers. We also worked as integrators and BIM (building information modeling) engineers and did the testing and commissioning. This is a 120-kW data center.
The Credit Libanais facility has the following features:
Chilled water-cooled white space. The chilled water system provides higher efficiencies than DX (direct expansion) systems and avoids heavy use of CFC (chlorofluorocarbons) derivatives.
The chilled water system uses high water supply temperature (10°C versus 6°C for standard systems), which significantly increases efficiency and running costs.
Operation at higher water temperature reduces the need to provide humidification in the computing space. That saves energy.
The chiller compressors and pumps are provided with electronically commutated (EC) technology, allowing the direct current motors to modulate from 0-100% to optimize energy consumption based on actual demand.
A special variable primary chilled water system does not require secondary chilled water pumps, which further reduces energy expenditures.
Computer room air conditioning units are provided with variable speed EC fans modulating from 0-100% to reduce energy consumption.
Cold air containment prevents mixing of cold and return hot air, which further enhances the overall system efficiency.
The fresh air for the data center is centrally pre-treated with an energy recovery unit through thermal exchange with office space exhaust.
Associated office space is air conditioned by a VRV (variable refrigerant flow) system for the high efficiency and lower energy expenditures. The system interfaces with the BMS (building management system) for scheduling and centralized parameterization to avoid operation during unoccupied periods
The latest VRV system technology provides cooling to the office space with Unit COP (coefficient of performance) greater than 4 using R-410 refrigerant.
Recirculated air from offices ventilates the UPS/battery room through transfer fans, which reduces the amount of treated fresh air.
Modular UPS systems adjust capacity to actual IT loads. The efficiency of the UPS system is 95.5% at 25% load and 96% at 100% load.
T5 fluorescent lamps with low-loss optics also save energy. The lighting is switched by a KNX lighting control system that includes automatic motion sensors and centralized parameterization and scheduling to avoid operation during unoccupied periods.
The BMS integrates all subsystems, either directly or via SNMP (Simple Network Management Protocol), KNX, and data center infrastructure (DCIM) controls. The system allows an overall insight on the operations of the data center, monitoring all energy expenditures, faults, and alerts.
DCIM optimizes operations and increases overall efficiency by operating at lower PUE.
What does Credit Libanais plan to do with the facility?
Credit Libanais is one of the top banks in Beirut. They have about 70 branches. They are constructing a new 32-story headquarters building. This will be the main data center of the bank. The data center is in a basement floor. It is about 450 m2 with 120 kW of net IT load. The data center will handle all the functions of the bank. An additional 350-m2 space hosts a company called Credit Card Management (CCM). CCM has also a dedicated server room within the Credit Libanais data center.
At first Credit Libanais did not want to engage in Tier Certification because they do not provide colocation services, but they changed their minds. In March, I queried the Uptime Institute for a proposal, which I brought back to the bank. The proposal includes full support including Tier III Certification of the Design, Constructed Facility, and Operations.
Can you describe the cooling system of the Credit Libanais data center in more detail?
The critical environment is water cooled. Not only is it water cooled, but it is water cooled at relatively high temperatures. Normally water-cooled systems for building’s supply water at around 6°C; this data center uses a 10°C chilled water temperature, which greatly increases the efficiency and reduces cost.
Since the cold water temperature is not too low, there is no need to provide large-scale humidification because water will not condense as much as when the chilled water temperature is lower, which substantially saves on energy.
The chillers also have variable speed compressors and variable chilled water pumps, and the fans of the chillers and the fans of the CRACs all have EC variable speed fans so that you can permanently adjust the speed to exactly the amount of capacity you would like to have and are not working at either 100 or 0%.
What’s the value of being an ATD?
I believe that you would need to have substantial experience before you go for the accreditation because if you do not have experience you would not benefit. But, it is very useful for people who have experience in mechanical and electrical engineering and even more useful for those who have more experience in data centers.
You could get experience from working on clients’ projects, but you would need the accreditation to know how things should be done in a data center and what things that should not be overlooked. To do that you need a methodology and the ATD gives you that.
ATD gives you a methodology that eliminates forgetting things or overlooking things that could lead to failure.
When you go through the training they teach you the methodology to check each and every system so that they are Concurrently Maintainable or Fault Tolerant, as required by the client.
This article was written by Kevin Heslin, senior editor at the Uptime Institute. He served as an editor at New York Construction News, Sutton Publishing, the IESNA, and BNP Media, where he founded Mission Critical, the leading publication dedicated to data center and backup power professionals. In addition, Heslin served as communications manager at the Lighting Research Center of Rensselaer Polytechnic Institute. He earned the B.A. in Journalism from Fordham University in 1981 and a B.S. in Technical Communications from Rensselaer Polytechnic Institute in 2000.
An Uptime Institute survey reveals that best practices and preparation pay dividends
In late October 2012, Superstorm Sandy tore through the Caribbean and up the east coast of the U.S., killing over a hundred, leaving millions without power and causing billions of dollars in damage. In the aftermath of the storm, Uptime Institute surveyed data center operators to gather information on how Sandy affected data center and IT operations.
The acute damage caused by Superstorm Sandy in the Northeast was thoroughly documented. But it is important to note that regional events have larger implications. The survey found that Superstorm Sandy caused damage and problems far from its path. For example, one site in the Midwest experienced construction delays as equipment and material deliveries were diverted to sites affected by the hurricane. Another business incurred similar delays at a leased facility that was being remodeled for its use. The timelines for both of these projects had to be adjusted.
The survey focuses primarily on the northeast corridor of the U.S. as the Greater New York City area took the brunt of the storm and suffered the most devastating losses. This area has a longstanding and rigorous data center operations culture. A total of 131 end users completed at least part of the survey, with 115 responding to all questions that applied. Many of the survey respondents were also Uptime Institute Network members, who could be expected to be highly familiar with industry best practices. These factors may have led survey respondents to be better prepared than a more general survey population.
The survey examined preparations, how facilities fared during the storm and after actions taken by the data center owners and operators to ensure availability and safeguard of critical equipment. Of all respondents spread through North America, approximately one-third said they were affected by the storm in some way. The survey results show that natural disasters can bring unexpected risks, but also reveal planning and preemptive measures that can be applied in anticipation of a catastrophic event. The path traveled by Superstorm Sandy can be considered susceptible to hurricanes, yet any data center is vulnerable to man-made or natural disasters, no matter its location. And natural disasters are trending upward in frequency and magnitude.
In the aftermath of Sandy, the Office of the President of the United States and Department of Energy jointly asserted, “In 2012, the United States suffered eleven billion-dollar weather disasters–the second-most for any year on record, behind only 2011,” according to Economic Benefits Of Increasing Electric Grid Resilience to Weather Outages, a report prepared by the President’s Council of Economic Advisers and the U.S. Department of Energy’s Office of Electricity Delivery and Energy Reliability with assistance from the White House Office of Science and Technology.
In this context, the role of the data center owner, operator and designer is even more important: to identify the risks and mitigate them. Mitigation can often be achieved in many ways.
Questions
The survey focused on four main topics:
The impact of loss of a data center
Steps taken to prepare for the storm
The organization’s disaster recovery plan
Lessons learned
Select questions asked for a yes or no answer; many required respondents to answer in their own words. These narrative responses make up the bulk of the survey and provided key insight into the study results.
Impact on Organizational Computing
The majority of responses to the first question, “Describe the nature of how your organization’s computing needs were impacted,” centered on loss of utility power or limited engine generator runtime, usually because of lack of fuel or fuel supply problems.
Almost all the respondents in the path of the storm went on engine generators during the course of the storm, with a couple following industry best practice by going on engine generators before losing utility power. About three-quarters of the respondents who turned to engine generators successfully rode out the storm and the days after. The remainder turned to disaster recovery sites or underwent an orderly shutdown. For all who turned to engine-generator power, maintaining sufficient on-site fuel storage was a key to remaining operational.
Utility power outages were widespread due to high winds and flooding. Notably, two sites that had two separate commercial power feeds were not immune. One site lost one utility feed completely, and large voltage swings rendered the other unstable. Thus, the additional infrastructure investment was unusable in these circumstances.
The Tier Standard: Topology does not specify a number of utility feeds or their configuration. In fact, there is intentionally no utility feed requirement at all. The Uptime Institute recommends, instead, that data center owners invest in a robust on-site power generation system (typically engine generators), as this is the only source of reliable power for the data center.
Survey respondents reported engine-generator runtimes ranging from one hour to eight days, with flooding affecting fuel storage, fuel pumps or fuel piping distribution, limiting the runtime of about a quarter of the engine generator systems. In one case, building management warned a data center tenant that it would need to shut down the building’s engine generators if flooding worsened. As a result, the tenant proactively shut down operations. Several operators remained on engine-generator power after utility power was restored due to the “unreliable grid.” Additionally, for some respondents, timely delivery of fuel to fill tanks was not available as fuel shortages caused fuel vendors to prioritize hospitals and other life-safety facilities. In short, fuel delivery SLAs were unenforceable.
Uptime Institute Tier Certified data centers have a minimum requirement of 12 of on-site fuel storage to support N engine generators. However, this storm showed that even a backup plan for fuel delivery is no guarantee that fuel will be available to replenish this stock. In some cases fuel supplier power outages, fuel shortages or closed roadways prevented deliveries. In other cases, however, companies that thought they were on a priority list learned hospitals, fire stations and police had even higher priority.
Other affects could be traced to design issues, rather than operations. One site experienced an unanticipated outage when the engine generator overheated. Wind pressure and direction prevented hot exhaust air from exhausting properly.
Facilities with engine generators, fuel storage or fuel pumps in underground basements experienced problems. One respondent reported that a facility had a sufficient volume of fuel; however, the fuel was underwater. The respondent remarked, “Couldn’t get those [engine generators] to run very well on sea water.” Although building owners may not have expected Sandy to cause flooding, localized flooding from broken mains or other sources often accompanies major events and should be mitigated accordingly.
One respondent noted that site communications were interrupted, thereby rendering the facility’s engine generators unusable. And several buildings were declared uninhabitable because the lobby and elevators were underwater.
Figure 2. Flooding in the Hoboken PATH station. Photos in this article depict the widespread flooding resulting from Hurricane Sandy and were contributed by Sabey and other respondents to the survey.
A respondent also noted that water also infiltrated spaces that would normally be watertight in a typical rainstorm because the severe winds (100+ MPH) pushed water uphill and along unusual paths. One response stated that high winds pushed water past roof flashing and vents: “Our roofing system is only waterproof when water follows gravity.” Although traditionally outside of design parameters and worse-case considerations, Superstorm Sandy provides a potent justification for appropriate amendments to building characteristics. For a greenfield site or potential upgrades at an existing site, business decisions should be made considering the design loads and wind speed potential to be designed for versus the use of the building. This may also impact decisions about where to locate a data center.
Storm Preparation
The second question, “Describe any preparations you made prior to the storm,” brought a variety of responses. Almost all the respondents reported that they topped off fuel or arranged additional fuel, and one-third made sleeping and food provisions for operators or vendors expected to be on extended shift. About one-quarter of respondents reported checking that business continuity and maintenance actions were up-to-date. Others ensured that roof and other drainage structures were clear and working. And, a handful obtained sandbags.
All respondents to the question stated they had reviewed operational procedures with their teams to ensure a thorough understanding of standard and emergency procedures. Several reported that they brought in key vendors to work with their crews on site during the event, which they said proved helpful.
Downtown New York City immediately after the storm.
Some firms also had remote Operations Emergency Response Teams to relieve the local staff, with one reporting that blocked roadways and flight cancellations prevented arrival for lengthy periods of time.
A few respondents said that personnel and vendors were asked to vacate sites for their own safety. Three respondents stated that they tested their Business Continuity Plans and provided emergency bridge lines so that key stakeholders could call in and get updates.
Active construction sites provided a difficult challenge as construction materials needed to be secured so they would not become airborne and cause damage or loss.
Effectiveness of Preparations
Multiple respondents said that conducting an in-depth review of emergency procedures in preparation for the storm resulted in the staff being better aware of how to respond to events. Preparations enabled all the operators to continue IT operations during the storm. For example, unexpected water leaks materialized, but precautions such as sandbags and tarps successfully safeguarded the IT gear.
Status communication to IT departments continued during the storm. This allowed Facilities teams to provide ongoing updates to IT teams with reassurances that power, cooling and other critical infrastructure remained operational or that planned load shedding was occurring as needed.
Several owners/operators attributed their ability to ensure the storm to preparations, calling them “extremely effective” and “very effective.” Preparation pays in an emergency, as it enables personnel to anticipate and prevent problems rather than responding in a reactive way.
Disaster Recovery or Business Continuity Plan
Of the survey respondents, only one did not have a disaster recovery or business continuity plan in place.
However, when asked, “Did you use your Disaster Recovery or Business Continuity Plan?” Almost half the respondents said no, with almost all indicating that planning allowed business functions to remain in operation.
The storm did cause construction delays at one site as suppliers delayed shipments to meet the needs of operational sites impacted by the storm. While the site was not operational and a business continuity plan was not deployed, the shipping issues may have delayed outfitting, a move-in date and consolidation or expansion of other existing data centers.
Nonetheless, more than half the respondents to this question employed their business continuity plans, with some shifting mission-critical applications to other states and experiencing seamless fail over. Common responses regarding successful application of the business continuity plans were “it works,” “we used it and we were successful,” and “worked well.”
Two respondents stated that commercial power was restored before they needed to implement their business continuity plans. At one site, a last minute fuel delivery and the unexpected restoration of utility power averted the planned implementation of the business continuity plan.
Some operations implemented business continuity plans to allow employees to remain at home and off the roadways. These employees were not able to come on site because state and local governments restricted roads to emergency personnel only. However, as a result of implementing the business continuity plan, these employees were able to help keep these sites up and running.
Lessons Learned
Three survey questions captured lessons learned, including what worked and what required improvement. The most frequent answer reflected successes in preparation and pre-planning. On the flip side, fuel supply was identified as an area for improvement. It should be noted the Uptime Institute position is to rely only on on-site fuel storage rather than off-site utility or fuel suppliers.
To the question “What is the one thing you would do the same?” the two most frequent responses were
Planning with accurate, rehearsed procedures
Regular load transfer testing to switch the electrical load from utility power to engine generators
Staffing, full fuel tanks and communication with Facilities and IT personnel (both staff and management) were also mentioned.
Overwhelmingly, the most significant lesson was that all preparations were valuable. Additional positive lessons included involving staff when planning for disasters and having a sound electrical infrastructure in place. The staff knows its equipment and site. Therefore, if it is involved before a disaster occurs, it can bring ideas to the table that should be included in disaster recovery planning. Such lessons included fuel-related issues, site location, proper protection from severe weather and a range of other issues.
Remote Sites
A number of respondents were able to shift IT loads to remote sites, including sharing IT workload or uptime of cloud service providers. Load shedding of IT services proved effective for some businesses. Having a remote facility able to pick up the IT services can be a costly solution, but the expense may be worth it if the remote facility helps mitigate potential losses due to severe weather or security issues. Companies that could transfer workloads to alternate facilities in non-affected locations experienced this advantage. These cost issues are, of course, business decisions.
One owner listed maintaining an up-to-date IT load shed plan as its most important lesson. Although important, an IT load shed plan can be difficult to prioritize in multiple tenant facilities or when users think their use is the main priority. They don’t always see the bigger picture of a potential loss to the power source.
Staff
At least two respondents explicitly thanked their staffs. Having staff on site or nearby in hotels was critical to maintaining operations, according to almost half of the respondents to that question. It should be understood that riding through a storm requires that the site have appropriate infrastructure and staffing to start with, followed by good preventative maintenance, up-to-date standard operating procedures (SOPs) and disaster recovery plans.
Some businesses had staff from other locations on standby. Once the roadways opened or commercial flights resumed, depending on the location of the standby personnel, remote staff could mobilize on site. One respondent indicated the storm “stretch(ed) our resources” after the third day but nonetheless did not have to bring staff from another site.
One respondent stated that staff was the most important element and knew that local staff would be distracted if their homes and families were without power. Consequently, that company provided staff members with generators to provide essential power to their homes. This consideration allowed staff to either work remotely or be more available for on-site needs. Many such responses show that companies were thinking beyond the obvious or imminent to ensure ongoing operations during the event.
Other Facility Issues
Respondents reported no problems with space cooling equipment (chillers, computer room air handling units, etc.).
Internal Communication
One business reported that it provided a phone number so that occupants could call for status. A Facilities group at another site indicated that IT staff was concerned prior to the storm, but became more comfortable upon seeing the competency of the Facilities staff and its knowledge of the power distribution system, including the levels of backup power, during pre-communication meetings.
What Needed Improvement
“What is the one thing you would do differently?” The majority of respondents stated that they were looking at developing a more robust infrastructure, redundant engine-generator topology, moving infrastructure higher and regularly testing the switchover to engine generators prior to another emergency event. One respondent said that it was reviewing moving a data center farther from downtown Manhattan.
About half the respondents said that they would not do anything differently; their planning was so effective that their sites did not see any impacts. Even though these sites fared well, all sites should continue regular testing and update business continuity plans to ensure contact and other information is current. Improving infrastructure, continuing with proper preventative maintenance and updating contingency plans must continue to achieve the positive results characterized in this survey.
Flooding at the World Trade Center construction site.
Not surprisingly, given the number and significance of fuel supply problems, some respondents indicated that they plan to procure an additional supplier, others plan bring a fuel truck to stay on site in advance of an expected event, and some plan to increase on-site storage. Increasing storage includes modifying and improving the existing fuel oil infrastructure. The Institute advocates that the only reliable fuel supply is what can be controlled at an owner’s site. The owner does not have ultimate control over what a supplier can provide. As seen during Superstorm Sandy, a site is not guaranteed to receive fuel delivery.
Steps taken related to fuel delivery included communicating with fuel suppliers and being on a priority list for delivery. However, in the aftermath of this storm, fire, paramedics, hospitals, medical support, etc., became higher priority. In addition, fuel suppliers had their own issues remaining operational. Some refineries shut down, forcing one facility owner to procure fuel from another state. Some fuel suppliers had to obtain their own engine-generator systems, and one supplier successfully created a gravity system for dispensing fuel. There were also problems with phone systems, making it difficult for suppliers to run their businesses and communicate with customers. One supplier deployed a small engine generator to run the phone system.
Due to lack of control over off-site vendors, the Uptime Institute’s Network Owners Advisory Committee recommendation and the Tier Standard: Topology requirement is a minimum of 12 hours of Concurrently Maintainable fuel to supply N engine generators. Sites susceptible to severe storms (hurricanes, snow, tornados, etc.) are strongly encouraged to store even more fuel. Many sites anticipated the move to engine-generator power and fuel procurement but did not anticipate problems with fuel transport.
Downtown New York City immediately after the storm.
In addition, respondents reported lessons about the location of fuel tanks. Fuel storage tanks or fuel pumps should not be located below grade. As indicated, many areas below grade flooded due to either storm water or pipe damage. At least four engine-generator systems were unable to operate due to this issue. Respondents experiencing this problem plan to move pumps or other engine-generator support equipment to higher locations.
One Facilities staff reported finding sediment in fuel supplies; though, it is unknown if this was due to existing sediment in the bottom of the owner’s tanks or if the contaminants were introduced from the bottom of a fuel supplier’s tank. This facility plans to add fuel filtration systems as a result.
Infrastructure
Many comments centered on the need to increase site infrastructure resiliency with plant additions or by moving equipment to higher ground. Such construction projects would likely be easier to implement outside of dense cities, in which space is at a premium and where construction can be costly. Regardless, these improvements should be analyzed for technical robustness, feasibility and cost implications. One site stated they would be “investigating design of engine-generator plant for sustained runs.”
A few respondents saw a need to move critical facilities away from an area susceptible to a hurricane or flood. While some respondents plan to increase the resiliency of their site infrastructure, they are also evaluating extending the use of existing facilities in other locations to pick up the computing needs durin the emergency response period.
No one expected that water infiltration would have such an impact. Wind speeds were so extreme that building envelopes were not watertight, with water entering buildings through roofing and entryways. And, unusual wind directions caused unexpected problems; one respondent cautioned
“Water can get in the building when the wind blows it uphill. Be ready for it.”
Water especially flooded below grade facilities of all types.
The communication backbone, consisting of network fiber and cable, only had one report of failure within the survey. Regardless, voice system terminal devices did go down due to lack of power or limited battery duration. Sites should consider placing phone systems on engine generator and UPS power.
Load Transfer
Even if sufficient power supply infrastructure exists, equipment must be maintained and periodically tested. Most reports emphasized that regular testing proved valuable. One respondent waited until utility power failed to switch to engine-generator power to preserve fuel.
However, there was risk in waiting if issues arose during load transfer. Load transfer includes engine generators starting, ramping up, and all related controls working properly. One site that did not perform regular testing experienced problems transferring the load to engine generator. That respondent planned to begin regular testing. The failed switchover illustrates the need to perform routine testing. Both complete commissioning after construction and ongoing preventative maintenance and testing are critical.
One comment specifically stated the owner would implement “more thorough testing of the generators and the electrical system overall”; the Uptime Institute considers thorough testing like this a best practice. In addition, fuel supply, fuel distribution piping and other infrastructure should be designed to minimize the possibility of total damage with redundant systems installed in locations far from each other. Therefore, damage in an area might interrupt a single source, rather than both primary and alternate sources.
Planning
Most of the responses identified pre-planning and “tabletop scenario walkthroughs” as keys to providing uptime. Some respondents reported that they needed to update their disaster recovery plans, as IT contacts or roles and responsibilities had changed since the document was published or last revised.
Respondents noted area of improvement for planning and preparation:
Shortfalls with their business continuity plans
Out-of-date staff and contacts lists
Establish closer working relationships with cloud service providers to make sure their sites have redundancy
Re-analyzing or accelerating data center consolidations or relocations. One respondent had recently relocated their critical functions away from a facility located near the harbor, which paid off. The facility did flood; it housed only non-critical functions, and there was not a major impact.
A few respondents stated they would work with their utility company to get better communication plans in place. And, one commenter learned to start preparations earlier with storm warnings.
Some respondents said they would plan to add additional staff to the schedule prior to the event, including deploying the Emergency Response Team from another site, after realizing the impact from transportation (ground and flight) issues.
Although most plans anticipated the need to house staff in local hotels, they did not anticipate that some hotels would close. In addition, local staff was limited by road closures and gas stations that closed due to loss of power or depleted supply.
Summary
Full preparedness is not a simple proposition. However, being prepared with a robust infrastructure system, sufficient on-site fuel, available staff and knowledge of past events have proven beneficial in terms of ongoing operations.
When sites lost their IT computing services, it was due largely to either critical infrastructure components being located below grade or by depending on external resources for re-supply of engine-generator fuel—both preventable outcomes.
Solutions include the following:
Thoroughly reviewing site location—even for a 3rd-party service
Locating critical components, including fuel storage and fuel pumps, at higher elevations
Performing testing and maintenance of the infrastructure systems, in particular switching power from utility to engine generator
Ensuring sufficient duration of engine-generator fuel stored on site
Employing proper staffing
Relocating from a storm prone area
Maintaining up-to-date Disaster Recovery, Business Continuity and IT load shedding plans
Briefing stakeholders on these plans regularly to ensure confidence and common understanding
Providing a remote site to take over critical computing
Implementing and testing robust power, cooling, network and voice infrastructures
Though unforeseen issues can arise, the goal is to reduce potential impacts as much as possible. The intent of survey analysis is to share information to assist with that goal.
This video features the author, Debbie Seidman presenting the summary at the Uptime Institute Symposium in 2013
About the Authors
Debbie Seidman, PE , has 25+ years delivering highvalue (resilient, robust), energy-efficient and cost-effective projects for mission-critical facilities. As a senior consultant for the Uptime Institute, Ms. Seidman performs audits and Tier Certifications as well as provides customer engagements, advising clients throughout the design and construction phases of data center facility projects–with a focus on power and cooling infrastructure. Most recently, she was with Xcel Energy where she worked on demand-side energy-efficiency projects including data centers. Previous to that, she was with HP on the team that developed the HP POD. Ms. Seidman also served more than 20 years on HP’s Real Estate team as a project manager, facilities engineer, and operations engineer where she managed design and construction teams for projects at multiple sites totaling 2.5 million square feet, including data centers, clean rooms, research facilities, manufacturing environments, and corporate centers. Ms. Seidman holds a Bachelor of Science degree in Architectural Engineering (Building Systems Engineering) from the University of Colorado and an MBA from Colorado State University.
Vince Renaud was formerly CTO and Senior Tier Certification Authority for Uptime Institute Professional Services. Mr. Renaud has over 28 years of experience ranging from planning, engineering, design, and construction to start-up and operation. He received his Bachelor of Science degree in Civil Engineering from the Air Force Academy and a Master of Science in Engineering Management from Air Force Institute of Technology. Mr. Renaud is co-author of both Tier Standards and an instructor for the Accredited Tier Designer curriculum.
https://journal.uptimeinstitute.com/wp-content/uploads/2014/07/Hurricane-Sandy-Lessons-Learned.jpg4751201Kevin Heslinhttps://journal.uptimeinstitute.com/wp-content/uploads/2022/12/uptime-institute-logo-r_240x88_v2023-with-space.pngKevin Heslin2014-07-03 05:43:562014-07-03 05:43:56Lessons Learned From Superstorm Sandy
This paper launches the Uptime Institute FORCSS Case Study Series and introduces the FORCSS Index
Uptime Institute FORCSS is a means to capture, compare, prioritize, and communicate the benefits, costs, and impacts of multiple IT deployment alternatives. Deployment alternatives may include owned/existing data centers, commercial data centers (wholesale, retail, colocation, managed service), or IaaS (including cloud) that is procured on a scale or limited basis.
FORCSS provides organizations with the flexibility of developing specific responses to varying organizational needs. This case study series will present the process of applying the FORCSS Factors to specific deployment options, and present the outcome of the FORCSS Index—a concise structure that can be understood by ‘non-IT’ executive management.
Each case study will characterize the business needs and requirements; identify the alternatives in consideration; and outline the team, tools, and stakeholders. The case studies will apply the six FORCSS Factors to each alternative. This process will consider the supporting data inputs and various organizational, policy, technology, or other characteristics. Characteristics may influence multiple factors.
FORCSS Index The FORCSS Index is the executive summary presentation tool of a FORCSS process. The Index provides a graphical means to compare the deployment alternatives and the relative impacts of each alternative on each factor. In conversations with senior management, the Index will also facilitate discussions of the weighting of each FORCSS Factor in the ultimate decision.
The indicators may be placed in relative positions (high, medium, low) to reflect the advantages or the exposures within any given factor.
The FORCSS Index effectively compares multiple alternatives at the application or physical layer(s). Organizations executing a FORCSS analysis can populate multiple indexes to compare a range of deployment alternatives.
Certain data inputs may be weighted more heavily than others (positively or negatively) in determining the indicator position for a factor. These special considerations are defined as Key Determinants and are specifically labeled in the FORCSS Index output.
Several data inputs may be used to determine the indicator position for one factor, and one data input may affect the placement of indicators in several factors.
The FORCSS Index is designed as a means of relative comparison of any number of alternatives. Although it would seem that the logical extension of this approach would be to assign numerical scores to each data input for each factor, during FORCSS development numerical scoring was found to add unnecessary complexity which can obscure the key determinants. Scoring can also mislead as the score assigned to one factor can numerically erase the score assigned to another (prohibitive) factor, thereby defeating one of the major benefits of the FORCSS process—identifying the blind spots in the decision-making process.
INTRODUCTION: Case Study 1
This case study was developed in close collaboration with a participant in the FORCSS Charrettes and early adopter of the methodology. Confidential and sensitive information has been withheld.
The case study participant (Enterprise) is a global financial organization offering retail, personal, commercial, and wealth management services to over 12 million customers. The Enterprise is aggressively expanding in terms of both geography and revenue.
Statement of requirements: The business need driving the FORCSS process was a requirement for approximately 10,000 square feet (ft2)of computer room to replace an existing data center. The existing data center shall be vacated due to leasehold terms or the lease extended. The deployment shall be within a specific major metropolitan area of the U.S. (Region). Additionally, the solution shall be operational no later than 14 months from the time the business need was defined (Time Frame). The deployment shall offer high-availability support to a heterogeneous IT environment, with a variety of legacy equipment, from both data center infrastructure and network perspectives (Performance Requirement). There are substantial financial consequences as a result of downtime.
Deployment alternatives: The Enterprise considered a broad range of existing/corporate assets and outsourcing options in terms of the parameters and Region, Time Frame, and Performance Requirement. In this case study, the Enterprise had narrowed its deployment options to three vetted alternatives and focused on the physical/data center layer.
Alternative #1 – Refurbishment: The existing data center was housed in a building constructed in the 1970s. Previously, the Enterprise entered into a sale-leaseback arrangement for the building with an initial lease term expiring in December 2013. The building owner required a minimum 10-year lease extension. The facility is inherently constrained in terms of both computer room footprint (no future expansion opportunities) and density (80 W/ft2). In order to meet the Enterprise’s business need, significant refurbishments would need to be undertaken on the electrical and mechanical infrastructure.
The Enterprise also anticipated that downtime would be incurred during the refurbishment, as well as an extended construction interval in close proximity to operational IT equipment.
Alternative #2 – Build: The enterprise owned a building within the Region that housed a back-office function critical to the business. There was sufficient space in the building to install a robust data center topology. Additionally, there was existing critical equipment (such as backup power) that could be integrated into the new infrastructure. There was no immediate constraint to expansion of the computer room footprint and an anticipated maximum density of 150 W/ft2.
Alternative #3 – Colocation: An outsourcing option within Region had space available and infrastructure installed that met the Performance Requirements. The Colocation was willing to provision available space to suit the Enterprise’s operating characteristics within the Time Frame. The Enterprise further vetted the Colocation as “eager for its business,” which increased confidence in an expedited contracting process, as well as amicable arbitration of any change to configuration. The Colocation offered enhanced physical security characteristics that exceeded Enterprise corporate standards. In the event of expansion, the Colocation could provide proximate space, but not guarantee contiguous space unless the Enterprise leased the undeveloped space (i.e., ‘shell’) immediately at a reduced rate.
Preparing for FORCSS
The Enterprise identified a core team, augmented by additional stakeholders and disciplines, to provide feedback and concurrence before presenting to senior management/decision makers. The Enterprise had many of the internal resources required to fulfill the functions necessary for this FORCSS Case Study. In the event an organization does not have internal resources, a third-party consultant would be contracted to fulfill those functions.
Assemble the Core Team and Tools
FORCSS Leader
This individual was responsible for identifying the core team, coordinating with additional stakeholders, aggregating the data and feedback, populating the FORCSS Index, and presenting to senior management/decision makers.
Given the Time Frame, the FORCSS Leader utilized an on-staff Project Management resource to ensure timely responses from core team, vendors,
and additional stakeholders.
Business/Finance
This Enterprise function was responsible for building the business case but not responsible for the detailed accounting analysis necessary to procure services. Knowledge of the impacts of capital investment, leaseholds, and depreciation rates was key to this role to effectively identify and communicate the financial consequences of each alternative. For the Enterprise, this role existed and was known to the FORCSS team. However, this function could be ‘borrowed’ from another group. Many enterprises have an established tool to compare other (non-IT) deployment alternatives.
For example, this tool will evaluate potential locations for retail presences, transportation or distribution hubs, call centers, and office space. This formula will have been proven to be necessary and sufficient by the finance stakeholders. Thus, it will serve as an effective guide for the FORCSS team to determine the right level of financial detail for business case. It is important to note that the business case, and its formulas, will differ in detail and approach by organization and industry.
Computer Room Master Plan (CRMP) Team
The CRMP team documented Performance Requirement (resiliency, redundancy, functionality, Tier), density (watts/ft2), computer room footprint, layout of cabinets, and legacy IT equipment. In terms of legacy IT equipment, the CRMP team inventoried the type and technology; unique space, power, or cooling provisioning needs; as well as preferred placement within the computer room. The CRMP was the result of the close collaboration of the IT and Facilities/Engineering disciplines.
The IT group produced a Capacity Plan that included beginning-mid-end scenarios. For the Enterprise, the scenarios were established as Now, 5 years, and 10 years.
The Facilities group converted the IT Capacity Plan into Technical Facilities Requirements. The Technical Facilities Requirements established space, power, and cooling scenarios that responded to the IT Capacity Plan’s beginning-mid-end forecasts. The Enterprise had sufficient on-staff engineering competence and bandwidth to complete the IT-to-Facilities conversion.
The Facilities group was also responsible for multiple meetings with Engineering counterparts at the Colocation, as well as high-level feasibility analyses of the Refurbishment and Build locations.
Operations
This function reviewed the ongoing operations strategy for potential efficiencies of internal and outsourced staff, as well as assurance of staffing and expertise in accordance with the Performance Requirements.
Involve Additional Stakeholders
Additional Stakeholders may identify a key differentiator with significant influence on one or more of the FORCSS Factors. The Enterprise identified the following.
Other Corporate Requirements & Projects
Business synergies and additional return on investment may be located by conferring with the Property, Corporate Real Estate, or IT groups in regards to ongoing plans or projects underway at the buildings under consideration.
The FORCSS Core Team in this case study identified a project under careful consideration by the Corporate Real Estate teams in regards to the Build (Alternative #2). The project involved a ‘hardening’ of the infrastructure for the existing back-office function. The FORCSS and Corporate Real Estate teams
determined that, if the two projects were joined together, the hardening would be achieved in a more efficient and less costly manner than if undertaken on its own. Result: Notable influence on the Build alternative.
Environmental
The Enterprise had an established policy to purchase Carbon Credits to offset environmental impact. Environmental was informed of the nature of the project and any opportunities to impact its Sustainability. Result: No corporate-level influence.
Procurement/Sourcing
FORCSS Core Team proactively identified sourcing options so that Procurement could complete background and validity checks. Result: No influence as all sourcing options met basic criteria.
Procurement provided insight into long-standing and/or large-scale business relationship(s) that could influence the sourcing of equipment or services. Result: No influence.
Insurance
Insurance may be assessed at the site or corporate level. Result: No influence as Enterprise insurance was assessed at the corporate/portfolio level.
Risk/Compliance
Typically, the Enterprise involved Risk/Compliance at the bid or contract phase. In order to assure a smooth FORCSS process, Risk/Compliance was notified proactively of the alternatives to identify any prohibitive issues at the corporate level. Result: An established Property Risk function within the FORCSS team provided ongoing assurance for this Enterprise.
Early Engagement of Decision Maker
The Enterprise featured a distributed IT organization with multiple CIOs. The FORCSS Leader briefed the CIO with purview over the Region, introducing the alternatives and evaluation model before fully populating. Result: No Influence.
Populating the FORCSS Index
The following section will elaborate on how the Enterprise considered each factor across the deployment alternatives.
Key Determinant: Comparative Cost of Ownership
Financial(Net Revenue Impact, Comparative Cost of Ownership, Cash and Funding Commitment)
As a large financial institution, capital was readily available to support the Refurbishment and Build alternatives. Also, business need did not necessitate a Net Revenue Impact analysis as the IT function was previously established as critical. These characteristic of the Enterprise increased focus on life-cycle costs and asset value. These illustrations show the financial analysis conducted by the Enterprise.
Alternative #1 – Refurbishment: Existing facilities infrastructure (power distribution, UPS, and mechanical systems) are substantially beyond the manufacturers’ recommended usable life and require significant investment to sustain operations in this location. This alternative has significant near-term (capital) and ongoing (10-year minimum lease) commitments and shortened depreciation term. (Indexed lowest)
Alternative #2 – Build: Constructing a purpose-built computer room in existing facility required capital investment but no lease obligation. Also, ownership allowed full depreciation cycle over the full life cycle of the project. (Indexed highest)
Alternative #3 – Colocation: This alternative offered the least near-term financial commitment but an ongoing and increasing expense over the life cycle of the data center. The Enterprise also considered, but did not quantify, a potential significant exit cost from the Colocation. (Indexed middle)
Key Determinant: Business Leverage and Synergy
Opportunity(Time to Value, Scalable Capacity, Business Leverage and Synergy)
During the FORCSS process, the Enterprise vetted all alternatives against binary criteria (e.g., 14-month Time Frame, location within Region). Alternatives that did not meet these criteria were eliminated.
Alternative #1 – Refurbishment: This alternative is constrained in both area and maximum density of 50 W/ft2 due to building characteristics. Also, cabling infrastructure is unable to adhere to the Enterprise’s deployment standards. (Indexed lowest)
Alternative #2 – Build: This alternative has a density limit of 200 W/ft2, with 8,000 ft2 it satisfies both area and density requirements. This alternative provides a business synergy—building out the backup power systems addresses a business continuity need for the back-office function. (Indexed highest)
Alternative #3 – Colocation: This alternative is fastest to Value (6 months versus 12 months for Alternative #2). It also provides the most scalability—with the option to lease contiguous space at a reduced rate from the provider, and proximate space available without the additional lease option. (Indexed middle)
Key Determinant: Cost of Downtime vs. Availability
Risk(Cost of Downtime vs. Availability, Acceptable Security Assessment, Supplier Flexibility)
Alternative #1 – Refurbishment: This alternative has a high risk of service disruption during the construction phase. Also, the location of this facility is near a potential terrorist target and is in a flood plain. (Indexed lowest)
Alternative #2 – Build: This alternative has no risk associated with construction and will be under corporate control of the Enterprise. (Indexed highest)
Alternative #3 – Colocation: The Colocation provider has proven competence in the industry, and higher physical security than the Enterprise’s requirements. The Colocation also demonstrated a desire to work with the Enterprise. Nonetheless, an outsourced provider introduces some management risk. (Indexed middle)
Key Determinant: None, due to thorough due diligence
Compliance (Government Mandates, Corporate Policies, Compliance & Certifications to Industry Standards)
Due to a Property Risk competency readily available to the FORCSS Team Leader, compliance issues for each alternative were vetted prior to FORCSS exercise.
Alternative #1 – Refurbishment: Meets all requirements. (Indexed high)
Alternative #2 – Build: Meets all requirements. (Indexed high)
Alternative #3 – Colocation: Meets all requirements. (Indexed high)
Key Determinant: None
Sustainability (Carbon and Water Impact, Green Compliance & Certifications, PUE Reporting)
The business need was composed of a mix of legacy hardware, with diverse infrastructure requirements. While adhering to industry best practices for efficiency, the Enterprise requires an energy-intensive operation regardless of the deployment alternative, (i.e., equipment had to be manufactured, construction undertaken). Also, the alternatives shared the same power provider, with no differentiation for source. The Enterprise purchases carbon offsets to meet corporate sustainability goals, and the LEED facility was noted in the exercise, but sustainability was not a major factor in this decision.
Alternative #1 – Refurbishment: Meets requirements. (Indexed middle)
Alternative #2 – Build: The site is a LEED Certified Facility. (Indexed highest)
Alternative #3 – Colocation: Meets requirements. (Indexed middle)
Key Determinant: None, due to thorough due diligence
Service Quality (Application Availability, Application Performance, End-User Satisfaction)
Prior to the FORCSS process, the Enterprise vetted the network capabilities. All alternatives were in a close geographic area, without latency issues. And, deployment of an established suite of applications minimized concerns about End-User Satisfaction.
Alternative #1 – Refurbishment: Meets all requirements. (Indexed high)
Alternative #2 – Build: Meets all requirements. (Indexed high)
Alternative #3 – Colocation: Meets all requirements. (Indexed high)
Consolidated FORCSS Index
This display provides a view of the three deployment alternatives side-by-side. Notes within each indicator were withheld to offer a holistic, comparative view of the values.
Outcome: Based on this FORCSS exercise, the Build (Alternative #2) best met the business requirements.
Insight from FORCSS Leader
Our organization has historically tried to self-provision first. But, the doors have opened up. The IT departments aren’t holding onto hardware anymore, and the shorter time lines are having a huge impact on how we respond. You have to pick projects that you can do better, and you have to be ready to let go of things you can’t do fast enough. Most builds will take longer than buying the service. An IT organization isn’t linear anymore. There are multiple stakeholders who have different influences and different impacts on decisions. If you’re not thinking 3 to 5 years out, an enterprise organization won’t be to be able to respond to the business demand.
Quantifying the opportunity is a difficult, but important, aspect of the FORCSS process. One of the biggest considerations in this decision was the business synergy [providing business continuity infrastructure for an adjacent back-office function], documented in the Opportunity section. You have to be well connected across your organization or you will miss Opportunity. The IT department did not know or care about the back office getting power—they wanted a new computer room. But, the business side determined the continuity benefit was compelling.
Figure 1. Generated by Enterprise and adjusted to remove sensitive information.
Vetting a multi-tenant data center provider required due diligence. We attended site tours to review infrastructure they had provisioned before. We had them provide single-lines of how the infrastructure would look. We got as close to apples-to-apples as we could get, down to cabinet layout of the room. We had three detailed meetings where my engineering and operations teams sat down with the colocation fulfillment team.
One of the biggest risks of an outsourcer is not about the immediate contract, but about how you deal with change going forward. How do you handle change, like a new business opportunity, that isn’t in the contracts? How do you deal with non-linear growth? We never got to the point of pulling the trigger, but had a frank discussion with our board about risk associated with outsourcing and they were comfortable with the alternative.
The Board ultimately funded the Build option. I believe that our FORCSS process was successful with decision makers due to the thoroughness of our preparation. Upper management questions were limited to site characteristics (such as industry best practices for physical security), but nothing that challenged any of our fundamentals.
For today’s enterprise, speed is key: speed of decision making; speed of deployment. In this environment, the decision-making methodology must be credible and consistent and timely. We adopted FORCSS because it was thorough, independent, and industry accepted.
Julian Kudrizki
Julian Kudritzki and Matt Stansberry wrote this article, which originally appeared in Volume 3 of The Uptime Institute Journal, May 2014. Julian Kudritzki joined the Uptime Institute in 2004 and currently serves as Chief Operating Officer. He is responsible for the global proliferation of Uptime Institute Standards. He has supported the founding of Uptime Institute offices in numerous regions, including Brasil, Russia, and North Asia. He has collaborated on the development of numerous Uptime Institute publications, education programs, and unique initiatives such as Server Roundup and FORCSS. He is based in Seattle, WA.
Matt Stansberry
Matt Stansberry is director of Content and Publications for the Uptime Institute and also serves as program director for the Uptime Institute Symposium, an annual spring event that brings together 1,500 stakeholders in enterprise IT, data center facilities, and corporate real estate to deal with the critical issues surrounding enterprise computing. He was formerly Editorial Director for Tech Target’s Data Center and Virtualization media group, and was managing editor of Today’s Facility Manager magazine. He has reported on the convergence of IT and Facilities for more than a decade.
https://journal.uptimeinstitute.com/wp-content/uploads/2014/06/20-title-.jpg4751201Kevin Heslinhttps://journal.uptimeinstitute.com/wp-content/uploads/2022/12/uptime-institute-logo-r_240x88_v2023-with-space.pngKevin Heslin2014-06-26 15:45:502014-11-07 13:35:32How FORCSS Works: Case Study 1
Step-by-step guide to data center cooling best practices will help data center managers take greater advantage of the energy savings opportunities available while providing improved cooling of IT systems
The nature of data center temperature management underwent a dramatic evolution when American Society of Heating, Refrigeration, and Air-conditioning Engineers (ASHRAE) adopted new operating temperature guidelines. A range of higher intake temperatures at the IT devices has enabled substantial increases in computer room temperatures and the ability to cool using a range of ‘free cooling’ options. However, recent Uptime Institute research has demonstrated that the practices used in computer rooms to manage basic airflow and the actual adoption of increased temperatures have not kept pace with the early adopters or even the established best practices. This gap means that many site operations teams are not only missing an opportunity to reduce energy consumption but also to demonstrate to executive management that the site operations team is keeping up with the industry’s best practices.
The purpose of this technical paper is to raise awareness of the relatively simple steps that can be implemented to reduce the cost of cooling a computer room. The engineering underlying these simple steps was contained in two Uptime Institute papers. The first, Reducing Bypass Airflow is Essential for Eliminating Computer Room Hotspots, published in 2004, contained substantial research demonstrating the poor practices common in the industry. In a nutshell, the cooling capacity of the units found operating in a large sample of data centers was 2.6 times what was required to meet the IT requirement, well beyond any reasonable level of redundant capacity. In addition, an average of only 40% of the cooling air supplied to the data centers studies was used for cooling IT equipment. The remaining 60% was effectively wasted capacity, required because of mismanagement of the airflow and cooling capacity.
Uptime Institute’s subsequent paper, How to Meet ‘24 by Forever’ Cooling Demands of Your Data Center was published in 2005. This paper contained 27 recommendations that were offered to remedy air management and over capacity conditions.
New research by Upsite Technologies®, which also sponsored research leading to the Uptime Institute’s 2004 publication on bypass airflow, found that the average ratio of operating nameplate cooling capacity in use in a newer, separate and significantly larger sample had increased from 2.6 to 3.9 times the IT requirement. Clearly, the data are still relevant and, disturbingly, this trend is going the wrong direction.
The 2013 Uptime Institute user survey (see p. 108), consisting of 1,000 respondents, found some interesting and conflicting responses. Between 50 and 71% (this varied by geography) reported that it was ‘very important’ to reduce data center energy consumption. Yet, 80% (up from 71% in 2012) indicated the electrical costs are paid by real estate, and therefore, generally not readily available to the IT decision makers when specifying equipment. Most strikingly, 43% (unchanged from 2012) use cooling air below 70°F/21°C, and 3% more (down from 6% in 2012) did not know what the temperatures were. More than half (57%) were using overall room air or return air temperatures to control cooling. These are the two least effective control points.
There is fundamental conflict between the desire to reduce operational expense (OPEX) and the lack of implementation of higher cooling temperatures and the resulting benefits. The goal of this paper is to give data center managers the tools to reduce the mechanical cooling power consumption through more efficient use of cooling units. Improving airflow management will allow for elevated return air temperatures and a larger ΔT across the cooling unit resulting in increased capacity of the cooling unit. This allows for the cooling to be performed by fewer cooling units to reduce mechanical energy consumption. Further cooling system best practices are discussed, including transition to supply air control, increasing chilled water temperatures, and refurbishment or replacement of fixed speed cooling units with variable speed capability.
Uptime Institute has consistently found that many site managers are waiting for the ‘next big breakthrough’ before springing into action. The dramatic OPEX, subsequent environmental and cooling stability benefits of improved cooling air management, increased operating temperatures, variable speed cooling fans and other best practices are not being exploited by the data center industry at large.
In some cases, managers are overwhelmed by engineering speak and lack a straightforward guideline. This technical paper is designed to assist site managers with a simple high-level guide to implement these best practices quickly and successfully, and includes some straightforward metrics to get the attention of the leadership team. One such metric is the ratio of operating cooling capacity in the computer room vs. the cooling load in the computer room, which is a simple, but effective, way to identify stranded capacity and unnecessary operation of cooling units.
This paper lists 29 steps intended to focus effort on reducing the cost of cooling. Select actions may require the involvement of consultants, engineers or vendors. The first 17 steps have been divided into two groups, one called Preparatory Metrics and the other Initial Action to Manage Airflow.
Taking these steps will establish a baseline to measure the program’s effectiveness and to ensure proper airflow management. Three sets of subsequent actions describe will describe 12 steps for reducing the number of cooling units, raising temperatures in the computer room and measuring the effectiveness of these actions. The third set of actions will also set the stage driving continuous improvement in the facility.
Reductions in the cost of cooling can be achieved without any capital investment: none of the 29 actions in this paper require capital! Additional energy-efficient actions are also described but will require a more comprehensive approach, often involving engineering design and potentially capital investment. Other benefits will be realized when the cost of cooling is reduced. Correcting air management reduces hot spots, and taking cooling units off line can reduce maintenance costs.
Preparatory Metrics.
This first group of steps captures the basic data collection necessary to capture the operating status of the computer room for later comparison. It is essential that this be the first group of steps as these metrics will provide the basis for reporting later success in reducing energy consumption and reducing or eliminating hot spots. Develop the work plan covering the proposed changes.
Initial Action to Manage Airflow. The second group of steps guides step-by-step actions to rearrange existing perforated tiles and close bypass airflow openings such as cable holes and the face of the rack. Proper air management is necessary before changing the temperature in the computer room.
Subsequent Action One. Reducing the number of operating cooling units. The number of cooling units running should be adjusted to represent the necessary capacity plus the desired level of redundancy. This will involve turning selected units off.
Subsequent Action Two. Raising the temperature. Over time, increase the temperature of the air being supplied to the IT device intakes. A very slow and conservative approach is presented.
Subsequent Action Three. Reviewing and reporting metrics. Regular measurement and reporting allows the data center integrated operations team of both IT and Facilities professionals to make informed data center management decisions and will drive continuous improvement within the organization.
Selectively, some groups of steps can be done on a common initiative depending on how a particular project is being implemented. The approach in this paper is intentionally conservative.
Limitations and Conditions
Implementing change in any critical environment must be done carefully. It is important to develop and coordinate with IT a detailed site plan to supplement the 29 steps from this technical paper; this is a critical requirement for any site concerned with availability, stability and continuity of service. Retain appropriate consultants, engineers or contractors as necessary to completely understand proposed changes, especially with the physical cooling equipment changes outlined in Additional Advanced Energy Efficient Actions.
Because of air-cooling density limitations, higher density equipment may need to be supplemented with localized cooling solutions, direct liquid cooling or other innovations such as extraction hoods or chimneys. Traditionally, the cap for all ‘air cooling ’ was a power density of 7 kilowatts (kw) per rack, and that was only possible when all established best practices were being followed. Failure to follow best practices can lead to problems cooling even two kilowatt racks.
Experience shows that consistent and complete adoption of the steps in this technical paper enables successful cooling of server racks and other IT equipment at higher densities. Sites that excel at the adoption of these practices, sometimes coupled with commonly available technologies, can successfully air cool racks exceeding 10 kW (see Case Study 2). Other contemporary examples have successfully applied air cooling to even higher densities.
For sites with rack densities greater than 6 kW per rack, the Uptime Institute recommends Continuous Cooling. Continuous Cooling is where the computer room heat removal is uninterrupted during the transition from utility power to engine generator power. This is the direct analogy to uninterrupted power to the IT equipment. This recommendation is based on multiple recorded temperature excursions in the industry where the temperature and the rate of change of the temperature both exceed ASHRAE guidelines. In one case, a computer room with 250 racks at 6 kW went from 72°F to 90+°F (22°C to 32+°C) in 75 seconds when the cooling was lost.
Increasing the operating temperature of a computer room may shorten the ridethrough time for a momentary loss of cooling. Real-event experience, however, suggests the change in the ride-through time will be seconds, not minutes or hours. This explanation, which is often cited for not raising the operating temperature, is not based on fact.
ASHRAE Temperature Guidelines
Current ASHRAE TC 9.9 publications can be obtained at http://tc99.ashraetcs.org/documents.html. The TC9.9 publications should be fully understood before selecting a higher operating temperature. The ability of legacy or heritage equipment to operate in the newer temperature ranges should be validated by the IT team.
Cold Aisle/Hot Aisle
The physical arrangement of the IT equipment into what is known as Cold Aisle/Hot Aisle is another best practice. This configuration places the intake of IT equipment on the Cold (supply) Aisle and the discharge of warmer air toward the Hot (return) Aisle. Current practices permit most computer rooms to use 75°F/24°C supply in the Cold Aisle, understanding that the only temperature that matters in a computer room is the air at the intake to the computer hardware. The Hot Aisle will be substantially warmer. Noticing dramatically different temperatures while walking through a computer room with Cold Aisles/Hot Aisles is a demonstration of successful implementation and operating practices.
Proper adoption of Cold Aisle/Hot Aisle methodology improves the stability and predictability of cooling and is a key step to minimizing the mixing of hot and cold air. However, an existing legacy computer room that does not utilize a Cold Aisle/Hot Aisle configuration can still benefit from improved airflow management. Perforated floor tiles providing raised-floor cooling air should be placed immediately adjacent to the front of the rack they are cooling. Temperatures in a legacy environment will not be as distinctive as in a Cold Aisle/Hot Aisle environment, and extra caution is required when implementing these best practices. Additional check points should be added to ensure that undesired temperature increases are identified and quickly addressed during the rearrangement of floor tiles.
For maximum benefit, a strategic computer room master plan should be developed. This master plan will identify the arrangement of the rows of IT equipment, the positions in rows or the room for power support equipment, and the number and arrangement of the cooling units to support the ultimate capacity of the space. The master plan also reserves locations for IT, power and cooling equipment that may not be installed for some time, so that when the equipment is required, there is not a crisis to determine where to install it; it is preplanned. A computer room master plan is of value for a new room or reconfiguring an existing room.
29 Cooling Best Practices Group one: Preparatory metrics
1. Determine the IT load in kilowatts.
2. Measure the intake temperature across the data center, including where hot spots have been experienced. At a minimum, record the temperature at mid-height at the end of each row of racks and at the top of a rack in the center of each row. Record locations, temperatures and time/date manually or using an automated system. These data will be used later as a point of comparison.
3. Measure the power draw to operate the cooling units in kilowatts. Often, there is a dedicated panel serving these devices. This may be accessible from a monitoring system. These data will be used later as a point of comparison and calculation of kilowatt-hours and long-term cost savings.
4. Measure the room’s sensible cooling load as found. This can be done by measuring the airflow volume for each cooling unit and recording the supply and return temperatures for each unit that is running. The sensible capacity of each operating unit in kW for each unit can be calculated using the expression Q sensible (kW) = 0.316*CFM*(Return Temp°F – Supply Temp°F)/1000 [Q sensible (kW) = 1.21*CMH*(Return Temp°C – Supply Temp°C)/3600]
The room’s sensible load is the sum of each cooling unit running in the room. Organize the data in a spreadsheet or similar tool to record each data point, supply and return temperature, ΔT (return-supply), airflow, kilowatt sensible and sum to provide overall room sensible load. Confirm that entire IT load is being serviced by the cooling system, that there is not additional IT load in another room and that the cooling plant is not supporting any non-IT load.
Compare the cooling load to the IT load for a point of reference.
5. Using the airflow and return air temperature measured in the previous step, request the sensible capacity of each unit in kilowatts from the equipment vendor. Enter this nominal sensible capacity in the spreadsheet. Sum the sensible capacity for the units that are operating. This is a quick and easy approximation of the sensible-cooling capacity of the cooling units in use. More complex methods are available but were not included here for simplicity.
6. Divide the overall room operating cooling sensible capacity in kilowatts determined in previous step by the sensible operating cooling load determined in Step 4. This number presents a simple ratio of operating capacity versus cooling load. The ratio could be as low as 1.15 (where the cooling capacity matches IT load with one cooling unit in six redundant), but will likely be much higher. This ratio is a benchmark to evaluate subsequent improvement as reduction of this ratio will occur with the reduction of operating cooling units.
7. Cooperatively with IT, determine the maximum allowable intake temperature for the new operating environment. For temperatures above 75°F, there may be offsetting power increases within the IT devices from their onboard cooling fans.
8. Using the data developed above, create a work plan outlining goals of the effort, detail the metrics that will be monitored to ensure the cooling environment is not disrupted, specify a back-out plan should a problem be discovered and identify the performance metrics that will be tracked for rack inlet temperatures, power consumption, etc. This plan should be fully communicated with IT as a key member of the critical operations team.
Group two: Initial action to manage airflow
9. Relocate all raised-floor perforated tiles to the Cold Aisle. Replace perforated tile supporting a given rack should be placed immediately in front of the rack. As a starting baseline, each rack with IT equipment producing cooling load should have a single perforated floor tile in front of it. Empty racks and racks with no electrical load should have a solid tile in front of them. Give special consideration to racks populated with network equipment like switches or patch panels.
10. If a return air plenum is used, ensure that the placement of ceiling return grilles aligns with the Hot Aisles.
11. Seal the vertical front of the racks using blanking plates or other systems to prevent Cold Aisle air from moving through the empty rack positions into the Hot Aisle.
12. Seal the cable holes in raised floor, if used.
13. Seal any holes in the walls or structure surrounding the computer room. Check walls below the raised floor and above the ceiling. Check for unsealed openings in the structure under or over the computer room. Typical issues are found where conduits, cables or pipes enter the computer room.
14. Seal any supply air leakage around the cooling units, if they are located in the computer room.
15. Ensure that all cooling units in the space are equipped with a backflow damper or fabricate covers for units designated as off to prevent backflow of cooling through powered-off cooling units.
16. Seal any leakage of cooling air at power distribution units, distribution panels or other electrical devices mounted on the raised floor.
17. Record the temperatures at the same locations as in Step 2. Compare this and prior readings to determine if any intake temperatures have increased. If an increase is observed, increase airflow to the problem rack by moving a raised-floor perforated tile from an area that does not have any hot spots or by replacing the standard perforated floor tile with a higher flow rate perforated floor tile.
Subsequent action one: Reducing the number of operating cooling units by shutting units off.
18. Identify the cooling units with the lowest sensible load. These units will be the first units to be turned off as the following process is implemented.
19. Estimate the number of required cooling units by dividing the IT load by the smallest sensible cooling unit capacity. This will approximate the number of cooling units needed to support the IT load.
20. Uptime Institute recommends redundancy in large computer rooms of 1 redundant unit for every six cooling units. Smaller or oddly shaped rooms may require a higher level of redundancy. Divide the required number of cooling units by six to determine the number of redundant cooling units. Round up to the next higher whole number. This is the suggested number of redundant cooling units for the IT load.
21. Add the results of the two previous steps. This will be the desired number of cooling units necessary to operate to meet the IT load and provide 1:6 redundant cooling units. This should be fewer than the total number of cooling units installed.
22. Turn off one operating cooling unit each week until only the desired number of cooling units determined in the previous step remains operating.
23. With each ‘excess’ cooling unit being shut off, examine reducing the number of perforated tiles to match the reduced airflow being supplied to the room. If a temperature increase is observed, increase airflow to the problem rack by adding perforated floor tiles or utilizing higher flow rate perforated floor tiles. The placement of floor tiles to appropriately match cooling supply is an iterative process.
24. Before each subsequent reduction in the number of operating cooling units, record the temperatures at the same locations as in Step 2. Compare this and prior readings to determine if any server intake temperatures have increased. If an increase is observed, increase airflow to the problem rack by moving a perforated tile from an area that does not have any hot spots.
25. When the desired number of units has been reached, record the power draw for the cooling units as in Step 3. This may be possible through existing monitoring. Compare the before and after to observe the reduction in power draw.
Subsequent action two: Raising the temperature in the computer room.
26. Increase the temperature set point on each cooling unit one or two degrees a week until the server intake air is at the desired level, for example the highest server intake temperature is 75°F/24°C. To accomplish this faster, a greater rate of change should be discussed with and agreed to by the data center integrated operations team. (Note: this step can be completed regardless of whether the cooling unit uses supply or return air control. If the unit has return air control, the set point will seem quite high, but the supply air will be in the acceptable range.)
27. Before each subsequent increase in set point temperature, record the temperatures at the same locations as in Step 2. Compare this and prior readings to determine if any server intake temperatures have increased. If an increase is observed, increase airflow to the problem rack by moving a perforated tile from an area that does not have any hot spots.
Subsequent action three: Review and report metrics.
28. Re-create the preparatory metrics from Steps 1-6 and compare to the original values. This includes the following metrics:
Total cooling unit power consumption
Ratio of operating cooling capacity and cooling load
IT device inlet temperatures
29. Calculate the overall power savings based on the implemented measures and estimate annual operations savings based upon kilowatt-hours reduced and the average cost of power. Report the progress to the integrated data center operations team.
Additional Advanced Energy-Efficient Actions
There are additional measures, which can be taken in order to further increase the overall efficiency of the cooling systems supporting the data center, including implementing variable speed/frequency fan drives, utilizing supply air control and increasing the chilled-water temperature where chilled-water systems are utilized. These measures, while requiring increased engineering study and operational awareness prior to implementation, can continue to lower the amount of electricity required for the cooling plant, while simultaneously maintaining a more consistent ambient environment in the data center.
Implementing supply air control
Supply air control typically requires the addition of supply air temperature sensors, as legacy air conditioners are typically not equipped with these devices. The supply air sensors will be the modulation control point for the units to ensure a consistent supply air temperature for the data center.
Most legacy data centers are still utilizing standard return air control methodologies. However, data centers with supply air control methods are realizing two important benefits. First, in conjunction with good airflow management practices, supply air control guarantees a consistent inlet air temperature through all cold aisles in the data center. Second, it reduces the importance of the ΔT of the air handlers. Data centers utilizing return air control are forced to use an artificially low return air set point in order to guarantee that the cold aisle temperatures do not exceed their normal design temperature. But, this is not an issue for data centers utilizing supply air control.
Considerations
Supply air control typically reacts much faster than return air control, so there is the possibility of increased ‘hunting ’ to find the set point. Often, implementing supply air control requires modification of the control algorithms that the units use to modulate cooling. This should be done in close concert with the original equipment manufacturer (OEM).
This control scheme should use an adjustable set point for supply air, and additionally there should not be any automatic reset on the desired supply air temperature. The objective is to have all underfloor air at the same temperature.
Figure 2. The power consumption of a fan is a function of the cube of the fan speed.
Implementing variable speed fan drives
Since the power consumption of a fan is a function of the cube of the fan speed, operating additional variable speed cooling units or fans will further reduce power consumption (see Figure 2). This can be accomplished by retrofitting any constant speed cooling fans to variable speed or by replacing legacy units with new units with built in variable speed capability. Implementing variable speed fan drives will require close interaction with the OEM of the cooling units, and possibly, other assistance, depending on the qualifications of the facility staff.
Considerations
There are various ways of controlling the variable speed fans of the cooling units, but the most common is the use of underfloor static pressure. A less consistently applied control method is controlling variable speed fans based on temperature sensors within the cold aisle. Static pressure can be difficult to measure accurately.
Therefore, it is a good practice to have groups or even all units operating at the same speed. This helps to ensure that units are not constantly fighting each other and excessively modulating to maintain the set point.
As a best practice, the implementation of variable speed fan drives should not be done without prior installation of supply air control on the cooling units. Using variable speed fan drives in conjunction with return air control can lead to lower temperature differentials (ΔT’s), which can in turn lead to increased Cold Aisle temperatures, potentially even above the desired limit. To alleviate this issue, the return air set point has to be reduced, thereby defeating the potential savings realized by implementing the variable speed fan drives.
Using variable speed fan drives will typically change the airflow characteristics of the room. Therefore, it is important to monitor temperatures at the inlet of the IT devices. If higher temperatures are observed, perforated floor tile type and location may need modification.
Increasing Chilled Water Temperature
A chilled water system is one of the largest single facility power consumers in the data center. Raising the air handler temperature set point provides the opportunity to increase the temperature of the chilled water and further reduce energy consumption. Typical legacy data centers have chilled water set points between 42-45°F (6-7°C). Facilities that have gone through optimization of their cooling systems have successfully raised their chilled water temperatures to 50°F (10°C) or higher.
Considerations
The maximum allowable chilled water temperature will be based on the performance capabilities of both the chiller and the air handler units. Therefore, it is imperative to work in close contact with both the chiller and air handler unit OEMs to ensure that the chilled water temperature can be increased without impacting the data center. Increasing the chilled water temperature will have an impact on the capacity of the cooling units and should be implemented very slowly, potentially only increasing the set point by a single degree per week.
Some facilities require colder chilled water temperature in order to dehumidify the air in the data center. An engineering analysis should be performed to determine whether or not a low chilled water temperature is required for dehumidification processes. The savings from implementing higher chilled water temperatures can be so great that investigating alternative dehumidification methods may be warranted.
Case Study 1: How NOT to implement changes in a computer room.
A mechanical system diagnostic assessment was performed for a confidential client’s global support data center’s 40,000-ft2 (3,700-m2) computer room with over 70 chilled-water cooling units. Only 35 units (including redundancy) were required to keep the room cool. Upon receiving the preliminary study, the facility staff began turning cooling units off in a random and unplanned manner and without communicating with IT. Within five minutes, critical computer and storage equipment had shut down, interrupting the mission-critical computing (internal protective sensors that had sensed high temperatures automatically shut down some of the hardware). IT management, which was not aware of the initiative to reduce energy use, immediately demanded all cooling units be turned back on and the hot spots went away. After this very unpleasant experience, no further attempts were made at cooling optimization.
The failed attempt to reduce facility energy consumption outlined in this case study illustrates the necessity of making changes in a computer environment in a methodical, planned and well communicated way. Purposefully implementing the best practices established by Uptime Institute research can be done with great success if done in a prudent manner with the involvement and support of IT management.
Case Study 2: Overcoming legacy capabilities in a 20-year-old data center.
Designed for less than 2 kW per rack, Agriculture and Agri-Food Canada (AAFC)’s 20-year old data center was updated to successfully support multiple 10-kW racks using only air cooling. Best practices were followed for managing airflow, including selective use of hot-air containment and extraction technology. The temperatures in the room stabilized and previous hot spots were eliminated, in addition to supporting racks of a dramatically higher density than previously envisioned. This project earned AAFC and Opengate a 2011 GEIT award winner in the Outstanding Facilities Product in a User Deployment category. In addition, Opengate made the project the subject of a 2012 Symposium Technology Innovation presentation.
Case Study 3: A 40-year-old data center updates fan monitoring and controls to reduce fan energy consumption by 24%.
Lawrence Berkeley National Laboratories (a 2013 GEIT Finalist) used variable- speed controls to slow fan speeds. Since fan energy consumption is a function of the cube of fan speed, slowing down the fans brings an immediate and measurable reduction in energy consumption. This implementation used available technology and was performed after best practices in air management were met.
About the Authors
W. Pitt Turner IV, PE, is the executive director emeritus of Uptime Institute, LLC. Since 1993 he has been a senior consultant and principal for
Uptime Institute Professional Services (UIPS), previously known as ComputerSite Engineering, Inc. Uptime Institute includes UIPS, the Institute Uptime Network, a peer group of over 100 data center owners and operators in North America, EMEA, Latin America, and Asia Pacific, as well as the Uptime Institute Symposium, a major annual international conference. Uptime Institute is an independent operating unit of The 451 Group.
Before joining Uptime Institute, Mr.Turner was with Pacific Bell, now AT&T, for more than 20 years in their corporate real estate group, where he held a wide variety of leadership positions in real estate property management, major construction projects, capital project justification and capital budget management. He has a BS Mechanical Engineering from UC Davis and an MBA with honors in Management from Golden Gate University in San Francisco. He is a registered professional engineer in several states. He travels extensively and is a school-trained chef.
Keith Klesner’s career in critical facilities spans 14 years and includes responsibilities ranging from planning, engineering, design and construction to start-up and ongoing operation of data centers and mission-critical facilities. In the role of Uptime Institute vice president of Engineering, Mr. Klesner provides leadership and strategic direction to maintain the highest levels of availability for leading organizations around the world. Mr. Klesner performs strategic-level consulting engagements, Tier Certifications and industry outreach—in addition to instructing premiere professional accreditation courses. Prior to joining the Uptime Institute, Mr. Klesner was responsible for the planning, design, construction, operation and maintenance of critical facilities for the U.S. government worldwide. His early career includes six years as a U.S. Air Force officer. He has a Bachelor of Science degree in Civil Engineering from the University of Colorado- Boulder and a Masters in Business Administration from the University of LaVerne. He maintains status as a professional engineer (PE) in Colorado and is a LEED-accredited professional.
Ryan Orr has been an Uptime Institute Professional Services Consultant since January 2012. In this role, he performs Tier Certifications of Design, Constructed Facility and Operational Sustainability. Additionally, he performs M&O Stamp of Approval reviews and custom consulting activities. Prior to joining the Uptime Institute, Mr. Orr was with the Boeing Company, where he provided engineering, maintenance and operations support to both legacy and new data centers nationwide. This support included project planning, design, commissioning and implementation of industry best practices for mechanical systems. Mr. Orr holds a BS degree in Mechanical Engineering from Oregon State University.
https://journal.uptimeinstitute.com/wp-content/uploads/2014/06/04.jpg4751201Kevin Heslinhttps://journal.uptimeinstitute.com/wp-content/uploads/2022/12/uptime-institute-logo-r_240x88_v2023-with-space.pngKevin Heslin2014-06-25 11:45:592014-06-25 11:45:59Implementing Data Center Cooling Best Practices
Data center operations and management are increasingly the target of codes that impact safety, communications, and economic systems. Going well beyond the guidelines laid out by NFPA 75 and 76, the new 2011 National Electrical Code (NFPA 70) actually provides for regulatory oversight of mission-critical facility management. This video will provide a history of codes as they apply to data centers, and a strategy for answering and implementing code provisions to avoid problems with inspectors.
This video, shot at Uptime Institute Symposium 2013, features Richard L Sawyer, Global Strategist, HP Critical Facilities Services.
https://journal.uptimeinstitute.com/wp-content/uploads/2014/06/elie2.jpg4751201Matt Stansberryhttps://journal.uptimeinstitute.com/wp-content/uploads/2022/12/uptime-institute-logo-r_240x88_v2023-with-space.pngMatt Stansberry2014-06-24 08:57:392015-07-13 13:11:23Code mandates for data center operations
In 2013, Barclays removed 9,124 physical servers from its data centers globally, winning Uptime Institute’s Server Roundup competition for the second year running. This effort is part of a server footprint reduction across the entire company. The organization reaped significant cost benefits, but this project has also reduced risk and complexity, providing Barclays’ internal IT customers better uptime, and positions these teams to get either on to, or ready for, next-generation solutions like cloud.
The direct cost benefit of this effort sells itself, but the lasting legacy of the server reduction program at Barclays will be the benefits of getting off technologies that are holding the business back, and replacing them with IT services that are more future-friendly.
This keynote video from Uptime Institute Symposium 2014 will provide you with a roadmap for starting your own server decommissioning project.
https://journal.uptimeinstitute.com/wp-content/uploads/2014/06/25.jpg4751201Matt Stansberryhttps://journal.uptimeinstitute.com/wp-content/uploads/2022/12/uptime-institute-logo-r_240x88_v2023-with-space.pngMatt Stansberry2014-06-18 13:40:172014-06-18 13:40:17Server Decommissioning as a Discipline: Paul Nally, Barclays
ATD Interview: Elie Siam, Pierre Dammous & Partners
/in Design/by Kevin HeslinIndustry Perspective: Three Accredited Tier Designers (ATDs) discuss 25 years of data center evolution
The experiences of Christopher Johnston, Elie Siam, and Dennis Julian are very different. Yet, their experiences as Accredited Tier Designers (ATDs) all highlight the pace of change in the industry. Somehow, though, despite significant changes in how IT services are delivered and business practices affect design, the challenge of meeting reliability goals remains very much the same, complicated only by greater energy concerns and increased density. All three men agree that Uptime Institute’s Tiers and ATD programs have helped raise the level of practice worldwide and the quality of facilities. In this installment, Elie Siam of Pierre Dammous & Partners examines worldwide trends with a perspective honed in the Uptime Institute’s EMEA region. This is the second of three ATD interviews from the May 2014 Issue of the Uptime Institute Journal.
Mathworks data hall, a Pierre Dammous & Partners project.
Elie Siam graduated in 1993 from the American University of Beirut and joined Pierre Dammous & Partners (PDP) in 1994 as a design engineer. PDP is an engineering consulting firm with offices in Beirut, Riyadh, and Abu Dhabi. The firm is dedicated to the supply of quality services in mechanical, electrical, plumbing, fire, and telecommunications systems. After multiple successes, Mr. Siam became the lead of the team for resolving mission-critical facilities problems and eventually proved to be a local authority in the Electrical Engineering field. He is an active contributor to Lebanese Standards and a Building Services Instructor at Lebanon’s Notre Dame University. He has special qualifications in telecommunications and data networks and established highly performing systems for large banks (Credit Libanais, SGBL, SGBJ, Fransabank, CSC, BBAC, LCB, BLOM), telecom companies (IDM, STC), universities (LAU, Balamand), and leading media companies (Annahar, VTR, Bloomberg).
Elie, please tell me about yourself.
I have been headquartered in Beirut and worked here since 1993, when I graduated from the American University of Beirut as an electrical engineer and started work at Pierre Dammous & Partners (PDP) in 1994, so just over 20 years now.
A substantial part of our work at PDP is related to telecom and power infrastructure.
When PDP started with server rooms and then data centers, I decided to get an ATD accreditation, due to my exposure to networks.
We have done a lot of data center projects, not all of them Tier Certified. The issue is that the data center market in Lebanon is small, but clients are becoming more aware. Consequently, we are doing more Tier designs. Tier III is the most commonly requested, mostly from banking institutions.
The central bank of Lebanon has asked for qualifying banks to go to Tier III and now the market is picking up.
We are also starting to do design and construction management for data centers outside Lebanon as in Dubai (Bloomberg Currency House), Amman (Societé Générale de Banque – Jordanie), or Larnaca (CSC bank). We also did large colocation data centers for a major telecom company in Riyadh and Dammam.
Which project are you most proud of?
Well, I’ve worked on many kinds of projects, including hospitality, health care, and data centers. My last data center project was for a Saudi Arabian telecom company, and that was a 25-MW facility to house 1,200 server racks. It was awarded Tier III Certification of Design Documents.
Our responsibility was to do the design up to construction drawings, but we were not involved in the construction phase. The client was going to go for a Tier Certification of Constructed Facility, but, again, we are not involved in this process. It is a very nice, large-scale project.
The project is composed of two parts. The first part is a power plant building that can generate 25 MW of redundant continuous power, and the second part is the data center building.
Is the bulk of your work in Beirut?
By number of projects, yes. By the number of racks, no. One project in Saudi Arabia or the Gulf countries could be like 50 projects in Beirut. When you design a project in the Gulf Countries, it’s for 1,200 racks, and when you design one in Beirut, it’s for about 25 racks.
What drives the larger projects to Saudi Arabia?
Money, and the population. The population of Lebanon is about 4 million. Saudi Arabia has about 25-30 million people. It is also fiscally larger. I’m not sure of the numbers, but Saudi Arabia has something like US$60 billion in terms of annual budget surplus. Lebanon has an annual budget deficit of US$4.5 billion.
Tourism in Lebanon, one of the main pillars of the economy, is tending to zero, due to political issues in Syria. Consequently, we have economic issues affecting growth.
Is it difficult for a Lebanese company to get projects in Saudi Arabia?
Yes, it can be difficult. You have to know people there. You have to be qualified. You have to be known to be qualified. You can be qualified, but if you can’t prove it you won’t get work, so you have to be known to be qualified so you can grasp jobs.
We have a branch office in Dubai for Dubai and UAE projects and also for some projects in Saudi Arabia as well. We‘ve done many projects in Jeddah and Riyadh, so people know us there.
Also, we are partly owned by an American company called Ted Jacob Engineering Group, which owns 25% of PDP. This ownership facilitates the way we can get introduced to projects in the Gulf because our partner is well known in the region.
Tell me about some of your current projects.
We are working on three new data centers, each above 200 kW. Two of them belong to Fransabank (main site and business continuity site) while the third belongs to CSC bank. All of them will be going for Tier III Certification. We’re also working on several other smaller scale data center projects.
One of the major data centers currently in construction in Lebanon is for Audi Bank, which is designed and executed by Schneider Electric. The second project is for another banking institution called Credit Libanais. It is 95% complete, as of April 2014. We are the designers. We also worked as integrators and BIM (building information modeling) engineers and did the testing and commissioning. This is a 120-kW data center.
The Credit Libanais facility has the following features:
What does Credit Libanais plan to do with the facility?
Credit Libanais is one of the top banks in Beirut. They have about 70 branches. They are constructing a new 32-story headquarters building. This will be the main data center of the bank. The data center is in a basement floor. It is about 450 m2 with 120 kW of net IT load. The data center will handle all the functions of the bank. An additional 350-m2 space hosts a company called Credit Card Management (CCM). CCM has also a dedicated server room within the Credit Libanais data center.
At first Credit Libanais did not want to engage in Tier Certification because they do not provide colocation services, but they changed their minds. In March, I queried the Uptime Institute for a proposal, which I brought back to the bank. The proposal includes full support including Tier III Certification of the Design, Constructed Facility, and Operations.
Can you describe the cooling system of the Credit Libanais data center in more detail?
The critical environment is water cooled. Not only is it water cooled, but it is water cooled at relatively high temperatures. Normally water-cooled systems for building’s supply water at around 6°C; this data center uses a 10°C chilled water temperature, which greatly increases the efficiency and reduces cost.
Since the cold water temperature is not too low, there is no need to provide large-scale humidification because water will not condense as much as when the chilled water temperature is lower, which substantially saves on energy.
The chillers also have variable speed compressors and variable chilled water pumps, and the fans of the chillers and the fans of the CRACs all have EC variable speed fans so that you can permanently adjust the speed to exactly the amount of capacity you would like to have and are not working at either 100 or 0%.
What’s the value of being an ATD?
I believe that you would need to have substantial experience before you go for the accreditation because if you do not have experience you would not benefit. But, it is very useful for people who have experience in mechanical and electrical engineering and even more useful for those who have more experience in data centers.
You could get experience from working on clients’ projects, but you would need the accreditation to know how things should be done in a data center and what things that should not be overlooked. To do that you need a methodology and the ATD gives you that.
ATD gives you a methodology that eliminates forgetting things or overlooking things that could lead to failure.
When you go through the training they teach you the methodology to check each and every system so that they are Concurrently Maintainable or Fault Tolerant, as required by the client.
This article was written by Kevin Heslin, senior editor at the Uptime Institute. He served as an editor at New York Construction News, Sutton Publishing, the IESNA, and BNP Media, where he founded Mission Critical, the leading publication dedicated to data center and backup power professionals. In addition, Heslin served as communications manager at the Lighting Research Center of Rensselaer Polytechnic Institute. He earned the B.A. in Journalism from Fordham University in 1981 and a B.S. in Technical Communications from Rensselaer Polytechnic Institute in 2000.
Lessons Learned From Superstorm Sandy
/in Operations/by Kevin HeslinAn Uptime Institute survey reveals that best practices and preparation pay dividends
In late October 2012, Superstorm Sandy tore through the Caribbean and up the east coast of the U.S., killing over a hundred, leaving millions without power and causing billions of dollars in damage. In the aftermath of the storm, Uptime Institute surveyed data center operators to gather information on how Sandy affected data center and IT operations.
The acute damage caused by Superstorm Sandy in the Northeast was thoroughly documented. But it is important to note that regional events have larger implications. The survey found that Superstorm Sandy caused damage and problems far from its path. For example, one site in the Midwest experienced construction delays as equipment and material deliveries were diverted to sites affected by the hurricane. Another business incurred similar delays at a leased facility that was being remodeled for its use. The timelines for both of these projects had to be adjusted.
The survey focuses primarily on the northeast corridor of the U.S. as the Greater New York City area took the brunt of the storm and suffered the most devastating losses. This area has a longstanding and rigorous data center operations culture. A total of 131 end users completed at least part of the survey, with 115 responding to all questions that applied. Many of the survey respondents were also Uptime Institute Network members, who could be expected to be highly familiar with industry best practices. These factors may have led survey respondents to be better prepared than a more general survey population.
The survey examined preparations, how facilities fared during the storm and after actions taken by the data center owners and operators to ensure availability and safeguard of critical equipment. Of all respondents spread through North America, approximately one-third said they were affected by the storm in some way. The survey results show that natural disasters can bring unexpected risks, but also reveal planning and preemptive measures that can be applied in anticipation of a catastrophic event. The path traveled by Superstorm Sandy can be considered susceptible to hurricanes, yet any data center is vulnerable to man-made or natural disasters, no matter its location. And natural disasters are trending upward in frequency and magnitude.
In the aftermath of Sandy, the Office of the President of the United States and Department of Energy jointly asserted, “In 2012, the United States suffered eleven billion-dollar weather disasters–the second-most for any year on record, behind only 2011,” according to Economic Benefits Of Increasing Electric Grid Resilience to Weather Outages, a report prepared by the President’s Council of Economic Advisers and the U.S. Department of Energy’s Office of Electricity Delivery and Energy Reliability with assistance from the White House Office of Science and Technology.
In this context, the role of the data center owner, operator and designer is even more important: to identify the risks and mitigate them. Mitigation can often be achieved in many ways.
Questions
The survey focused on four main topics:
Select questions asked for a yes or no answer; many required respondents to answer in their own words. These narrative responses make up the bulk of the survey and provided key insight into the study results.
Impact on Organizational Computing
The majority of responses to the first question, “Describe the nature of how your organization’s computing needs were impacted,” centered on loss of utility power or limited engine generator runtime, usually because of lack of fuel or fuel supply problems.
Almost all the respondents in the path of the storm went on engine generators during the course of the storm, with a couple following industry best practice by going on engine generators before losing utility power. About three-quarters of the respondents who turned to engine generators successfully rode out the storm and the days after. The remainder turned to disaster recovery sites or underwent an orderly shutdown. For all who turned to engine-generator power, maintaining sufficient on-site fuel storage was a key to remaining operational.
Utility power outages were widespread due to high winds and flooding. Notably, two sites that had two separate commercial power feeds were not immune. One site lost one utility feed completely, and large voltage swings rendered the other unstable. Thus, the additional infrastructure investment was unusable in these circumstances.
The Tier Standard: Topology does not specify a number of utility feeds or their configuration. In fact, there is intentionally no utility feed requirement at all. The Uptime Institute recommends, instead, that data center owners invest in a robust on-site power generation system (typically engine generators), as this is the only source of reliable power for the data center.
Survey respondents reported engine-generator runtimes ranging from one hour to eight days, with flooding affecting fuel storage, fuel pumps or fuel piping distribution, limiting the runtime of about a quarter of the engine generator systems. In one case, building management warned a data center tenant that it would need to shut down the building’s engine generators if flooding worsened. As a result, the tenant proactively shut down operations. Several operators remained on engine-generator power after utility power was restored due to the “unreliable grid.” Additionally, for some respondents, timely delivery of fuel to fill tanks was not available as fuel shortages caused fuel vendors to prioritize hospitals and other life-safety facilities. In short, fuel delivery SLAs were unenforceable.
Uptime Institute Tier Certified data centers have a minimum requirement of 12 of on-site fuel storage to support N engine generators. However, this storm showed that even a backup plan for fuel delivery is no guarantee that fuel will be available to replenish this stock. In some cases fuel supplier power outages, fuel shortages or closed roadways prevented deliveries. In other cases, however, companies that thought they were on a priority list learned hospitals, fire stations and police had even higher priority.
Other affects could be traced to design issues, rather than operations. One site experienced an unanticipated outage when the engine generator overheated. Wind pressure and direction prevented hot exhaust air from exhausting properly.
Facilities with engine generators, fuel storage or fuel pumps in underground basements experienced problems. One respondent reported that a facility had a sufficient volume of fuel; however, the fuel was underwater. The respondent remarked, “Couldn’t get those [engine generators] to run very well on sea water.” Although building owners may not have expected Sandy to cause flooding, localized flooding from broken mains or other sources often accompanies major events and should be mitigated accordingly.
One respondent noted that site communications were interrupted, thereby rendering the facility’s engine generators unusable. And several buildings were declared uninhabitable because the lobby and elevators were underwater.
Figure 2. Flooding in the Hoboken PATH station. Photos in this article depict the widespread flooding resulting from Hurricane Sandy and were contributed by Sabey and other respondents to the survey.
A respondent also noted that water also infiltrated spaces that would normally be watertight in a typical rainstorm because the severe winds (100+ MPH) pushed water uphill and along unusual paths. One response stated that high winds pushed water past roof flashing and vents: “Our roofing system is only waterproof when water follows gravity.” Although traditionally outside of design parameters and worse-case considerations, Superstorm Sandy provides a potent justification for appropriate amendments to building characteristics. For a greenfield site or potential upgrades at an existing site, business decisions should be made considering the design loads and wind speed potential to be designed for versus the use of the building. This may also impact decisions about where to locate a data center.
Storm Preparation
The second question, “Describe any preparations you made prior to the storm,” brought a variety of responses. Almost all the respondents reported that they topped off fuel or arranged additional fuel, and one-third made sleeping and food provisions for operators or vendors expected to be on extended shift. About one-quarter of respondents reported checking that business continuity and maintenance actions were up-to-date. Others ensured that roof and other drainage structures were clear and working. And, a handful obtained sandbags.
All respondents to the question stated they had reviewed operational procedures with their teams to ensure a thorough understanding of standard and emergency procedures. Several reported that they brought in key vendors to work with their crews on site during the event, which they said proved helpful.
Downtown New York City immediately after the storm.
Some firms also had remote Operations Emergency Response Teams to relieve the local staff, with one reporting that blocked roadways and flight cancellations prevented arrival for lengthy periods of time.
A few respondents said that personnel and vendors were asked to vacate sites for their own safety. Three respondents stated that they tested their Business Continuity Plans and provided emergency bridge lines so that key stakeholders could call in and get updates.
Active construction sites provided a difficult challenge as construction materials needed to be secured so they would not become airborne and cause damage or loss.
Effectiveness of Preparations
Multiple respondents said that conducting an in-depth review of emergency procedures in preparation for the storm resulted in the staff being better aware of how to respond to events. Preparations enabled all the operators to continue IT operations during the storm. For example, unexpected water leaks materialized, but precautions such as sandbags and tarps successfully safeguarded the IT gear.
Status communication to IT departments continued during the storm. This allowed Facilities teams to provide ongoing updates to IT teams with reassurances that power, cooling and other critical infrastructure remained operational or that planned load shedding was occurring as needed.
Several owners/operators attributed their ability to ensure the storm to preparations, calling them “extremely effective” and “very effective.” Preparation pays in an emergency, as it enables personnel to anticipate and prevent problems rather than responding in a reactive way.
Disaster Recovery or Business Continuity Plan
Of the survey respondents, only one did not have a disaster recovery or business continuity plan in place.
However, when asked, “Did you use your Disaster Recovery or Business Continuity Plan?” Almost half the respondents said no, with almost all indicating that planning allowed business functions to remain in operation.
The storm did cause construction delays at one site as suppliers delayed shipments to meet the needs of operational sites impacted by the storm. While the site was not operational and a business continuity plan was not deployed, the shipping issues may have delayed outfitting, a move-in date and consolidation or expansion of other existing data centers.
Nonetheless, more than half the respondents to this question employed their business continuity plans, with some shifting mission-critical applications to other states and experiencing seamless fail over. Common responses regarding successful application of the business continuity plans were “it works,” “we used it and we were successful,” and “worked well.”
Two respondents stated that commercial power was restored before they needed to implement their business continuity plans. At one site, a last minute fuel delivery and the unexpected restoration of utility power averted the planned implementation of the business continuity plan.
Some operations implemented business continuity plans to allow employees to remain at home and off the roadways. These employees were not able to come on site because state and local governments restricted roads to emergency personnel only. However, as a result of implementing the business continuity plan, these employees were able to help keep these sites up and running.
Lessons Learned
Three survey questions captured lessons learned, including what worked and what required improvement. The most frequent answer reflected successes in preparation and pre-planning. On the flip side, fuel supply was identified as an area for improvement. It should be noted the Uptime Institute position is to rely only on on-site fuel storage rather than off-site utility or fuel suppliers.
To the question “What is the one thing you would do the same?” the two most frequent responses were
Overwhelmingly, the most significant lesson was that all preparations were valuable. Additional positive lessons included involving staff when planning for disasters and having a sound electrical infrastructure in place. The staff knows its equipment and site. Therefore, if it is involved before a disaster occurs, it can bring ideas to the table that should be included in disaster recovery planning. Such lessons included fuel-related issues, site location, proper protection from severe weather and a range of other issues.
Remote Sites
A number of respondents were able to shift IT loads to remote sites, including sharing IT workload or uptime of cloud service providers. Load shedding of IT services proved effective for some businesses. Having a remote facility able to pick up the IT services can be a costly solution, but the expense may be worth it if the remote facility helps mitigate potential losses due to severe weather or security issues. Companies that could transfer workloads to alternate facilities in non-affected locations experienced this advantage. These cost issues are, of course, business decisions.
One owner listed maintaining an up-to-date IT load shed plan as its most important lesson. Although important, an IT load shed plan can be difficult to prioritize in multiple tenant facilities or when users think their use is the main priority. They don’t always see the bigger picture of a potential loss to the power source.
Staff
At least two respondents explicitly thanked their staffs. Having staff on site or nearby in hotels was critical to maintaining operations, according to almost half of the respondents to that question. It should be understood that riding through a storm requires that the site have appropriate infrastructure and staffing to start with, followed by good preventative maintenance, up-to-date standard operating procedures (SOPs) and disaster recovery plans.
Some businesses had staff from other locations on standby. Once the roadways opened or commercial flights resumed, depending on the location of the standby personnel, remote staff could mobilize on site. One respondent indicated the storm “stretch(ed) our resources” after the third day but nonetheless did not have to bring staff from another site.
One respondent stated that staff was the most important element and knew that local staff would be distracted if their homes and families were without power. Consequently, that company provided staff members with generators to provide essential power to their homes. This consideration allowed staff to either work remotely or be more available for on-site needs. Many such responses show that companies were thinking beyond the obvious or imminent to ensure ongoing operations during the event.
Other Facility Issues
Respondents reported no problems with space cooling equipment (chillers, computer room air handling units, etc.).
Internal Communication
One business reported that it provided a phone number so that occupants could call for status. A Facilities group at another site indicated that IT staff was concerned prior to the storm, but became more comfortable upon seeing the competency of the Facilities staff and its knowledge of the power distribution system, including the levels of backup power, during pre-communication meetings.
What Needed Improvement
“What is the one thing you would do differently?” The majority of respondents stated that they were looking at developing a more robust infrastructure, redundant engine-generator topology, moving infrastructure higher and regularly testing the switchover to engine generators prior to another emergency event. One respondent said that it was reviewing moving a data center farther from downtown Manhattan.
About half the respondents said that they would not do anything differently; their planning was so effective that their sites did not see any impacts. Even though these sites fared well, all sites should continue regular testing and update business continuity plans to ensure contact and other information is current. Improving infrastructure, continuing with proper preventative maintenance and updating contingency plans must continue to achieve the positive results characterized in this survey.
Flooding at the World Trade Center construction site.
Not surprisingly, given the number and significance of fuel supply problems, some respondents indicated that they plan to procure an additional supplier, others plan bring a fuel truck to stay on site in advance of an expected event, and some plan to increase on-site storage. Increasing storage includes modifying and improving the existing fuel oil infrastructure. The Institute advocates that the only reliable fuel supply is what can be controlled at an owner’s site. The owner does not have ultimate control over what a supplier can provide. As seen during Superstorm Sandy, a site is not guaranteed to receive fuel delivery.
Steps taken related to fuel delivery included communicating with fuel suppliers and being on a priority list for delivery. However, in the aftermath of this storm, fire, paramedics, hospitals, medical support, etc., became higher priority. In addition, fuel suppliers had their own issues remaining operational. Some refineries shut down, forcing one facility owner to procure fuel from another state. Some fuel suppliers had to obtain their own engine-generator systems, and one supplier successfully created a gravity system for dispensing fuel. There were also problems with phone systems, making it difficult for suppliers to run their businesses and communicate with customers. One supplier deployed a small engine generator to run the phone system.
Due to lack of control over off-site vendors, the Uptime Institute’s Network Owners Advisory Committee recommendation and the Tier Standard: Topology requirement is a minimum of 12 hours of Concurrently Maintainable fuel to supply N engine generators. Sites susceptible to severe storms (hurricanes, snow, tornados, etc.) are strongly encouraged to store even more fuel. Many sites anticipated the move to engine-generator power and fuel procurement but did not anticipate problems with fuel transport.
Downtown New York City immediately after the storm.
In addition, respondents reported lessons about the location of fuel tanks. Fuel storage tanks or fuel pumps should not be located below grade. As indicated, many areas below grade flooded due to either storm water or pipe damage. At least four engine-generator systems were unable to operate due to this issue. Respondents experiencing this problem plan to move pumps or other engine-generator support equipment to higher locations.
One Facilities staff reported finding sediment in fuel supplies; though, it is unknown if this was due to existing sediment in the bottom of the owner’s tanks or if the contaminants were introduced from the bottom of a fuel supplier’s tank. This facility plans to add fuel filtration systems as a result.
Infrastructure
Many comments centered on the need to increase site infrastructure resiliency with plant additions or by moving equipment to higher ground. Such construction projects would likely be easier to implement outside of dense cities, in which space is at a premium and where construction can be costly. Regardless, these improvements should be analyzed for technical robustness, feasibility and cost implications. One site stated they would be “investigating design of engine-generator plant for sustained runs.”
A few respondents saw a need to move critical facilities away from an area susceptible to a hurricane or flood. While some respondents plan to increase the resiliency of their site infrastructure, they are also evaluating extending the use of existing facilities in other locations to pick up the computing needs durin the emergency response period.
No one expected that water infiltration would have such an impact. Wind speeds were so extreme that building envelopes were not watertight, with water entering buildings through roofing and entryways. And, unusual wind directions caused unexpected problems; one respondent cautioned
“Water can get in the building when the wind blows it uphill. Be ready for it.”
Water especially flooded below grade facilities of all types.
The communication backbone, consisting of network fiber and cable, only had one report of failure within the survey. Regardless, voice system terminal devices did go down due to lack of power or limited battery duration. Sites should consider placing phone systems on engine generator and UPS power.
Load Transfer
Even if sufficient power supply infrastructure exists, equipment must be maintained and periodically tested. Most reports emphasized that regular testing proved valuable. One respondent waited until utility power failed to switch to engine-generator power to preserve fuel.
However, there was risk in waiting if issues arose during load transfer. Load transfer includes engine generators starting, ramping up, and all related controls working properly. One site that did not perform regular testing experienced problems transferring the load to engine generator. That respondent planned to begin regular testing. The failed switchover illustrates the need to perform routine testing. Both complete commissioning after construction and ongoing preventative maintenance and testing are critical.
One comment specifically stated the owner would implement “more thorough testing of the generators and the electrical system overall”; the Uptime Institute considers thorough testing like this a best practice. In addition, fuel supply, fuel distribution piping and other infrastructure should be designed to minimize the possibility of total damage with redundant systems installed in locations far from each other. Therefore, damage in an area might interrupt a single source, rather than both primary and alternate sources.
Planning
Most of the responses identified pre-planning and “tabletop scenario walkthroughs” as keys to providing uptime. Some respondents reported that they needed to update their disaster recovery plans, as IT contacts or roles and responsibilities had changed since the document was published or last revised.
Respondents noted area of improvement for planning and preparation:
A few respondents stated they would work with their utility company to get better communication plans in place. And, one commenter learned to start preparations earlier with storm warnings.
Some respondents said they would plan to add additional staff to the schedule prior to the event, including deploying the Emergency Response Team from another site, after realizing the impact from transportation (ground and flight) issues.
Although most plans anticipated the need to house staff in local hotels, they did not anticipate that some hotels would close. In addition, local staff was limited by road closures and gas stations that closed due to loss of power or depleted supply.
Summary
Full preparedness is not a simple proposition. However, being prepared with a robust infrastructure system, sufficient on-site fuel, available staff and knowledge of past events have proven beneficial in terms of ongoing operations.
When sites lost their IT computing services, it was due largely to either critical infrastructure components being located below grade or by depending on external resources for re-supply of engine-generator fuel—both preventable outcomes.
Solutions include the following:
Though unforeseen issues can arise, the goal is to reduce potential impacts as much as possible. The intent of survey analysis is to share information to assist with that goal.
This video features the author, Debbie Seidman presenting the summary at the Uptime Institute Symposium in 2013
About the Authors
How FORCSS Works: Case Study 1
/in Executive/by Kevin HeslinThis paper launches the Uptime Institute FORCSS Case Study Series and introduces the FORCSS Index
Uptime Institute FORCSS is a means to capture, compare, prioritize, and communicate the benefits, costs, and impacts of multiple IT deployment alternatives. Deployment alternatives may include owned/existing data centers, commercial data centers (wholesale, retail, colocation, managed service), or IaaS (including cloud) that is procured on a scale or limited basis.
FORCSS provides organizations with the flexibility of developing specific responses to varying organizational needs. This case study series will present the process of applying the FORCSS Factors to specific deployment options, and present the outcome of the FORCSS Index—a concise structure that can be understood by ‘non-IT’ executive management.
Each case study will characterize the business needs and requirements; identify the alternatives in consideration; and outline the team, tools, and stakeholders. The case studies will apply the six FORCSS Factors to each alternative. This process will consider the supporting data inputs and various organizational, policy, technology, or other characteristics. Characteristics may influence multiple factors.
This paper elaborates upon Introducing Uptime Institute FORCSS © 2013. In order to empower FORCSS users, Uptime Institute will continue to analyze and publish case studies, in addition to unique tools, guidelines, and research.
FORCSS Index
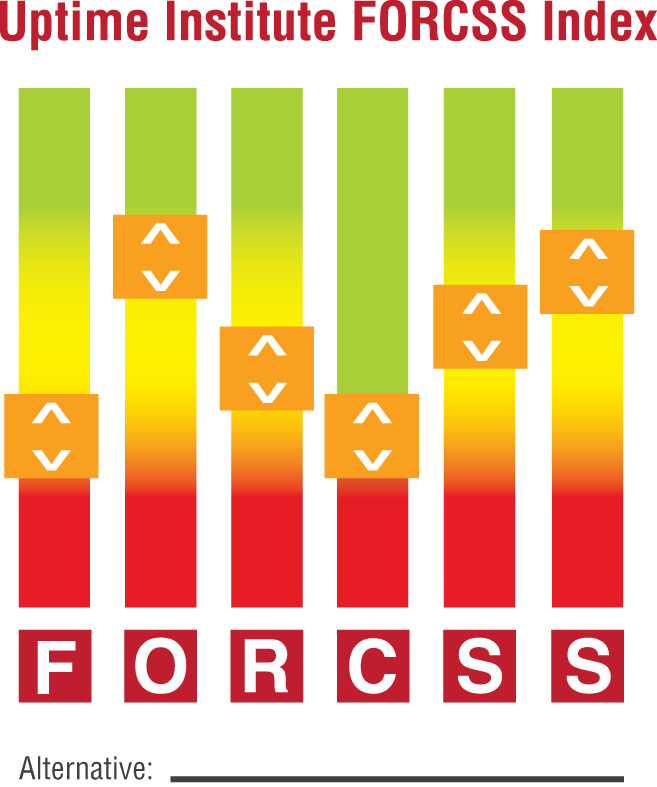 The FORCSS Index is the executive summary presentation tool of a FORCSS process. The Index provides a graphical means to compare the deployment alternatives and the relative impacts of each alternative on each factor. In conversations with senior management, the Index will also facilitate discussions of the weighting of each FORCSS Factor in the ultimate decision.
The indicators may be placed in relative positions (high, medium, low) to reflect the advantages or the exposures within any given factor.
The FORCSS Index effectively compares multiple alternatives at the application or physical layer(s). Organizations executing a FORCSS analysis can populate multiple indexes to compare a range of deployment alternatives.
Certain data inputs may be weighted more heavily than others (positively or negatively) in determining the indicator position for a factor. These special considerations are defined as Key Determinants and are specifically labeled in the FORCSS Index output.
Several data inputs may be used to determine the indicator position for one factor, and one data input may affect the placement of indicators in several factors.
The FORCSS Index is designed as a means of relative comparison of any number of alternatives. Although it would seem that the logical extension of this approach would be to assign numerical scores to each data input for each factor, during FORCSS development numerical scoring was found to add unnecessary complexity which can obscure the key determinants. Scoring can also mislead as the score assigned to one factor can numerically erase the score assigned to another (prohibitive) factor, thereby defeating one of the major benefits of the FORCSS process—identifying the blind spots in the decision-making process.
INTRODUCTION: Case Study 1
This case study was developed in close collaboration with a participant in the FORCSS Charrettes and early adopter of the methodology. Confidential and sensitive information has been withheld.
The case study participant (Enterprise) is a global financial organization offering retail, personal, commercial, and wealth management services to over 12 million customers. The Enterprise is aggressively expanding in terms of both geography and revenue.
Statement of requirements: The business need driving the FORCSS process was a requirement for approximately 10,000 square feet (ft2)of computer room to replace an existing data center. The existing data center shall be vacated due to leasehold terms or the lease extended. The deployment shall be within a specific major metropolitan area of the U.S. (Region). Additionally, the solution shall be operational no later than 14 months from the time the business need was defined (Time Frame). The deployment shall offer high-availability support to a heterogeneous IT environment, with a variety of legacy equipment, from both data center infrastructure and network perspectives (Performance Requirement). There are substantial financial consequences as a result of downtime.
Deployment alternatives: The Enterprise considered a broad range of existing/corporate assets and outsourcing options in terms of the parameters and Region, Time Frame, and Performance Requirement. In this case study, the Enterprise had narrowed its deployment options to three vetted alternatives and focused on the physical/data center layer.
Alternative #1 – Refurbishment: The existing data center was housed in a building constructed in the 1970s. Previously, the Enterprise entered into a sale-leaseback arrangement for the building with an initial lease term expiring in December 2013. The building owner required a minimum 10-year lease extension. The facility is inherently constrained in terms of both computer room footprint (no future expansion opportunities) and density (80 W/ft2). In order to meet the Enterprise’s business need, significant refurbishments would need to be undertaken on the electrical and mechanical infrastructure.
The Enterprise also anticipated that downtime would be incurred during the refurbishment, as well as an extended construction interval in close proximity to operational IT equipment.
Alternative #2 – Build: The enterprise owned a building within the Region that housed a back-office function critical to the business. There was sufficient space in the building to install a robust data center topology. Additionally, there was existing critical equipment (such as backup power) that could be integrated into the new infrastructure. There was no immediate constraint to expansion of the computer room footprint and an anticipated maximum density of 150 W/ft2.
Alternative #3 – Colocation: An outsourcing option within Region had space available and infrastructure installed that met the Performance Requirements. The Colocation was willing to provision available space to suit the Enterprise’s operating characteristics within the Time Frame. The Enterprise further vetted the Colocation as “eager for its business,” which increased confidence in an expedited contracting process, as well as amicable arbitration of any change to configuration. The Colocation offered enhanced physical security characteristics that exceeded Enterprise corporate standards. In the event of expansion, the Colocation could provide proximate space, but not guarantee contiguous space unless the Enterprise leased the undeveloped space (i.e., ‘shell’) immediately at a reduced rate.
Preparing for FORCSS
The Enterprise identified a core team, augmented by additional stakeholders and disciplines, to provide feedback and concurrence before presenting to senior management/decision makers. The Enterprise had many of the internal resources required to fulfill the functions necessary for this FORCSS Case Study. In the event an organization does not have internal resources, a third-party consultant would be contracted to fulfill those functions.
Assemble the Core Team and Tools
FORCSS Leader
and additional stakeholders.
Business/Finance
Computer Room Master Plan (CRMP) Team
Operations
This function reviewed the ongoing operations strategy for potential efficiencies of internal and outsourced staff, as well as assurance of staffing and expertise in accordance with the Performance Requirements.
Involve Additional Stakeholders
Additional Stakeholders may identify a key differentiator with significant influence on one or more of the FORCSS Factors. The Enterprise identified the following.
Other Corporate Requirements & Projects
determined that, if the two projects were joined together, the hardening would be achieved in a more efficient and less costly manner than if undertaken on its own. Result: Notable influence on the Build alternative.
Environmental
Procurement/Sourcing
Insurance
Risk/Compliance
Early Engagement of Decision Maker
Populating the FORCSS Index
The following section will elaborate on how the Enterprise considered each factor across the deployment alternatives.
Key Determinant: Comparative Cost of Ownership
Financial (Net Revenue Impact, Comparative Cost of Ownership, Cash and Funding Commitment)
As a large financial institution, capital was readily available to support the Refurbishment and Build alternatives. Also, business need did not necessitate a Net Revenue Impact analysis as the IT function was previously established as critical. These characteristic of the Enterprise increased focus on life-cycle costs and asset value. These illustrations show the financial analysis conducted by the Enterprise.
Alternative #1 – Refurbishment: Existing facilities infrastructure (power distribution, UPS, and mechanical systems) are substantially beyond the manufacturers’ recommended usable life and require significant investment to sustain operations in this location. This alternative has significant near-term (capital) and ongoing (10-year minimum lease) commitments and shortened depreciation term. (Indexed lowest)
Alternative #2 – Build: Constructing a purpose-built computer room in existing facility required capital investment but no lease obligation. Also, ownership allowed full depreciation cycle over the full life cycle of the project. (Indexed highest)
Alternative #3 – Colocation: This alternative offered the least near-term financial commitment but an ongoing and increasing expense over the life cycle of the data center. The Enterprise also considered, but did not quantify, a potential significant exit cost from the Colocation. (Indexed middle)
Key Determinant: Business Leverage and Synergy
Opportunity (Time to Value, Scalable Capacity, Business Leverage and Synergy)
During the FORCSS process, the Enterprise vetted all alternatives against binary criteria (e.g., 14-month Time Frame, location within Region). Alternatives that did not meet these criteria were eliminated.
Alternative #1 – Refurbishment: This alternative is constrained in both area and maximum density of 50 W/ft2 due to building characteristics. Also, cabling infrastructure is unable to adhere to the Enterprise’s deployment standards. (Indexed lowest)
Alternative #2 – Build: This alternative has a density limit of 200 W/ft2, with 8,000 ft2 it satisfies both area and density requirements. This alternative provides a business synergy—building out the backup power systems addresses a business continuity need for the back-office function. (Indexed highest)
Alternative #3 – Colocation: This alternative is fastest to Value (6 months versus 12 months for Alternative #2). It also provides the most scalability—with the option to lease contiguous space at a reduced rate from the provider, and proximate space available without the additional lease option. (Indexed middle)
Key Determinant: Cost of Downtime vs. Availability
Risk (Cost of Downtime vs. Availability, Acceptable Security Assessment, Supplier Flexibility)
Alternative #1 – Refurbishment: This alternative has a high risk of service disruption during the construction phase. Also, the location of this facility is near a potential terrorist target and is in a flood plain. (Indexed lowest)
Alternative #2 – Build: This alternative has no risk associated with construction and will be under corporate control of the Enterprise. (Indexed highest)
Alternative #3 – Colocation: The Colocation provider has proven competence in the industry, and higher physical security than the Enterprise’s requirements. The Colocation also demonstrated a desire to work with the Enterprise. Nonetheless, an outsourced provider introduces some management risk. (Indexed middle)
Key Determinant: None, due to thorough due diligence
Compliance (Government Mandates, Corporate Policies, Compliance & Certifications to Industry Standards)
Due to a Property Risk competency readily available to the FORCSS Team Leader, compliance issues for each alternative were vetted prior to FORCSS exercise.
Alternative #1 – Refurbishment: Meets all requirements. (Indexed high)
Alternative #2 – Build: Meets all requirements. (Indexed high)
Alternative #3 – Colocation: Meets all requirements. (Indexed high)
Key Determinant: None
Sustainability (Carbon and Water Impact, Green Compliance & Certifications, PUE Reporting)
The business need was composed of a mix of legacy hardware, with diverse infrastructure requirements. While adhering to industry best practices for efficiency, the Enterprise requires an energy-intensive operation regardless of the deployment alternative, (i.e., equipment had to be manufactured, construction undertaken). Also, the alternatives shared the same power provider, with no differentiation for source. The Enterprise purchases carbon offsets to meet corporate sustainability goals, and the LEED facility was noted in the exercise, but sustainability was not a major factor in this decision.
Alternative #1 – Refurbishment: Meets requirements. (Indexed middle)
Alternative #2 – Build: The site is a LEED Certified Facility. (Indexed highest)
Alternative #3 – Colocation: Meets requirements. (Indexed middle)
Key Determinant: None, due to thorough due diligence
Service Quality (Application Availability, Application Performance, End-User Satisfaction)
Prior to the FORCSS process, the Enterprise vetted the network capabilities. All alternatives were in a close geographic area, without latency issues. And, deployment of an established suite of applications minimized concerns about End-User Satisfaction.
Alternative #1 – Refurbishment: Meets all requirements. (Indexed high)
Alternative #2 – Build: Meets all requirements. (Indexed high)
Alternative #3 – Colocation: Meets all requirements. (Indexed high)
Consolidated FORCSS Index
This display provides a view of the three deployment alternatives side-by-side. Notes within each indicator were withheld to offer a holistic, comparative view of the values.
Outcome: Based on this FORCSS exercise, the Build (Alternative #2) best met the business requirements.
Insight from FORCSS Leader
Our organization has historically tried to self-provision first. But, the doors have opened up. The IT departments aren’t holding onto hardware anymore, and the shorter time lines are having a huge impact on how we respond. You have to pick projects that you can do better, and you have to be ready to let go of things you can’t do fast enough. Most builds will take longer than buying the service. An IT organization isn’t linear anymore. There are multiple stakeholders who have different influences and different impacts on decisions. If you’re not thinking 3 to 5 years out, an enterprise organization won’t be to be able to respond to the business demand.
Quantifying the opportunity is a difficult, but important, aspect of the FORCSS process. One of the biggest considerations in this decision was the business synergy [providing business continuity infrastructure for an adjacent back-office function], documented in the Opportunity section. You have to be well connected across your organization or you will miss Opportunity. The IT department did not know or care about the back office getting power—they wanted a new computer room. But, the business side determined the continuity benefit was compelling.
Figure 1. Generated by Enterprise and adjusted to remove sensitive information.
Vetting a multi-tenant data center provider required due diligence. We attended site tours to review infrastructure they had provisioned before. We had them provide single-lines of how the infrastructure would look. We got as close to apples-to-apples as we could get, down to cabinet layout of the room. We had three detailed meetings where my engineering and operations teams sat down with the colocation fulfillment team.
One of the biggest risks of an outsourcer is not about the immediate contract, but about how you deal with change going forward. How do you handle change, like a new business opportunity, that isn’t in the contracts? How do you deal with non-linear growth? We never got to the point of pulling the trigger, but had a frank discussion with our board about risk associated with outsourcing and they were comfortable with the alternative.
The Board ultimately funded the Build option. I believe that our FORCSS process was successful with decision makers due to the thoroughness of our preparation. Upper management questions were limited to site characteristics (such as industry best practices for physical security), but nothing that challenged any of our fundamentals.
For today’s enterprise, speed is key: speed of decision making; speed of deployment. In this environment, the decision-making methodology must be credible and consistent and timely. We adopted FORCSS because it was thorough, independent, and industry accepted.
Julian Kudrizki
Julian Kudritzki and Matt Stansberry wrote this article, which originally appeared in Volume 3 of The Uptime Institute Journal, May 2014. Julian Kudritzki joined the Uptime Institute in 2004 and currently serves as Chief Operating Officer. He is responsible for the global proliferation of Uptime Institute Standards. He has supported the founding of Uptime Institute offices in numerous regions, including Brasil, Russia, and North Asia. He has collaborated on the development of numerous Uptime Institute publications, education programs, and unique initiatives such as Server Roundup and FORCSS. He is based in Seattle, WA.
Matt Stansberry
Matt Stansberry is director of Content and Publications for the Uptime Institute and also serves as program director for the Uptime Institute Symposium, an annual spring event that brings together 1,500 stakeholders in enterprise IT, data center facilities, and corporate real estate to deal with the critical issues surrounding enterprise computing. He was formerly Editorial Director for Tech Target’s Data Center and Virtualization media group, and was managing editor of Today’s Facility Manager magazine. He has reported on the convergence of IT and Facilities for more than a decade.
Implementing Data Center Cooling Best Practices
/in Operations/by Kevin HeslinStep-by-step guide to data center cooling best practices will help data center managers take greater advantage of the energy savings opportunities available while providing improved cooling of IT systems
The nature of data center temperature management underwent a dramatic evolution when American Society of Heating, Refrigeration, and Air-conditioning Engineers (ASHRAE) adopted new operating temperature guidelines. A range of higher intake temperatures at the IT devices has enabled substantial increases in computer room temperatures and the ability to cool using a range of ‘free cooling’ options. However, recent Uptime Institute research has demonstrated that the practices used in computer rooms to manage basic airflow and the actual adoption of increased temperatures have not kept pace with the early adopters or even the established best practices. This gap means that many site operations teams are not only missing an opportunity to reduce energy consumption but also to demonstrate to executive management that the site operations team is keeping up with the industry’s best practices.
The purpose of this technical paper is to raise awareness of the relatively simple steps that can be implemented to reduce the cost of cooling a computer room. The engineering underlying these simple steps was contained in two Uptime Institute papers. The first, Reducing Bypass Airflow is Essential for Eliminating Computer Room Hotspots, published in 2004, contained substantial research demonstrating the poor practices common in the industry. In a nutshell, the cooling capacity of the units found operating in a large sample of data centers was 2.6 times what was required to meet the IT requirement, well beyond any reasonable level of redundant capacity. In addition, an average of only 40% of the cooling air supplied to the data centers studies was used for cooling IT equipment. The remaining 60% was effectively wasted capacity, required because of mismanagement of the airflow and cooling capacity.
Uptime Institute’s subsequent paper, How to Meet ‘24 by Forever’ Cooling Demands of Your Data Center was published in 2005. This paper contained 27 recommendations that were offered to remedy air management and over capacity conditions.
New research by Upsite Technologies®, which also sponsored research leading to the Uptime Institute’s 2004 publication on bypass airflow, found that the average ratio of operating nameplate cooling capacity in use in a newer, separate and significantly larger sample had increased from 2.6 to 3.9 times the IT requirement. Clearly, the data are still relevant and, disturbingly, this trend is going the wrong direction.
The 2013 Uptime Institute user survey (see p. 108), consisting of 1,000 respondents, found some interesting and conflicting responses. Between 50 and 71% (this varied by geography) reported that it was ‘very important’ to reduce data center energy consumption. Yet, 80% (up from 71% in 2012) indicated the electrical costs are paid by real estate, and therefore, generally not readily available to the IT decision makers when specifying equipment. Most strikingly, 43% (unchanged from 2012) use cooling air below 70°F/21°C, and 3% more (down from 6% in 2012) did not know what the temperatures were. More than half (57%) were using overall room air or return air temperatures to control cooling. These are the two least effective control points.
There is fundamental conflict between the desire to reduce operational expense (OPEX) and the lack of implementation of higher cooling temperatures and the resulting benefits. The goal of this paper is to give data center managers the tools to reduce the mechanical cooling power consumption through more efficient use of cooling units. Improving airflow management will allow for elevated return air temperatures and a larger ΔT across the cooling unit resulting in increased capacity of the cooling unit. This allows for the cooling to be performed by fewer cooling units to reduce mechanical energy consumption. Further cooling system best practices are discussed, including transition to supply air control, increasing chilled water temperatures, and refurbishment or replacement of fixed speed cooling units with variable speed capability.
Uptime Institute has consistently found that many site managers are waiting for the ‘next big breakthrough’ before springing into action. The dramatic OPEX, subsequent environmental and cooling stability benefits of improved cooling air management, increased operating temperatures, variable speed cooling fans and other best practices are not being exploited by the data center industry at large.
In some cases, managers are overwhelmed by engineering speak and lack a straightforward guideline. This technical paper is designed to assist site managers with a simple high-level guide to implement these best practices quickly and successfully, and includes some straightforward metrics to get the attention of the leadership team. One such metric is the ratio of operating cooling capacity in the computer room vs. the cooling load in the computer room, which is a simple, but effective, way to identify stranded capacity and unnecessary operation of cooling units.
This paper lists 29 steps intended to focus effort on reducing the cost of cooling. Select actions may require the involvement of consultants, engineers or vendors. The first 17 steps have been divided into two groups, one called Preparatory Metrics and the other Initial Action to Manage Airflow.
Taking these steps will establish a baseline to measure the program’s effectiveness and to ensure proper airflow management. Three sets of subsequent actions describe will describe 12 steps for reducing the number of cooling units, raising temperatures in the computer room and measuring the effectiveness of these actions. The third set of actions will also set the stage driving continuous improvement in the facility.
Reductions in the cost of cooling can be achieved without any capital investment: none of the 29 actions in this paper require capital! Additional energy-efficient actions are also described but will require a more comprehensive approach, often involving engineering design and potentially capital investment. Other benefits will be realized when the cost of cooling is reduced. Correcting air management reduces hot spots, and taking cooling units off line can reduce maintenance costs.
Preparatory Metrics.
This first group of steps captures the basic data collection necessary to capture the operating status of the computer room for later comparison. It is essential that this be the first group of steps as these metrics will provide the basis for reporting later success in reducing energy consumption and reducing or eliminating hot spots. Develop the work plan covering the proposed changes.
Initial Action to Manage Airflow.
The second group of steps guides step-by-step actions to rearrange existing perforated tiles and close bypass airflow openings such as cable holes and the face of the rack. Proper air management is necessary before changing the temperature in the computer room.
Selectively, some groups of steps can be done on a common initiative depending on how a particular project is being implemented. The approach in this paper is intentionally conservative.
Limitations and Conditions
Implementing change in any critical environment must be done carefully. It is important to develop and coordinate with IT a detailed site plan to supplement the 29 steps from this technical paper; this is a critical requirement for any site concerned with availability, stability and continuity of service. Retain appropriate consultants, engineers or contractors as necessary to completely understand proposed changes, especially with the physical cooling equipment changes outlined in Additional Advanced Energy Efficient Actions.
Because of air-cooling density limitations, higher density equipment may need to be supplemented with localized cooling solutions, direct liquid cooling or other innovations such as extraction hoods or chimneys. Traditionally, the cap for all ‘air cooling ’ was a power density of 7 kilowatts (kw) per rack, and that was only possible when all established best practices were being followed. Failure to follow best practices can lead to problems cooling even two kilowatt racks.
Experience shows that consistent and complete adoption of the steps in this technical paper enables successful cooling of server racks and other IT equipment at higher densities. Sites that excel at the adoption of these practices, sometimes coupled with commonly available technologies, can successfully air cool racks exceeding 10 kW (see Case Study 2). Other contemporary examples have successfully applied air cooling to even higher densities.
For sites with rack densities greater than 6 kW per rack, the Uptime Institute recommends Continuous Cooling. Continuous Cooling is where the computer room heat removal is uninterrupted during the transition from utility power to engine generator power. This is the direct analogy to uninterrupted power to the IT equipment. This recommendation is based on multiple recorded temperature excursions in the industry where the temperature and the rate of change of the temperature both exceed ASHRAE guidelines. In one case, a computer room with 250 racks at 6 kW went from 72°F to 90+°F (22°C to 32+°C) in 75 seconds when the cooling was lost.
Increasing the operating temperature of a computer room may shorten the ridethrough time for a momentary loss of cooling. Real-event experience, however, suggests the change in the ride-through time will be seconds, not minutes or hours. This explanation, which is often cited for not raising the operating temperature, is not based on fact.
ASHRAE Temperature Guidelines
Current ASHRAE TC 9.9 publications can be obtained at http://tc99.ashraetcs.org/documents.html. The TC9.9 publications should be fully understood before selecting a higher operating temperature. The ability of legacy or heritage equipment to operate in the newer temperature ranges should be validated by the IT team.
Cold Aisle/Hot Aisle
The physical arrangement of the IT equipment into what is known as Cold Aisle/Hot Aisle is another best practice. This configuration places the intake of IT equipment on the Cold (supply) Aisle and the discharge of warmer air toward the Hot (return) Aisle. Current practices permit most computer rooms to use 75°F/24°C supply in the Cold Aisle, understanding that the only temperature that matters in a computer room is the air at the intake to the computer hardware. The Hot Aisle will be substantially warmer. Noticing dramatically different temperatures while walking through a computer room with Cold Aisles/Hot Aisles is a demonstration of successful implementation and operating practices.
Proper adoption of Cold Aisle/Hot Aisle methodology improves the stability and predictability of cooling and is a key step to minimizing the mixing of hot and cold air. However, an existing legacy computer room that does not utilize a Cold Aisle/Hot Aisle configuration can still benefit from improved airflow management. Perforated floor tiles providing raised-floor cooling air should be placed immediately adjacent to the front of the rack they are cooling. Temperatures in a legacy environment will not be as distinctive as in a Cold Aisle/Hot Aisle environment, and extra caution is required when implementing these best practices. Additional check points should be added to ensure that undesired temperature increases are identified and quickly addressed during the rearrangement of floor tiles.
For maximum benefit, a strategic computer room master plan should be developed. This master plan will identify the arrangement of the rows of IT equipment, the positions in rows or the room for power support equipment, and the number and arrangement of the cooling units to support the ultimate capacity of the space. The master plan also reserves locations for IT, power and cooling equipment that may not be installed for some time, so that when the equipment is required, there is not a crisis to determine where to install it; it is preplanned. A computer room master plan is of value for a new room or reconfiguring an existing room.
29 Cooling Best Practices
Group one: Preparatory metrics
1. Determine the IT load in kilowatts.
2. Measure the intake temperature across the data center, including where hot spots have been experienced. At a minimum, record the temperature at mid-height at the end of each row of racks and at the top of a rack in the center of each row. Record locations, temperatures and time/date manually or using an automated system. These data will be used later as a point of comparison.
3. Measure the power draw to operate the cooling units in kilowatts. Often, there is a dedicated panel serving these devices. This may be accessible from a monitoring system. These data will be used later as a point of comparison and calculation of kilowatt-hours and long-term cost savings.
4. Measure the room’s sensible cooling load as found. This can be done by measuring the airflow volume for each cooling unit and recording the supply and return temperatures for each unit that is running. The sensible capacity of each operating unit in kW for each unit can be calculated using the expression Q sensible (kW) = 0.316*CFM*(Return Temp°F – Supply Temp°F)/1000 [Q sensible (kW) = 1.21*CMH*(Return Temp°C – Supply Temp°C)/3600]
The room’s sensible load is the sum of each cooling unit running in the room. Organize the data in a spreadsheet or similar tool to record each data point, supply and return temperature, ΔT (return-supply), airflow, kilowatt sensible and sum to provide overall room sensible load. Confirm that entire IT load is being serviced by the cooling system, that there is not additional IT load in another room and that the cooling plant is not supporting any non-IT load.
Compare the cooling load to the IT load for a point of reference.
5. Using the airflow and return air temperature measured in the previous step, request the sensible capacity of each unit in kilowatts from the equipment vendor. Enter this nominal sensible capacity in the spreadsheet. Sum the sensible capacity for the units that are operating. This is a quick and easy approximation of the sensible-cooling capacity of the cooling units in use. More complex methods are available but were not included here for simplicity.
6. Divide the overall room operating cooling sensible capacity in kilowatts determined in previous step by the sensible operating cooling load determined in Step 4. This number presents a simple ratio of operating capacity versus cooling load. The ratio could be as low as 1.15 (where the cooling capacity matches IT load with one cooling unit in six redundant), but will likely be much higher. This ratio is a benchmark to evaluate subsequent improvement as reduction of this ratio will occur with the reduction of operating cooling units.
7. Cooperatively with IT, determine the maximum allowable intake temperature for the new operating environment. For temperatures above 75°F, there may be offsetting power increases within the IT devices from their onboard cooling fans.
8. Using the data developed above, create a work plan outlining goals of the effort, detail the metrics that will be monitored to ensure the cooling environment is not disrupted, specify a back-out plan should a problem be discovered and identify the performance metrics that will be tracked for rack inlet temperatures, power consumption, etc. This plan should be fully communicated with IT as a key member of the critical operations team.
Group two: Initial action to manage airflow
9. Relocate all raised-floor perforated tiles to the Cold Aisle. Replace perforated tile supporting a given rack should be placed immediately in front of the rack. As a starting baseline, each rack with IT equipment producing cooling load should have a single perforated floor tile in front of it. Empty racks and racks with no electrical load should have a solid tile in front of them. Give special consideration to racks populated with network equipment like switches or patch panels.
10. If a return air plenum is used, ensure that the placement of ceiling return grilles aligns with the Hot Aisles.
11. Seal the vertical front of the racks using blanking plates or other systems to prevent Cold Aisle air from moving through the empty rack positions into the Hot Aisle.
12. Seal the cable holes in raised floor, if used.
13. Seal any holes in the walls or structure surrounding the computer room. Check walls below the raised floor and above the ceiling. Check for unsealed openings in the structure under or over the computer room. Typical issues are found where conduits, cables or pipes enter the computer room.
14. Seal any supply air leakage around the cooling units, if they are located in the computer room.
15. Ensure that all cooling units in the space are equipped with a backflow damper or fabricate covers for units designated as off to prevent backflow of cooling through powered-off cooling units.
16. Seal any leakage of cooling air at power distribution units, distribution panels or other electrical devices mounted on the raised floor.
17. Record the temperatures at the same locations as in Step 2. Compare this and prior readings to determine if any intake temperatures have increased. If an increase is observed, increase airflow to the problem rack by moving a raised-floor perforated tile from an area that does not have any hot spots or by replacing the standard perforated floor tile with a higher flow rate perforated floor tile.
Subsequent action one: Reducing the number of operating cooling units by shutting units off.
18. Identify the cooling units with the lowest sensible load. These units will be the first units to be turned off as the following process is implemented.
19. Estimate the number of required cooling units by dividing the IT load by the smallest sensible cooling unit capacity. This will approximate the number of cooling units needed to support the IT load.
20. Uptime Institute recommends redundancy in large computer rooms of 1 redundant unit for every six cooling units. Smaller or oddly shaped rooms may require a higher level of redundancy. Divide the required number of cooling units by six to determine the number of redundant cooling units. Round up to the next higher whole number. This is the suggested number of redundant cooling units for the IT load.
21. Add the results of the two previous steps. This will be the desired number of cooling units necessary to operate to meet the IT load and provide 1:6 redundant cooling units. This should be fewer than the total number of cooling units installed.
22. Turn off one operating cooling unit each week until only the desired number of cooling units determined in the previous step remains operating.
23. With each ‘excess’ cooling unit being shut off, examine reducing the number of perforated tiles to match the reduced airflow being supplied to the room. If a temperature increase is observed, increase airflow to the problem rack by adding perforated floor tiles or utilizing higher flow rate perforated floor tiles. The placement of floor tiles to appropriately match cooling supply is an iterative process.
24. Before each subsequent reduction in the number of operating cooling units, record the temperatures at the same locations as in Step 2. Compare this and prior readings to determine if any server intake temperatures have increased. If an increase is observed, increase airflow to the problem rack by moving a perforated tile from an area that does not have any hot spots.
25. When the desired number of units has been reached, record the power draw for the cooling units as in Step 3. This may be possible through existing monitoring. Compare the before and after to observe the reduction in power draw.
Subsequent action two: Raising the temperature in the computer room.
26. Increase the temperature set point on each cooling unit one or two degrees a week until the server intake air is at the desired level, for example the highest server intake temperature is 75°F/24°C. To accomplish this faster, a greater rate of change should be discussed with and agreed to by the data center integrated operations team. (Note: this step can be completed regardless of whether the cooling unit uses supply or return air control. If the unit has return air control, the set point will seem quite high, but the supply air will be in the acceptable range.)
27. Before each subsequent increase in set point temperature, record the temperatures at the same locations as in Step 2. Compare this and prior readings to determine if any server intake temperatures have increased. If an increase is observed, increase airflow to the problem rack by moving a perforated tile from an area that does not have any hot spots.
Subsequent action three: Review and report metrics.
28. Re-create the preparatory metrics from Steps 1-6 and compare to the original values. This includes the following metrics:
29. Calculate the overall power savings based on the implemented measures and estimate annual operations savings based upon kilowatt-hours reduced and the average cost of power. Report the progress to the integrated data center operations team.
Additional Advanced Energy-Efficient Actions
There are additional measures, which can be taken in order to further increase the overall efficiency of the cooling systems supporting the data center, including implementing variable speed/frequency fan drives, utilizing supply air control and increasing the chilled-water temperature where chilled-water systems are utilized. These measures, while requiring increased engineering study and operational awareness prior to implementation, can continue to lower the amount of electricity required for the cooling plant, while simultaneously maintaining a more consistent ambient environment in the data center.
Implementing supply air control
Supply air control typically requires the addition of supply air temperature sensors, as legacy air conditioners are typically not equipped with these devices. The supply air sensors will be the modulation control point for the units to ensure a consistent supply air temperature for the data center.
Most legacy data centers are still utilizing standard return air control methodologies. However, data centers with supply air control methods are realizing two important benefits. First, in conjunction with good airflow management practices, supply air control guarantees a consistent inlet air temperature through all cold aisles in the data center. Second, it reduces the importance of the ΔT of the air handlers. Data centers utilizing return air control are forced to use an artificially low return air set point in order to guarantee that the cold aisle temperatures do not exceed their normal design temperature. But, this is not an issue for data centers utilizing supply air control.
Considerations
Supply air control typically reacts much faster than return air control, so there is the possibility of increased ‘hunting ’ to find the set point. Often, implementing supply air control requires modification of the control algorithms that the units use to modulate cooling. This should be done in close concert with the original equipment manufacturer (OEM).
This control scheme should use an adjustable set point for supply air, and additionally there should not be any automatic reset on the desired supply air temperature. The objective is to have all underfloor air at the same temperature.
Figure 2. The power consumption of a fan is a function of the cube of the fan speed.
Implementing variable speed fan drives
Since the power consumption of a fan is a function of the cube of the fan speed, operating additional variable speed cooling units or fans will further reduce power consumption (see Figure 2). This can be accomplished by retrofitting any constant speed cooling fans to variable speed or by replacing legacy units with new units with built in variable speed capability. Implementing variable speed fan drives will require close interaction with the OEM of the cooling units, and possibly, other assistance, depending on the qualifications of the facility staff.
Considerations
There are various ways of controlling the variable speed fans of the cooling units, but the most common is the use of underfloor static pressure. A less consistently applied control method is controlling variable speed fans based on temperature sensors within the cold aisle. Static pressure can be difficult to measure accurately.
Therefore, it is a good practice to have groups or even all units operating at the same speed. This helps to ensure that units are not constantly fighting each other and excessively modulating to maintain the set point.
As a best practice, the implementation of variable speed fan drives should not be done without prior installation of supply air control on the cooling units. Using variable speed fan drives in conjunction with return air control can lead to lower temperature differentials (ΔT’s), which can in turn lead to increased Cold Aisle temperatures, potentially even above the desired limit. To alleviate this issue, the return air set point has to be reduced, thereby defeating the potential savings realized by implementing the variable speed fan drives.
Using variable speed fan drives will typically change the airflow characteristics of the room. Therefore, it is important to monitor temperatures at the inlet of the IT devices. If higher temperatures are observed, perforated floor tile type and location may need modification.
Increasing Chilled Water Temperature
A chilled water system is one of the largest single facility power consumers in the data center. Raising the air handler temperature set point provides the opportunity to increase the temperature of the chilled water and further reduce energy consumption. Typical legacy data centers have chilled water set points between 42-45°F (6-7°C). Facilities that have gone through optimization of their cooling systems have successfully raised their chilled water temperatures to 50°F (10°C) or higher.
Considerations
The maximum allowable chilled water temperature will be based on the performance capabilities of both the chiller and the air handler units. Therefore, it is imperative to work in close contact with both the chiller and air handler unit OEMs to ensure that the chilled water temperature can be increased without impacting the data center. Increasing the chilled water temperature will have an impact on the capacity of the cooling units and should be implemented very slowly, potentially only increasing the set point by a single degree per week.
Some facilities require colder chilled water temperature in order to dehumidify the air in the data center. An engineering analysis should be performed to determine whether or not a low chilled water temperature is required for dehumidification processes. The savings from implementing higher chilled water temperatures can be so great that investigating alternative dehumidification methods may be warranted.
Case Study 1: How NOT to implement changes in a computer room.
A mechanical system diagnostic assessment was performed for a confidential client’s global support data center’s 40,000-ft2 (3,700-m2) computer room with over 70 chilled-water cooling units. Only 35 units (including redundancy) were required to keep the room cool. Upon receiving the preliminary study, the facility staff began turning cooling units off in a random and unplanned manner and without communicating with IT. Within five minutes, critical computer and storage equipment had shut down, interrupting the mission-critical computing (internal protective sensors that had sensed high temperatures automatically shut down some of the hardware). IT management, which was not aware of the initiative to reduce energy use, immediately demanded all cooling units be turned back on and the hot spots went away. After this very unpleasant experience, no further attempts were made at cooling optimization.
The failed attempt to reduce facility energy consumption outlined in this case study illustrates the necessity of making changes in a computer environment in a methodical, planned and well communicated way. Purposefully implementing the best practices established by Uptime Institute research can be done with great success if done in a prudent manner with the involvement and support of IT management.
Case Study 2: Overcoming legacy capabilities in a 20-year-old data center.
Designed for less than 2 kW per rack, Agriculture and Agri-Food Canada (AAFC)’s 20-year old data center was updated to successfully support multiple 10-kW racks using only air cooling. Best practices were followed for managing airflow, including selective use of hot-air containment and extraction technology. The temperatures in the room stabilized and previous hot spots were eliminated, in addition to supporting racks of a dramatically higher density than previously envisioned. This project earned AAFC and Opengate a 2011 GEIT award winner in the Outstanding Facilities Product in a User Deployment category. In addition, Opengate made the project the subject of a 2012 Symposium Technology Innovation presentation.
Case Study 3: A 40-year-old data center updates fan monitoring and controls to reduce fan energy consumption by 24%.
Lawrence Berkeley National Laboratories (a 2013 GEIT Finalist) used variable- speed controls to slow fan speeds. Since fan energy consumption is a function of the cube of fan speed, slowing down the fans brings an immediate and measurable reduction in energy consumption. This implementation used available technology and was performed after best practices in air management were met.
About the Authors
Uptime Institute Professional Services (UIPS), previously known as ComputerSite Engineering, Inc. Uptime Institute includes UIPS, the Institute Uptime Network, a peer group of over 100 data center owners and operators in North America, EMEA, Latin America, and Asia Pacific, as well as the Uptime Institute Symposium, a major annual international conference. Uptime Institute is an independent operating unit of The 451 Group.
Before joining Uptime Institute, Mr.Turner was with Pacific Bell, now AT&T, for more than 20 years in their corporate real estate group, where he held a wide variety of leadership positions in real estate property management, major construction projects, capital project justification and capital budget management. He has a BS Mechanical Engineering from UC Davis and an MBA with honors in Management from Golden Gate University in San Francisco. He is a registered professional engineer in several states. He travels extensively and is a school-trained chef.
Code mandates for data center operations
/in Operations/by Matt StansberryData center operations and management are increasingly the target of codes that impact safety, communications, and economic systems. Going well beyond the guidelines laid out by NFPA 75 and 76, the new 2011 National Electrical Code (NFPA 70) actually provides for regulatory oversight of mission-critical facility management. This video will provide a history of codes as they apply to data centers, and a strategy for answering and implementing code provisions to avoid problems with inspectors.
This video, shot at Uptime Institute Symposium 2013, features Richard L Sawyer, Global Strategist, HP Critical Facilities Services.
Server Decommissioning as a Discipline: Paul Nally, Barclays
/in Operations/by Matt StansberryIn 2013, Barclays removed 9,124 physical servers from its data centers globally, winning Uptime Institute’s Server Roundup competition for the second year running. This effort is part of a server footprint reduction across the entire company. The organization reaped significant cost benefits, but this project has also reduced risk and complexity, providing Barclays’ internal IT customers better uptime, and positions these teams to get either on to, or ready for, next-generation solutions like cloud.
The direct cost benefit of this effort sells itself, but the lasting legacy of the server reduction program at Barclays will be the benefits of getting off technologies that are holding the business back, and replacing them with IT services that are more future-friendly.
This keynote video from Uptime Institute Symposium 2014 will provide you with a roadmap for starting your own server decommissioning project.