
What does embedded carbon of IT really represent?
Due to regulatory mandates and expanded stakeholder expectations, a growing share of operators are quantifying and publicly reporting a complete carbon dioxide equivalent (CO2e) emissions inventory for their data center infrastructure. An organization’s direct on-site emissions (classified as Scope 1 according to the Greenhouse Gas Protocol) and emissions from purchased energy sources (classified as Scope 2) are relatively easy to calculate from measured operational facility data and available grid emissions factors.
In contrast, Scope 3 data (comprising indirect emissions from the activities of other organizations and individuals) is more challenging to gather and has a high degree of uncertainty. This is because Scope 3 represents the Scope 1 and 2 emissions of both upstream suppliers and downstream buyers, which can be up to five layers deep in the value chain. By definition, this includes potentially millions of product users scattered around the globe. Despite the challenges, data center operators need to establish processes to collect and quantify their Scope 3 emissions while recognizing both the inherent uncertainty in the data and the limited levels of control over said emissions.
Carbon emissions (shorthand for CO2e greenhouse gases) embedded in IT equipment are an important Scope 3 category for IT infrastructure operators. The most valuable data is collected from manufacturers because they have the best insight into and connections with their supply chains. Where manufacturers do not supply the data, publicly available databases and proprietary estimation tools are useful for looking up or calculating embedded carbon values for IT equipment.
IT original equipment manufacturers (OEMs) can provide product carbon footprint (PCF) reports of typical configurations for some or all their machine models. These reports combine embedded carbon estimates from the product’s manufacture and transportation to the customer along with estimates of use emissions (Scope 2) and emissions associated with the management of end-of-life equipment (a separate Scope 3 category). The “manufacturing” and “transport” emissions categories are the most relevant for reporting embedded emissions from IT equipment. Tables 1a and Table 1b give select examples of PCF reports by some of the major OEMs.
Table 1a. Example server configurations from different manufacturers
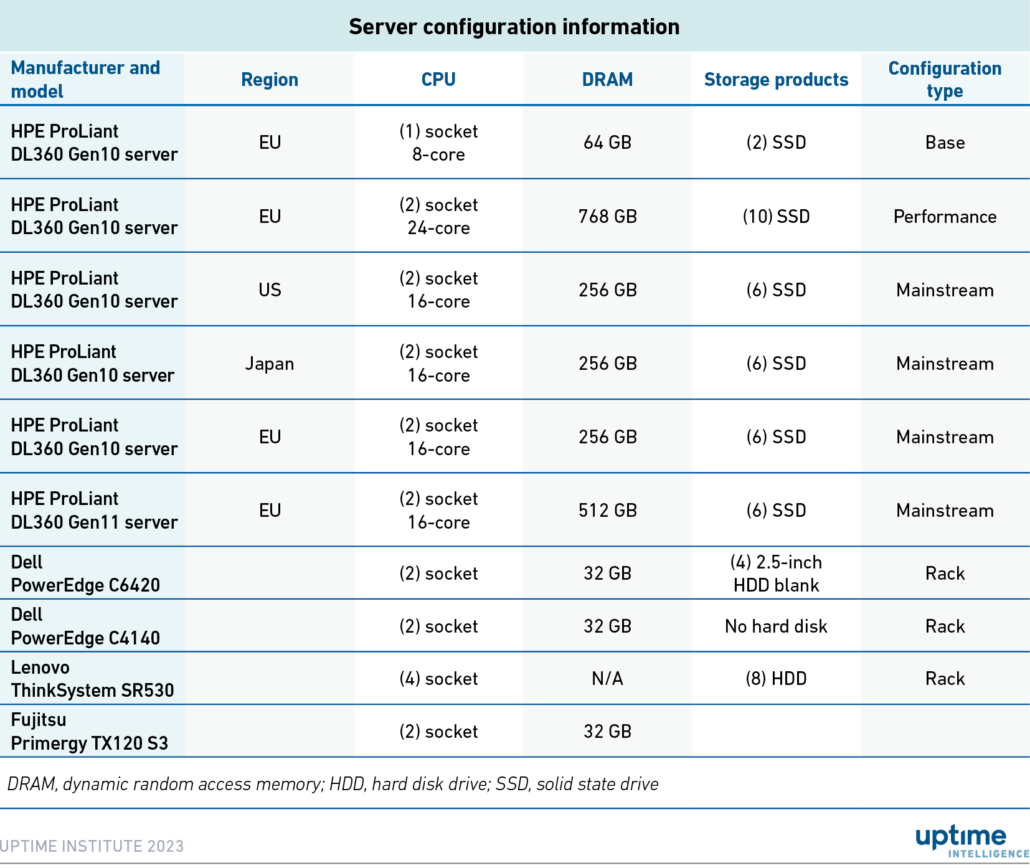
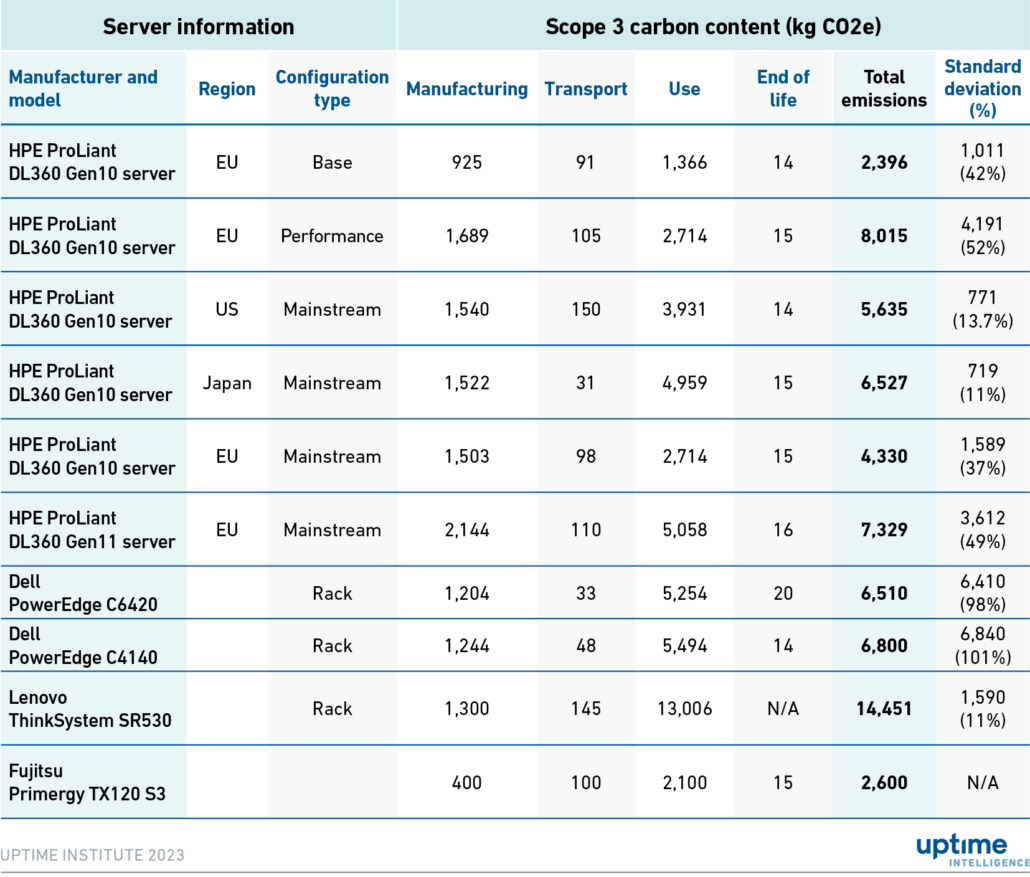
Table 1b. Server manufacturers’ PCF reports for the example configurations
The “use” and “end of life” carbon footprint categories are of little value to a data center operator when purchasing IT equipment. The OEM estimate of emissions from operational energy use is redundant to the operator’s emission reports because this will be accounted for under Scope 2 calculations based on functional energy use and the data center emissions factor after the equipment is installed. Emissions generated by the end-of-use recovery and disposal of IT equipment are several years away and will depend on the vendor hired to manage the disposal process.
While manufacturers’ PCF reports are a convenient source of Scope 3 data, calculating carbon content for each of the four categories requires assumptions and highly uncertain estimates that limit the data’s accuracy and usefulness. Quantifying embedded carbon emissions is an academic exercise that provides little, if any, actionable insight for data center operators.
Embedded emissions: manufacture of IT equipment
The manufacture of IT equipment has two primary sources of carbon emissions: the emissions associated with the energy consumed by the manufacturing and assembly processes (typically 30% to 50% of the total) and those associated with component production, particularly semiconductors such as flash memory, dynamic random access memory (DRAM) and processors (50% to 70% of the total).
The supply chains are also geographically concentrated. Equipment manufacturing and assembly operations are mostly based in the Asia-Pacific region, where electricity emission factors vary between 0.4 and 0.8 metric tonnes of CO2 per megawatt-hour due to the high fossil fuel content in the generation mix. IT equipment has hundreds of components that are sourced from multiple companies around the globe.
IT hardware vendors, let alone buyers, cannot know the exact electricity mix as different components are manufactured and assembled in other countries with varying sources of electricity. The raw materials used in each component further complicate the problem because they are typically processed in different geographic areas, each with its own electricity source and associated variations in CO2 emissions.
The greenhouse gas emissions from semiconductor manufacturing are the result of energy consumption (about 40%), the use of perfluorinated compounds (about 20%) — these are high global warming potential gases used for chamber cleaning — and the production of the many materials and process chemicals used to fabricate a semiconductor device (about 40%).
Most of these emissions are generated deep in the supply chain of the server manufacturing process. Neither the equipment manufacturer nor the purchaser has the visibility to observe these processes or has direct leverage over the suppliers responsible for the energy use and manufacturing emissions. Academic research has found up to 30% uncertainties in IT equipment manufacturing and assembly emissions estimates.
Actions to drive emissions reductions in these processes need to be promoted by the individual suppliers and their immediate customers — there is little that the IT buyer can do to drive reductions. Importantly, there will be little difference in embedded carbon between IT OEMs for a comparable product configuration. Equally, the embedded carbon of IT equipment can be a trade-off with emissions from use because larger, more richly configured systems can also be more energy efficient.
The manufacturing emissions data for the three configurations of the HPE Proliant DL360 illustrates why manufacturing emissions estimates have high uncertainty. Using data from the EU, the base configuration, with a minimal (i.e., low component) configuration, has an embedded emissions estimate of 55% of the performance configuration. Because each server configuration is unique to the purchaser, estimating the emissions for a specific configuration adds to the 30% uncertainty inherent in assessing the embedded emissions.
This uncertainty escalates significantly for the Dell server cited in Tables 1a and 1b because the embedded manufacturing emissions are calculated for a base server with only 32 GB of memory, an improbable configuration for a data center. Reporting a low-end configuration is primarily responsible for the higher uncertainty in the Dell estimate compared with the HPE estimate.
An operator can reduce the uncertainty introduced by configuration choices by weighting the published manufacturing emissions. To make this adjustment, the weight of the purchased server (available from shipping documents) can be multiplied by the ratio of the manufacturing emissions to the weight of the server configuration used to estimate the PCF (available from the manufacturer) to get an adjusted estimate of the purchased server manufacturing PCF. This approach is best applied to the mainstream or performance configurations, as the base configuration has minimal quantities of DRAM and storage devices that contribute a significant portion of the manufacturing emissions footprint.
This adjustment may reduce the error and create a more representative manufacturing emissions estimate. However, given the limited value of this emission quantity, the additional time and effort to collect the data and perform the adjustment may not be worthwhile.
Embedded emissions: transportation to the customer
Product transportation from the assembly site to the customer accounts for a small percentage of embedded carbon in Scope 3 emission estimates. These vary based on geographical region and type of transport vehicle.
Greater geographical distances to the reporting company inevitably result in more fuel use and, therefore, higher emissions. Most products are assembled and shipped from Asia. The transport data for the HPE servers with a mainstream configuration has three to five times the transport emissions when shipped to Europe (98 kilograms, kg, of CO2e) or the US (150 kg of CO2e ) compared with Japan (31 kg of CO2e).
The most significant impact on transport emissions (and cost) is whether the product is shipped by sea or air. When demand for products is high and delivery time is critical, companies may opt for a faster transport method at the expense of greater CO2e emissions. The air transportation of goods has a 20 to 30 times larger carbon footprint than transport via ocean freight.
Use emissions
To reduce use emissions, data center operators should focus on energy use of IT instead of embedded carbon. This entails buying the most efficient IT equipment for their workloads as measured in work delivered per watt, maximizing hardware utilization, and deploying power management where the workload can tolerate the higher response times.
These aspects of evaluating or improving server efficiency are covered in several Uptime Intelligence Updates and Briefing Reports (listed at the end of this Update). Focusing on efficiency, and particularly the better utilization of IT assets, will not only drive lower Scope 2 through better energy performance but can also help Scope 3 inventories by requiring fewer IT systems to perform the same amount of work.
Manufacturers’ estimates of use emissions have no value to the purchaser. A sustainable purchase decision needs to minimize energy consumption by procuring the most efficient equipment for the workload. The use emissions will then be a function of the electricity emissions factor at the data center location where the IT equipment is installed. These will be reported as Scope 2 emissions in an environmental / sustainability report and required regulatory disclosures.
End-of-life product management emissions
The end-of-life product emissions estimate also offers no value to the data center operator. These emissions are not accounted for until the product is removed from service during a specified refresh cycle. The emissions associated with the refurbishment, recycling and disposal of the product and its components will be a function of the chosen end-of-life product management process.
Conclusion
Apart from massive IT buyers who can force shifts in upstream supply chain emissions, most data center infrastructure operators cannot influence the emissions generated within the supply chain. A select few hyperscalers can leverage their buying power by prioritizing sustainability in their purchasing decisions. And while smaller data centers can be indirect beneficiaries of hyperscaler-driven innovations in the industry, they cannot rely on this possibility as an actionable strategy for carbon reduction. Instead, most data centers that wish to track and curb Scope 3 emissions can focus on the following:
- Require access to PCF for all products. IT buyers should expect to be able to obtain and compare equipment PCF data for their reporting purposes and to consider estimates when selecting their configurations. Buyers can signal their preference for transparency to vendors and, over time, choose to work with those companies that are more transparent in their reporting and methodology for calculating estimates.
- Focus on IT energy performance. Scope 3 emissions are becoming an important component of emissions inventory reports, but Scope 2 emissions will likely account for most life-cycle emissions. Even for those data centers that use low-carbon power sources, good stewardship of energy resources should prioritize the reduction of energy consumption. Driving workload consolidation, a key component to helping infrastructure energy performance, will not only help energy performance but will also benefit the Scope 3 balance by using fewer IT systems and / or less hardware. Consequently, product configuration decisions should not be based solely on PCF for a single piece of equipment because better-performing, and thus potentially more efficient, configurations will often have more silicon and components (i.e., bigger processors, more memory, more storage), accompanied by a higher Scope 3 bill.
- Factor in Scope 3 emissions into decisions about IT systems refresh. A relatively recent development in server technology is that replacing an older system with a newer one may not automatically mean better energy performance. Modern servers come with the caveat that, unless given a substantial amount of work, their utilization will not be high enough to perform more work for each kilowatt-hour of consumed energy. Without a considerable efficiency advantage, the new server may not be able to recover its manufacturing emissions.
The Uptime Intelligence View
Data center managers are facing mandates to report Scope 3 C02e emissions. Estimating the embedded carbon in IT equipment fails to produce actionable data because the values have a high degree of uncertainty and provide little guidance on how to reduce manufacturing emissions. Innovative operators and owners will instead focus on reducing their own direct emissions and forming collaborative partnerships with suppliers and manufacturers to encourage transparency in emissions reporting.
Jay Dietrich, Research Director, JDietrich@uptimeinstitute.com
Rose Weinschenk, Research Associate, rweinschenk@uptimeinstitute.com


