
24×7 carbon-free energy (part one): expectations and realities
Data center operators that set net-zero goals will ultimately have to transition to 100% 24×7 carbon-free energy. But current technological limitations mean it is not economically feasible in most grid regions.
In the past decade, the digital infrastructure industry has embraced a definition of renewable energy use that combines the use of renewable energy credits (RECs), guarantees of origin (GOs) and carbon offsets to compensate for the carbon emissions of fossil fuel-based generation, and the consumption of renewable energy in the data center.
The first component is relatively easy to achieve and has not proved prohibitively expensive, so far. The second, which will increasingly be required, will not be so easy and will cause difficulty and controversy in the digital infrastructure industry (and many other industries) for years to come.
In the Uptime Institute Sustainability and Climate Change Survey 2022, a third of data center owners / operators reported buying RECs, GOs and other carbon offsets to support their renewable energy procurement and net-zero sustainability goals.
But many organizations, including some regulators and other influential bodies, are not happy that some operators are using RECs and GOs to claim their operations are carbon neutral with 100% renewable energy use. They argue that, with or without offsets, at least some of the electricity the data center consumes is responsible for carbon dioxide (CO2) emissions — which are measured in metric tonnes (MT) of CO2 per megawatt-hour (MWh).
The trend is clear — offsets are becoming less acceptable. Many digital infrastructure operators have started to (or are planning to) refocus their sustainability objectives towards 100% 24×7 carbon-free energy (CFE) consumption — consuming CFE for every hour of operation.
This Update, the first of two parts, will focus on the key challenges that data center operators face as they move to use more 24×7 CFE. Part two, 24×7 carbon-free energy: getting to 100%, will outline the steps that operators, grid authorities, utilities and other organizations should take to enable data centers to be completely powered by CFE.
A pairing of 24×7 CFE and net-zero emissions goals alters an operator’s timeframe to achieve their net-zero emissions as it removes the ability to offset for success. At present, 100% 24×7 CFE is technically and / or economically unviable in most grid regions and will not be viable in some regions until 2040 to 2050, and beyond. This is because solar and wind generation is highly variable, and the capacity and discharge time of energy storage technologies is limited. Even grid regions with high levels of renewable energy generation can only support a few facilities with 100% 24×7 CFE because they cannot produce enough MWh during periods of low solar and wind output. Consequently, this approach could be expensive and financially risky.
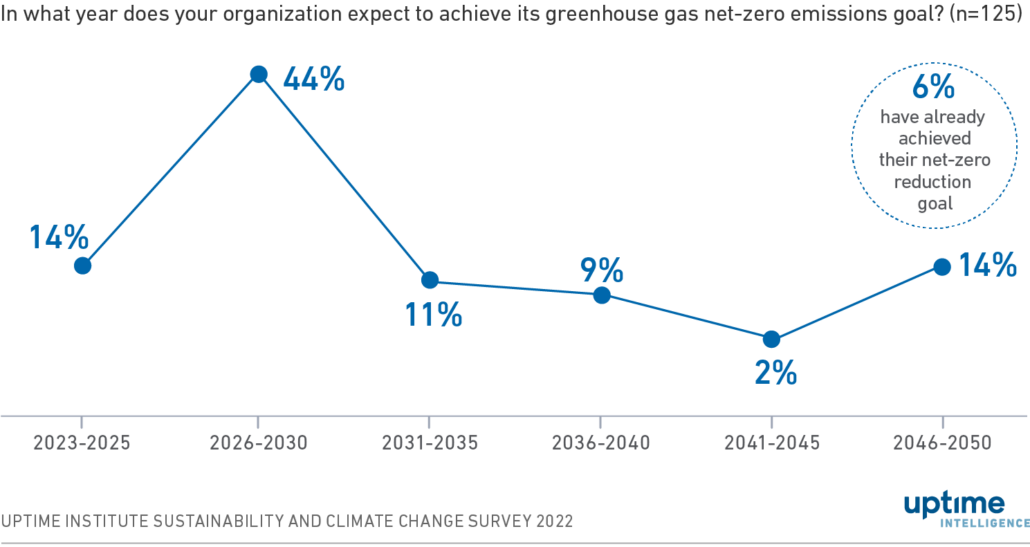
The fact that most grid regions cannot consistently generate enough CFE complicates net-zero carbon emissions goals. The Uptime Institute Sustainability and Climate Change Survey 2022 found that almost two-thirds of data center owners and operators expect to achieve a net-zero emissions goal by 2030 and that three-quarters expect to by 2035 (Figure 1). Operators will not be able to achieve these enterprise-wide goals by using 100% 24×7 CFE. They will have to use RECs, GOs and offsets extensively — and significant financial expenditure — to deliver on their promises.
Figure 1. Time period when operators expect to achieve their net-zero goals
Although achieving net-zero emissions goals through offsets may seem attractive, offset costs are rising and operators need to assess the costs and benefits of increasing renewable energy / CFE at their data centers. Over the long term, if organizations demand more CFE, they will incentivize energy suppliers to generate more, and to develop and deploy energy storage, grid management software and inter-region high voltage interconnects.
To establish a 24×7 CFE strategy, operators or their energy retailers should track and control CFE assets and energy delivery to their data centers, and include factors that affect the availability and cost of CFE MWh in procurement contracts.
Renewable energy intermittency
The MWh output of solar and wind generation assets varies by minute, hour, day and season. Figure 2 shows how wind generation varied over two days in January 2019 in the grid region of ERCOT (a grid operator in Texas, US). On January 8, wind turbines produced 32% to 48% of their total capacity (capacity factor) and satisfied 19% to 33% of the entire grid demand. On January 14, wind capacity fell to 4% to 18% and wind output met only 3% to 9% of the total demand.
Figure 2. Wind generation data for two days in January 2019
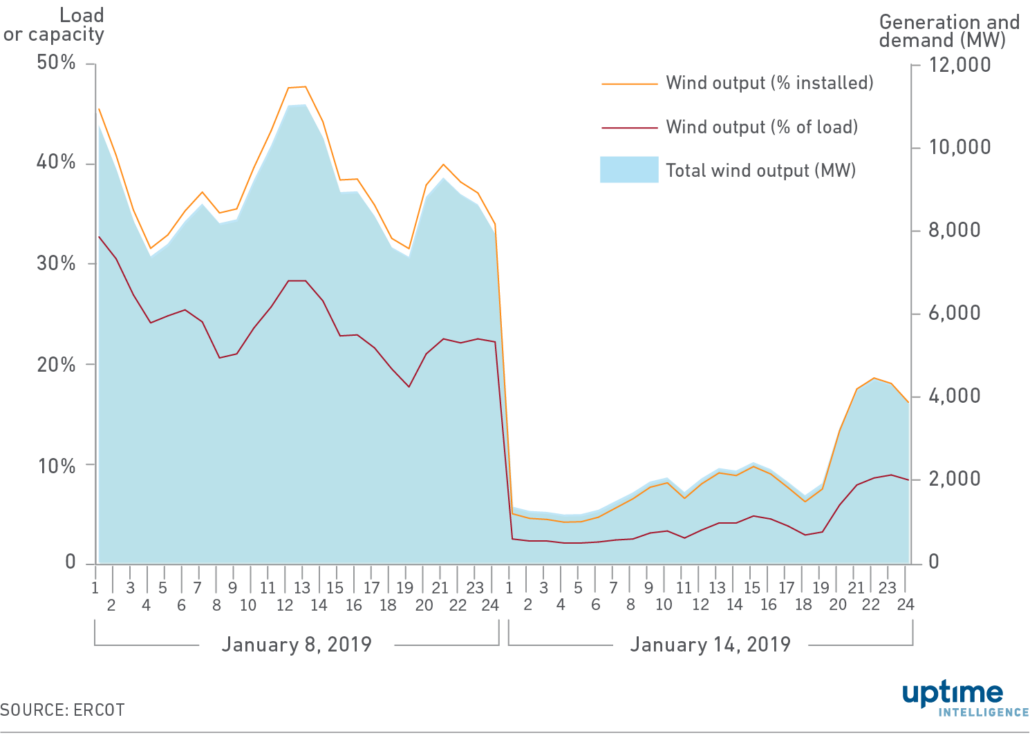
To match the generation output to grid demand, sufficient reliable generation capacity (typically fossil fuel-fired) needs to be available to address the variations in wind output during the two days: 3,000 MW on January 8 and 2,500 MW on January 14. There needs to be four to five natural gas turbine generators available. Capacity is also needed to cover the (roughly) 6,000 MW of output difference between the two days.
ERCOT needs to maintain sufficient reliable generation capacity (typically fossil fuel-fired) to match grid-wide generation capacity to demand, in the face of the hour-to-hour and day-to-day variation in wind and solar output. There has to be four or five 700 MW natural gas turbines in reserve to meet the 2,500 MW to 3,000 MW of output variation on January 14 and January 8, respectively.
In 2020, wind generation in ERCOT satisfied less than 5% of grid demand for 600 hours — that’s 7% of the year. Given the number of hours of low MWh generation, only a few facilities in the grid region can aspire to 100% CFE. The challenge of significant hours of low generation exists in most grid regions that strive to depend on wind and solar generation to meet carbon free energy goals. This limits the ability of operators to set and achieve 100% CFE goals for specific facilities over the next 10 to 20 years.
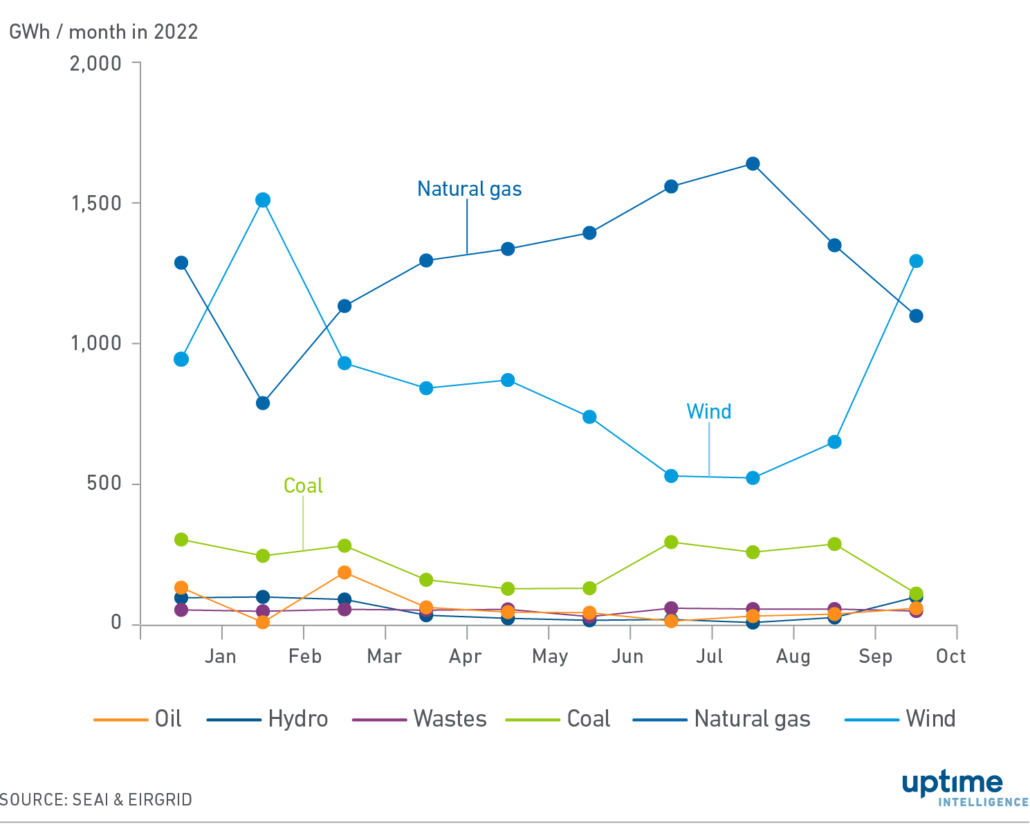
Seasonal variations can be even more challenging. The wind generation gigawatt hours (GWh) in the Irish grid were two to three times higher in January and February 2022 than in July and August 2022 (Figure 3, light blue line), which left a seasonal production gap of up to 1,000 GWh. The total GWh output for each month masks the hour-to-hour variations of wind generation (see Figure 3). These amplify the importance of having sufficient and reliable generation available on the grid.
Figure 3. Monthly gigawatt-hours generated in Ireland by fuel type in 2022
The mechanics of a 24×7 CFE strategy
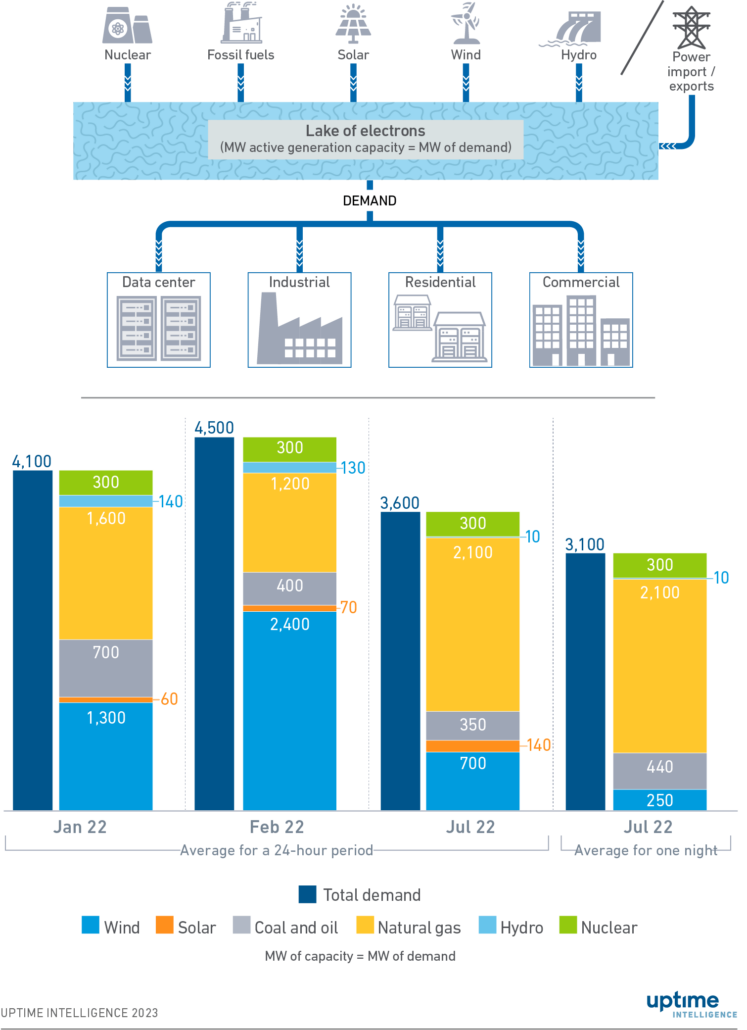
To manage a facility-level program to procure, track and consume CFE, it is necessary to understand how an electricity grid operates. Figure 4 shows a fictional electricity grid modelled on the Irish grid with the addition of a baseload 300 MW nuclear generation facility.
The operation of an electrical grid can be equated to a lake of electrons held at a specified level by a dam. A defined group of generation facilities continuously “fills” the electron lake. The electricity consumers draw electrons from the lake to power homes and commercial and industrial facilities (Figure 4). The grid operator or authority maintains the lake level (the grid potential in MW) by adding or subtracting online generation capacity (MW of generation) at the same “elevation” as the MW demand of the electricity consumers pulling electrons from the lake.
If the MWs of generation and consumption become unbalanced, the grid authority needs to quickly add or subtract generation capacity or remove portions of demand (demand response programs, brownouts and rolling blackouts) to keep the lake level balanced and prevent grid failure (a complete blackout).
Figure 4. Example of generation and demand balancing within an electricity grid
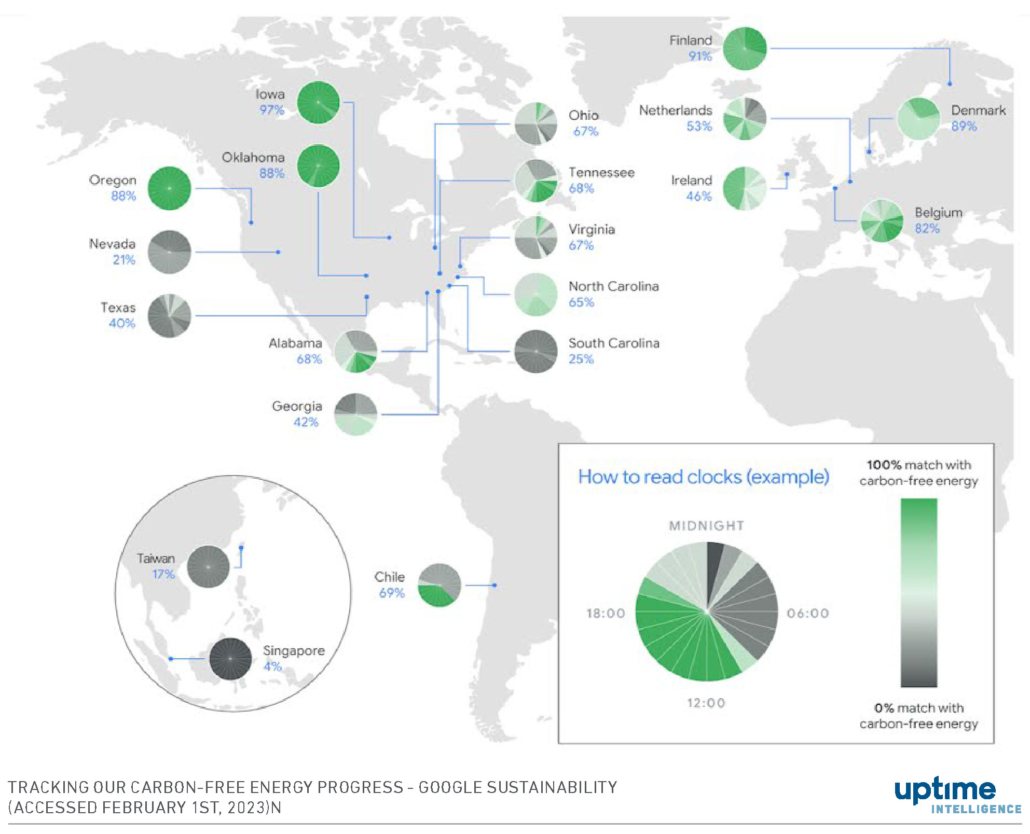
The real-time or hourly production of each generation facility supplying the grid can be matched to the hourly consumption of a grid-connected data center. The grid authority records the real-time MWh generation from each facility and the data can be made available to the public. At least two software tools, WattTime and Cleartrace, are available in some geographies to match CFE generation to facility consumption. Google, for example, uses a tracking tool and publishes periodic updates of the percentage utilization of CFE at each of its owned data centers (Figure 5).
Figure 5. Percentage of hourly carbon-free energy utilized by Google’s owned data centers
Grid authorities depend on readily dispatchable generation assets to balance generation and demand. Lithium-ion batteries are a practical way to respond to rapid short-term changes (within a period of four hours or less) in wind and solar output. Because of the limited capacity and discharge time of lithium-ion batteries — the only currently available grid-scale battery technology — they cannot manage MW demand variation across 24 hours (Figure 2) or seasons (Figure 3). Consequently, grid authorities depend on large-scale fossil fuel and biomass generation, and hydroelectric where available, to maintain a reserve to meet large, time-varied MW demand fluctuations.
The grid authority can have agreements with energy consumers to reduce demand on the grid, but executing these agreements typically requires two to four hours’ notice and a day-ahead warning. These agreements cannot deliver real-time demand adjustments.
The energy capacity / demand bar charts at the bottom of Figure 4 illustrates the capacity and demand balancing process within a grid system at different times of the day and year. They show several critical points for managing a grid with significant, intermittent wind and solar generating capacity.
- In periods of high wind output, such as January and February 2022, fossil fuel generation is lower because it is only used to meet demand when CFE options cannot. During these periods of high wind output, organizations can approach or achieve 100% CFE use at costs close to grid costs.
Solar generation — confined to daylight hours — varies by the hour, day and season. As with wind generation, fluctuations in solar output need to be managed by dispatching batteries or reliable generation for short-term variations in solar intensity and longer reductions, such as cloudy days and at night.
- For periods of low wind output (Figure 4, July 2022 average day and night), the grid deploys reliable fossil fuel assets to support demand. These periods of low wind output prevent facilities from economically achieving 100% 24×7 CFE.
- Nuclear plants provide a reliable, continuous supply of baseload CFE. An energy retailer could blend wind, solar and nuclear output in some grid regions to enable 100% 24×7 CFE consumption at an operating facility.
Current nuclear generation technologies are designed to operate at a consistent MW level. They change their output over a day or more, not over minutes or hours. New advanced small modular reactor technologies adjust output over shorter periods to increase their value to the grid, but these will not be widely deployed for at least a decade.
- For batteries to be considered a CFE asset, they must either be charged during high wind or solar output periods, or from nuclear plants. Software tools that limit charging to periods of CFE availability will be required.
To approach or achieve 100% CFE with only wind generation, data centers need to buy three to five times more MWs than they need. The Google Oklahoma (88% hourly CFE) and Iowa (97% hourly CFE) data centers (Figure 5) illustrate this. Power purchase contracts for the two locations (February 2023) show 1,012 MW of wind generation capacity purchased for the Oklahoma data center and 869 MW of wind capacity purchased for the Iowa data center. Assuming the current demand for these two data centers is 250 MW to 350 MW and 150 MW to 250 MW, respectively, the contracted wind capacity required to achieve the CFE percentages is three to five times the data center’s average operating demand.
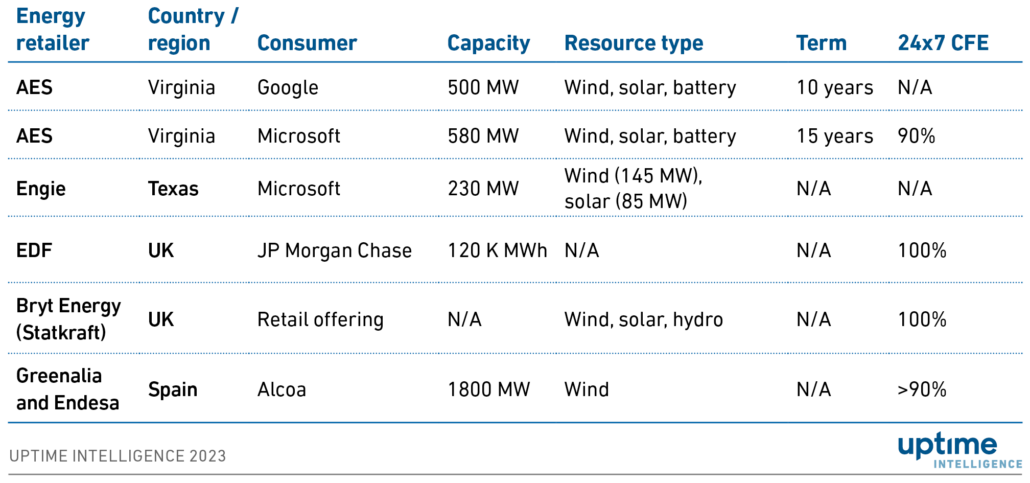
Table 1 lists retail energy contracts with guaranteed percentages of 24×7 CFE publicized over the past three years. These contracts are available in many markets and can provide data center operators with reliable power with a guaranteed quantity of CFE. The energy retailer takes on the risk of managing the intermittent renewable output and assuring supply continuity. In some cases, nuclear power may be used to meet the CFE commitment.
One detail absent from publicly available data for these contracts is the electricity rate. Conversations with one energy retailer indicated that these contracts charge a premium to market retail rates — the higher the percentage of guaranteed 24×7 CFE, the higher the premium. Operators can minimize the financial risk and premiums of this type of retail contract by agreeing to longer terms and lower guarantees — for example 5- to 10-year terms and 50% to 70% guaranteed 24×7 CFE. For small and medium size data center operators, a 24×7 renewables retail contract with a 50% to 70% guarantee will likely provide electric rate certainty with premiums of 5% or less (see Table 1) and minimal financial risk compared with the power purchase agreement (PPA) approach used by Alcoa (Table 2).
Table 1. Examples of 24×7 renewable energy retail contracts
Alcoa wind PPA contracts in Spain
Aluminum producer Alcoa Corporation recently procured 1.8 GW of wind PPA contracts for its smelter in Spain. Table 2 shows the financial and operational risks associated with an over-purchase of wind capacity. The smelter has 400 MW of energy demand. Alcoa estimates it would need at least 2 GW of wind capacity to achieve 100% CFE. The Wall Street Journal Alcoa contract information detailed in Table 2 indicates that with its 1.8 GW of PPAs, Alcoa is likely to reach more than 95% 24×7 CFE. The purchase had two objectives: to stabilize the facility’s long-term electricity cost, and to produce near carbon-free aluminum.
The contracted quantity of wind power is 4.5 times the facility’s power demand, so Alcoa has estimated that to get close to 100% 24×7 CFE, it needs a high level of overcapacity, based on its modelling of wind farm output. In practice, Alcoa will likely have to buy some power on the spot market when wind output is low, but the overall emissions of the power it uses will be minimal.
Table 2 details the estimated total MWh of generation and financial implications of the PPAs. Assuming the wind farms have a capacity factor (CF) of 0.45, the PPA contracts secure more than twice as much electricity as the smelter consumes. This excess 3.6 million MWh will be sold into the electricity spot market and Alcoa’s profits or losses under the PPAs will be determined by the price at the time of generation.
The LevelTen Energy Q3 2022 PPA Price Index report was consulted for the P25 electricity rate (the rate at which 25% of available PPA contracts have a lower electricity rate) to estimate the rate of the signed PPAs: €75/MWh was selected. Two EU-wide average electricity rates, taken from the Ember European power price tracker, were chosen to bracket the potential profits and losses associated with the contracts for January 2021 (€50/MWh) and December 2022 (€200/MWh).
Table 2. Projection of power generation and economic returns for the Alcoa plant wind PPAs
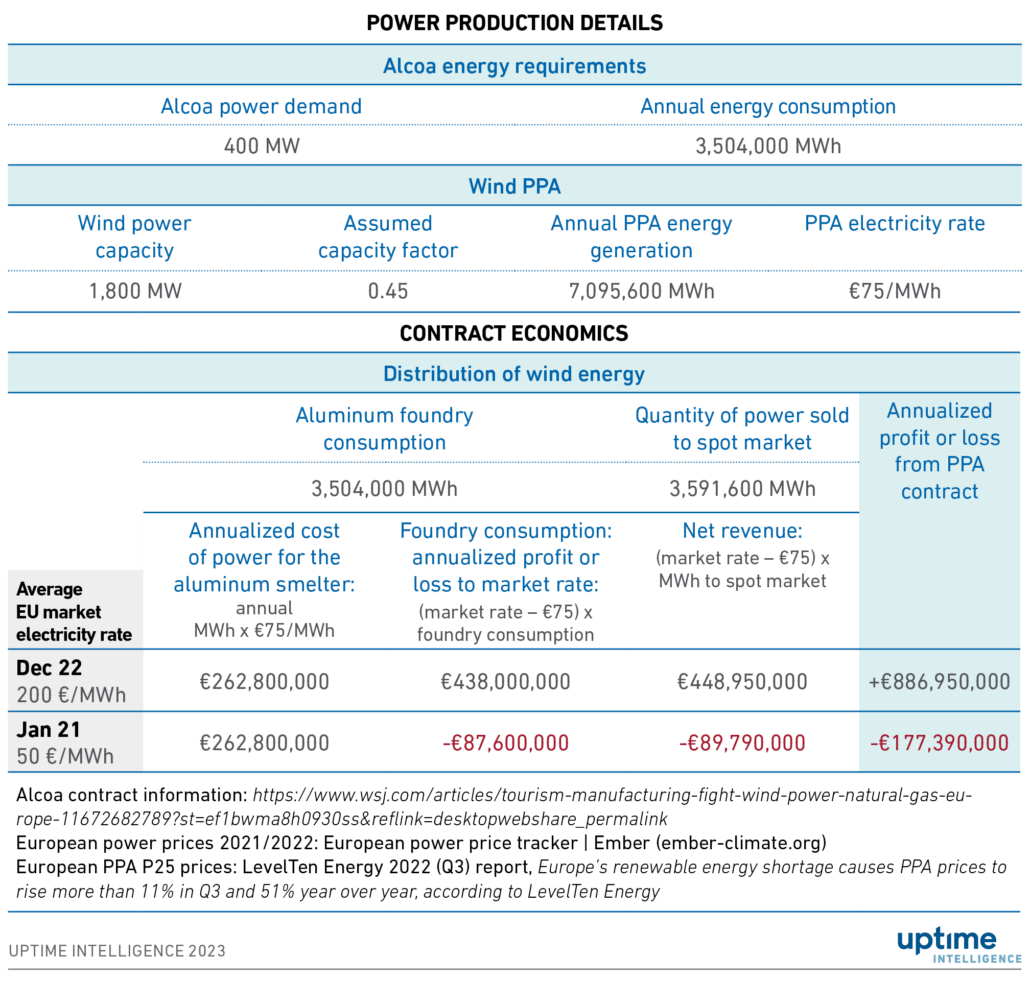
The contracts have significant rewards and risks. If the December 2022 rate remains stable for a year, the agreement will generate €887 million in profit for Alcoa. Conversely, if the January 2021 price had remained stable for a year, Alcoa would have lost €180 million. The wind farms are slated to go online in 2024. The Alcoa plant will restart when the wind farms start to supply electricity to the grid. Current electricity rate projections suggest that the contracts will initially operate with a profit. However, profits are not guaranteed over the 10- to 20-year life of the PPAs.
Real-time spot market electricity rates approach zero over time as the total installed wind and solar generation capacity increases within a grid region. Meeting EU government commitments for a carbon-free grid requires significant wind and solar overcapacity on the overall grid. As excess generation capacity is deployed to the grid to meet these commitments, periods of power overproduction will increase, which is likely to depress spot market prices. There is a strong probability that Alcoa’s contracts will generate losses in their later years as the electricity grid moves toward being carbon free by 2035.
The wind PPAs will provide Alcoa with two near-term revenue generators. First, Alcoa could sell its estimated 3.6 GWh of excess GOs. Bundled or unbundled GOs from its excess electricity generation should be in high demand from data center operators and other enterprises with 2030 net-zero carbon commitments. Second, it could sell the electricity itself. Selling at 2022 year-end rates for Nordic hydropower GOs (€10/MWh) would realize a profit of €36 million.
Low or zero carbon aluminum will also be in high demand and command premium prices as companies seek to decarbonize their facilities or products. While the premium is uncertain, it will add to the benefits of wind power purchases and improve the economics of Alcoa operations. The Alcoa PPA contracts have many upsides, but the Alcoa CFO faces a range of possible financial outcomes inherent in this CFE strategy.
Conclusions
Deploying wind and solar generation overcapacity creates broader operational and financial challenges for grid regions. As overcapacity increases, the use of reliable fossil fuel and nuclear generation assets to maintain grid stability will decrease. As a result, these assets may not generate sufficient revenue to cover their operating and financing costs, which will force them to close. Some nuclear generation facilities in the US have already been retired early because of this.
Grid authorities, utility regulators and legislative bodies need to address these challenges. They need to plan grid capacity: this includes evaluating the shape curves of wind and solar MWh output to determine the quantities of reliable generation required to maintain grid reliability. They should target incentives at developing and deploying clean energy technologies that can boost capacity to meet demand — such as long duration energy storage, small modular nuclear reactors and hydrogen generation. Without sufficient quantities of reliable generation assets, grid stability will slowly erode, which will put data center operations at risk and potentially increase the runtime of backup generation systems beyond their permitted limits.


 Getty
Getty


