 2019
2019Data center energy use goes up and up and up
Energy use by data centers and IT will continue to rise, putting pressure on energy infrastructure and raising questions about carbon emissions. The drivers for more energy use are simply too great to be offset by efficiency gains.
Drivers
Demand for digital services has seen sustained, exceptional growth over the past few years — and with it, the energy consumption of the underlying infrastructure has risen steadily as well. This has given rise to concerns about the ability of the energy industry to effectively supply data centers in some geographies — and the continuing worries about the sector’s growing carbon footprint.
Although there is a shortage of reliable, comprehensive data about the industry’s use of energy, it is likely that some models have underestimated energy data and carbon emissions and that the issue will become more critical in the years ahead.
There are some standout examples of IT energy use. Bitcoin mining, for example, is reliably estimated to have consumed over 73 terawatt-hour (TWh) of energy in 2019. This equates to the electricity use of 6.8 million average US households, or 20 million UK households. This is one cryptocurrency — of over 1,500 — and just one application area of blockchains.
Social media provides another example of uncontrolled energy use. Research by Uptime Intelligence shows that every time an image is posted on Instagram by the Portuguese soccer star Cristiano Ronaldo (who at the time of writing had the most followers on the platform), his more than 188 million followers consume over 24 megawatt-hours (MWh) of energy to view it.
Media streaming, which represents the biggest proportion of global traffic and which is rising steadily and globally, has become the energy guzzler of the internet. According to our analysis, streaming a 2.5 hour high definition (HD) movie consumes 1 kilowatt-hour (kWh) of energy. But for 4K (Ultra HD) streaming — expected to become more mainstream in 2020 — this will be closer to 3 kWh, a three-fold increase.
Data from the most developed countries shows what can be expected elsewhere. In the UK, which has more than 94% internet penetration, annual household broadband data consumption increased from 17 gigabyte (GB) in 2011 to 132 GB in 2016, according to official Ofcom data — a sustained 50% increase year-on-year for five years. (The growth figure is much higher in other parts of the world such as Asia and Africa.) Internet penetration, standing at 58% globally in 2019, is expected to increase by 10% in 2020.
This increase in demand is a big driver — although not the only one — for more infrastructure and more energy consumption in cloud, colocation and some enterprise data centers. But a new factor has yet to kick in: 5G.
While it will take a few years for 5G to further mature and become widespread, it is widely expected that the rollout of 5G from 2020 will substantially accelerate the data growth trends, with many new types of digital services in domains such as smart cities, IoT and transportation, among many others. The increased bandwidth compared with 4G will lead to increased demand for higher resolution content and richer media formats (e.g., virtual reality) as soon as late 2020 and rising more steeply, along with energy consumption, after that.
The role of blockchain (of which Bitcoin is just an example) and its impact on energy consumption is still to be fully determined, but if the takeup is on a large scale, it can only be an upward force. Most analysts in this area have predicted a dramatic rise in blockchain adoption beyond cryptocurrency in 2020, helped by new offerings such as the AWS blockchain service. Not all blockchain models are the same, but it inherently means a decentralized architecture, which requires extensive infrastructure to accommodate the replication of data. This consumes more energy than traditional centralized architectures.
Bitcoin is an example of a blockchain that uses Proof of Work as a consensus mechanism — and such models are extremely energy-intensive, requiring multiple parties to solve complex mathematical problems. While alternatives to this model (e.g., Proof of Stake) are likely to gain widespread commercial adoption, the uptake to date has been slow.
Energy consumption and global IT
Several reports have been published in recent years on IT energy consumption and its predicted growth rates. An International Energy Agency (IEA) report published in 2019 noted that workloads and internet traffic will double, but it also forecast that data center energy demand will remain flat to 2021, due to efficiency trends. It cited various references for the basic research.
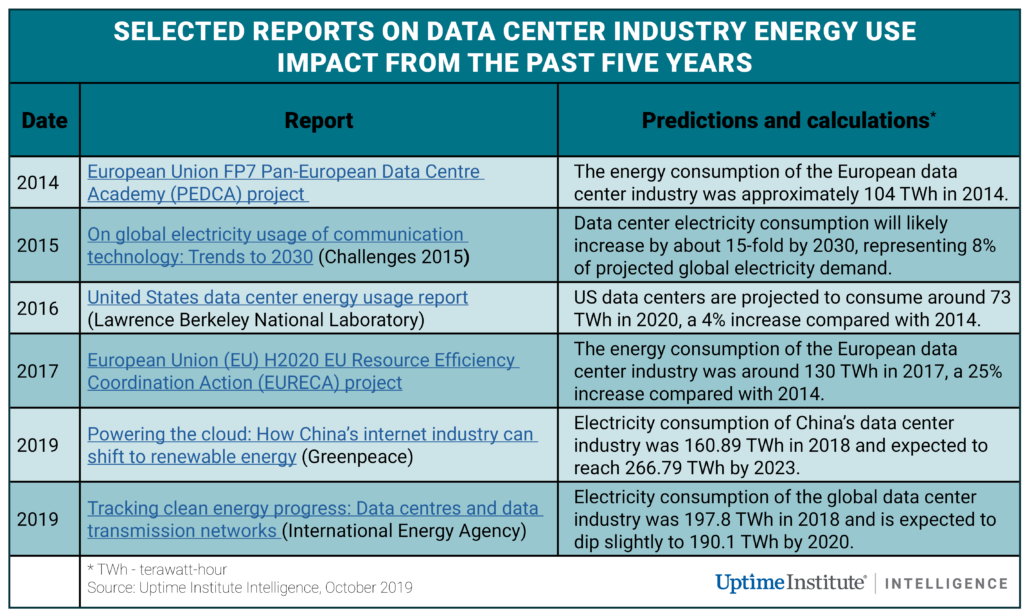
But Uptime Institute Intelligence is wary of this prediction and intends to collaborate with various parties in 2020 to research this further. There are very strong factors driving up IT energy consumption, and some of the existing data on IT energy use contradicts the IEA figures. The IEA report, for example, stated that global data center energy consumption was 197.8 TWh in 2018 and is expected to drop slightly by 2021. However, research by the European Union’s (EU’s) EURECA (EU Resource Efficiency Coordination Action) Project found that European data centers consumed 130 TWh in 2017, whereas Greenpeace put energy consumption by the Chinese data center industry at 160 TWh in 2018. This suggests an annual total for China and Europe alone in the neighborhood of 290 TWh, far higher than the IEA global figures.
It is true that the explosive increase in IT demand will not translate directly into the same rate of growth for infrastructure energy consumption (due to increased IT energy efficiency). However, given the exponential rate of growth, it is likely that demand will substantially outpace the gains from efficiency practices over the next five years.
In US data centers, the law of diminishing returns may begin to limit the impact of energy savings. For example, at the data center level, best practices such as hot/cold aisle containment, installation of blanking plates and raising set point temperature have already been widely deployed; this can be seen in the substantial drop in power usage effectiveness (PUE) between 2011 and 2014. However, since 2014, PUE has not dropped much, and in 2019, we noticed a slight increase in the average annual PUE reported by respondents to our global data center survey. Similarly, with IT hardware, Moore’s law has slowed down, and newer servers are not maintaining the same efficiency improvements seen in the past.
Uptime Institute expects the strong growth in the IT sector to be sustained over the next five years, given the well-understood demand patterns and the existing technologies coming into large-scale adoption. Our preliminary research suggests that IT energy consumption will rise steadily too, by as much as 10% in 2020, but further research will be conducted to develop and validate these forecasts.
The full report Ten data center industry trends in 2020 is available to members of the Uptime Institute Network here.


 Uptime Institute, 2019

 2019
2019