
99 Red Flags
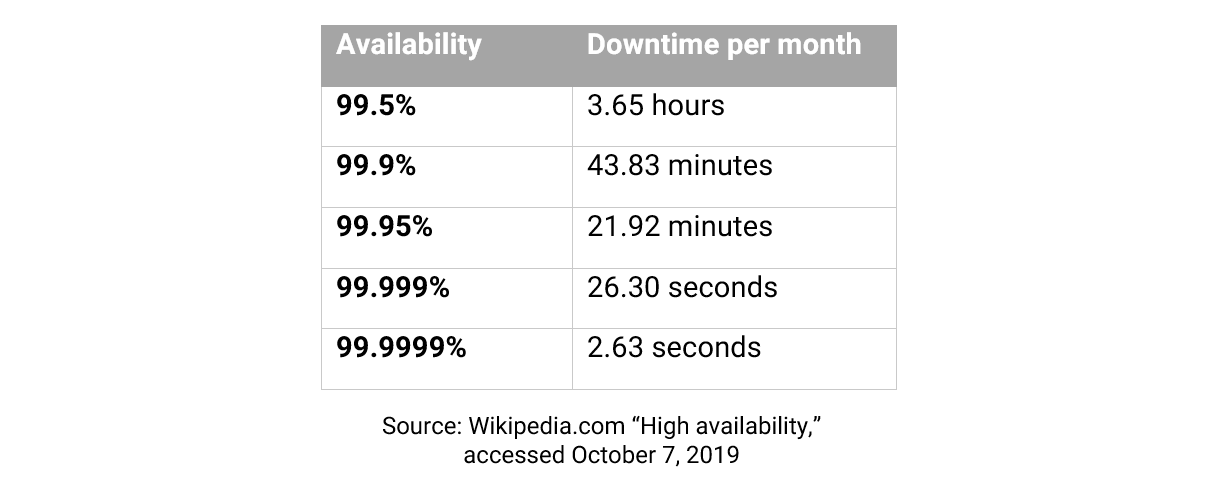
One of the most widely cited metrics in the IT industry is for availability, expressed in the form of a number of nines: three nines for 99.9% availability (minutes of downtime per year), extending to six nines — 99.9999% — or even, very rarely, seven nines. What this should mean in practice is show in the table below:
The metric is very widely used (more so in the context of IT equipment than facilities) and is commonly, if not routinely, cited in cloud services and colocation contracts. Its use is rarely questioned. Contrast this with the power usage effectiveness (PUE) metric, which has been the subject of a decade of industry-wide debate and is treated with such suspicion that many dismiss it out of hand.
So, let us start (or re-open) the debate: To what degree should customers of IT services, and particularly cloud services, pay attention to the availability metric — the availability promise — that almost all providers embed in their service level agreement (SLA) – the 99.99% or 99.999% number? (The SLA creates a baseline below which compensation will be paid or credits applied.)
In speaking to multiple colleagues at Uptime Institute, there seems to be a consensus: Treat this number, and any SLAs that use this number, with extreme caution. And the reasons why are not so dissimilar from the reasons why PUE is so maligned: the metric is very useful for certain specific purposes but it is used casually, in many different ways, and without scientific rigor. It is routinely misapplied as well (sometimes with a clear intention to distort or mislead).
Here are some of the things that these experts are concerned about. First, the “nines” number, unless clearly qualified, is neither a forward-looking metric (it doesn’t predict availability), nor a backward-looking number (it doesn’t say how a service has performed); usually a time period is not stated. Rather, it is an engineering calculation based on the likely reliability of each individual component in the system, based on earlier tests or manufacturer promises. (The method is rooted in longstanding methodologies for measuring the reliability of dedicated and well-understood hardware equipment, such as aircraft components or machine parts.)
This is where the trouble starts. Complex systems based on multiple parts working together or in which use cases and conditions can change frequently are not so easily modeled in this way. This is especially true of software, where changes are frequent. To look backward with accuracy requires genuine, measured and stable data of all the parts working together; to look forward requires an understanding of what changes will be made, by whom, what the conditions will be when the changes are made, and with what impact. Add to this the fact that many failures are due to unpredictable configuration and/or operation and management failures, and the value of the “nines” metric becomes further diluted.
But it gets worse: the role of downtime due to maintenance is often not covered or is not clearly separated out. More importantly, the definition of downtime is either not made clear or it varies according to the service and the provider. There are often — and we stress the word “often” — situations in modern, hybrid services where a service has slowed to a nearly non-functional crawl, but the individual applications are all still considered to be “up.” Intermittent errors are even worse — the service can theoretically stop working for a few seconds a day at crucial times yet be considered well within published availability numbers.
The providers do, of course, measure historical service availability — they need to show performance against existing SLAs. But the published or promised 99.9x availability figures in the SLAs of providers are only loosely based on underlying measurements or engineering calculations. In these contracts, the figure is set to maximize profit for the operator: it needs to be high enough to attract (or not scare away) customers, but low enough to ensure minimum compensation is paid. Since the contracts are in any case weighted to ensure that the amounts paid out are only ever tiny, the incentive is to cite a high number.
To be fair, it is not always done this way. Some operators cite clear, performance-based availability over a period of time. But most don’t. Most availability promises in an SLA are market-driven and may change according to market conditions.
How does all this relate to the Uptime Institute Tier rating systems for the data center? Uptime Institute’s Chief Technology Officer Chris Brown explains that there is not a direct relationship between any number of “nines” and a Tier level. Early on, Uptime did publish a paper with some “expected” availability numbers for each Tier level to use as a discussion point, but this is no longer considered relevant. One reason is that it is possible to create a mathematical model to show a data center has a good level of availability (99.999%, for example), while still having multiple single points of failure in its design. Unless this is understood, a big failure is lying in wait. A secondary point is that measuring predicted outages using one aggregated figure might hide the impact of multiple small failures.
Brown (along with members of the Uptime Institute Resiliency Assessment team) believes it can be useful to use a recognized failure methodology, even creating a 99.9x figure. “I like availability number analysis to help determine which of two design choices to use. But I would not stake my career on them,” Brown says. “There is a difference between theory and the real world.” The Tier model assumes that in the real world, failures will occur, and maintenance will be needed.
Where does this leave cloud customers? In our research, we do find that the 99.9x figures give a good first-pass guide to the expected availability of a service. Spanner, Google’s highly resilient distributed database, for example, has an SLA based on 99.999% availability — assuming it is configured correctly. This compares to most database reliability figures of 99.95% or 99.99%. And some SLAs have a higher availability promise if the right level of replication and independent network pathways are deployed.
It is very clear that the industry needs to have a debate about establishing — or re-establishing — a reliable way of reporting true, engineering-based availability numbers. This may come, but not very soon. In the meantime, customers should be cautious — skeptical, even. They should expect failures and model their own likely availability using applicable tools and services to monitor cloud services.


 2020
2020

