The lack of transparency can be seen as a root cause of outages and incidents
By Jason Weckworth
I recently began a keynote speech at Uptime Institute Symposium 2013 by making a bold statement. As data center operators, we simply don’t share enough of our critical facilities incidents with each other. Yet Uptime Institute maintains an entire membership organization called the Uptime Institute Network that is dedicated to providing owners and operators the ability to share experiences and best practices by facilitating a rich information nexus exchange between members and the Uptime Institute.
Why isn’t every major data center provider already a member of this Network? Why don’t we share more experiences with each other? Why are we reluctant to share details of our incidents? Of course, we love to talk about each other’s incidents as though our competitors were hit with a plague while we remain immune from any potential for disaster. Our industry remains very secretive about sharing incidents and details of incidents, yet we can all learn so much from each other!
I suppose we’re reluctant to share details with each other because of fear that the information could be used against us in future sales opportunities, but I’ve learned that customers and prospects alike expect data center incidents. Clients are far less concerned about the fact that we will have incidents than about how we actually manage them. So let’s raise the bar as operators. Let’s acknowledge the fact that we need to be better as an industry. We are an insurance policy for every type of critical IT business. None of us can afford to take our customers off-line… period. And when someone does, it hurts our entire industry.
Incidents Every Day
An incident does not mean a data center outage. These terms are often confused, misinterpreted or exaggerated. An outage represents a complete loss of power or cooling to a customer’s rack or power supply. It means loss of both cords, if dual fed, or loss of single cord, if utilizing a transfer switch either upstream or at the rack level.
Equipment and systems will break, period. Expect it. Some will be minor like a faulty vibration switch. Others will be major like an underground cable fault that takes out an entire megawatt of live UPS load (which happened to us). Neither of these types of incidents are an outage at the rack level, yet either of them could result in one if not mitigated properly.
Data Center Risk
Do not ask whether any particular data center has failures. Ask what they do when they have a failure. There is a lot of public data available on the causes of data center outages and incidents, but I particularly like a data set published by Emerson (see Figure 1) because it highlights the fact that most data center incidents are caused by human and mechanical failures, not weather or natural disasters. Uptime Institute Network data provide similar results. This means that, as operators, we play a major role with facility management.
Figure 1. Data provided by Emerson shows that human and mechanical failures cause the vast majority of unplanned outages in data centers.
I have been involved with every data center incident at RagingWire since its opening in 2001. By the end of this year, that will equate to almost 100 megawatt (MW) of generating capacity and 50 MW of critical IT UPS power. I must admit that data center incidents are not pleasant experiences. But learning from them makes us better as a company, and sharing the lessons make us better as an industry.
In 2006, RagingWire experienced one particularly bad incident caused by a defective main breaker that resulted in a complete outage. I distinctly recall sitting in front of the Board of Directors and Executives at 2:00 AM trying to explain what we knew up to that point in time. But we didn’t yet have a root-cause analysis. One of the chief executives looked at me across the table and said, “Jason, we love you and understand the incredible efforts that you and your teams have put forth. You haven’t slept in two days. We know we are stable at the current time, but we don’t yet have an answer for the root cause of the failure, and we have enterprise Fortune 500 companies that are relying on us to give them an answer immediately as our entire business is at risk. So make no mistake. There will be a fall guy, and it’s going to be you if we don’t have the answer to prove this will never happen again. You have four hours, or you and all your engineers are fired!” Fortunately, I’m still at RagingWire, so the story ended well. We used the experience to completely modify our design from N+1 to 2N+2 infrastructure, so that we would never again experience this type of failure. But, I never forgot this idea of our natural tendency to assign blame. It’s hard to fight this cultural phenomenon because there is so much at stake for our operators, but I believe that it is far more important to look beyond blame. Frankly, it doesn’t matter in the immediate aftermath of an incident. Priority #1 is to get operations back to 100%. How does a data center recover? How do you know when your business will be fully protected?
Data centers fail. It is important to understand the root cause and to make sure to fix the vulnerability.
Life Cycle of an Outage
Now I don’t mean to offend anyone, but I do make fun of the communication life cycle that we all go through with every major incident. Of course, we know this is a very serious business, and we live and breathe data center 24 hours per day. But sometimes we need to take a break from the insanity and realize that we’re all in this together. So, here is what I consider to be the communication life cycle of our customers. And often, it’s the same response we see from the Executive Teams!
Stage 1: SURPRISE. Are you kidding? This just happened at your data center? I didn’t think this could happen here! Are my servers down?!?
Stage 2: FEAR. What is really happening? Is it worse than you are telling me? What else is at risk? What aren’t you telling me? Are you going to experience a cascading failure and take down my entire environment?
Stage 3: ANGER. How could this possibly happen? I pay you thousands (or millions) of dollars every month to ensure my uptime! You’re going to pay for this! This is a violation of my SLA.
Stage 4: INTERROGATION. Why did this happen? I want to know every detail. You need to come to my office to explain what happened, lessons learned and why it will never happen again! Where is your incident report? Who did what? And why did it take you so long to notify my staff? Why didn’t you call me directly, before I heard about it from someone else?
Of course, the “not so funny” part of this life cycle is that in reality, all of these reactions are valid. We need to be prepared to address every response, and we truly need to become better operators with every incident.
Operational Priorities
After 12 years of industry growth, many phased expansions into existing infrastructure and major design modifications to increase reliability, I have found that the majority of my time and effort always remains our risk management of the data center as it relates to uptime. Data centers are not created equal. There are many different design strategies and acceptable levels of risk, such as N+1, 2N, 2N+2, etc. However, our common goal as operators is to mitigate risk, address incidents quickly and thoroughly, and return the facility to its original, normal condition, with full redundancy.
The following eight areas represent what I consider to be the most important factors contributing to a data center’s ability to deliver a very high level of operational excellence:
• Staffing. Experience matters. I love to hire Navy nuclear technicians, because they are so disciplined. But, my favorite interview question more than any other, is to ask potential candidates about the incidents they have experienced in the data center. I want people who have lived through the fire. I want to know how they acted under pressure, what went wrong and what surprises they faced. The more difficult the incidents were, the more I appreciate them! There is no substitute for experience, and there is no way to gain experience other than one incident at a time. I also believe that it’s important to have 24×7 technical staff at the data center. Even with sophisticated control systems, there are many, many instances that require human intervention and on-site analysis/decision making, usually within minutes.
• Training. Do you train by process or by trial? It’s important to do both. How do you practice casualty control drills? I like to involve the entire operations staff when we commission a new phase, because we can throw in unexpected failures and test the staff without live load. I also like to thoroughly review every incident with the entire staff during a weekly training meeting, so that they can learn from real-world experiences. Training assessment should be part of every technician’s annual review, with merit given for mastering various areas of the data center operation.
• Resources. I personally prefer in-house expertise and first-level response, but only because design and construction are core in-house disciplines with self-performed labor. During a recent underground cable fault that lost an entire one megawatt UPS feeder, all the loads transferred to alternate UPS sources under a distributed redundancy topology, but the fault created a heat sink with two additional megawatts at risk that we couldn’t cool. With a literal time bomb on our hands and wire temperatures approaching 200°F, we engaged almost 40 in-house electricians to work 24-hours straight in order to run a new overhead feeder and commission it in order to vacate the underground duct bank and cool the environment.
Of course, staffing doesn’t need to be in-house. But it’s important to have immediate access and key contacts at any moment’s notice. This can be suppliers, service contractors or engineers. I have particularly found that key equipment factory engineers have a wealth of knowledge–if you can gain access to them during an incident.
• Incident Reporting. Incident reporting should be the lifeblood of every data center operator. What kind of visibility do they have? Are they reviewed and approved by Operations, Engineering and Executive staff? I personally review, comment on and approve every incident within the data center. Do you share your incident reports with customers? Some operators may prefer to provide a Summary Report, but we should always be willing to share the entire report to any customer that requests one. Another important detail is follow-up. We tend to be very good at documenting initial incidents, but we struggled with all the follow-up as it related to engineering, vendor support and further testing. If your technicians are always putting out fires, it’s difficult to stay focused on the follow-up. For this reason, we initiated a separated SaaS application called FrontRange that allows us to assign tasks with timed escalation for every follow-up item.
• Escalation. Every incident management protocol needs clear escalation channels. What is critical vs. minor? How detailed is your notification and escalation policy? Is re-training frequent due to non-compliance with escalation procedures? Do you have an escalation process that automatically includes engineering staff? Do you include key vendors within your internal escalation process? Do you have automatic dialing so that you can reach multiple sources within minutes with bridge lines? Do you have an incident manager separate from a communication manager? How fast can your staff mobilize, and do they know when to escalate? Is everyone trained regularly?
• Communication. What is your protocol for controlled dissemination of information? Do you have a dedicated communications manager? This may be part of your NOC staff or a dedicated operations staff member with technical knowledge. How will clients be notified during an incident? Do you allow clients direct visibility to equipment status? Do you set up bridge calls with automatic dialers to affected customers for direct communication during events? Do you have a timed protocol to deliver incident reports with 24 or 48 hours? Do you have a communication protocol for your executive team or account managers so they can also contact your customers or at least have knowledge of what is happening? Sometimes it is just as important to communicate with your internal staff as it is your customers.
• Back-up Plans. Can you provide examples of when the unexpected happened? What are your contingency plans? The data center design has back-up redundancy, but what about operational back up with staffing, suppliers, engineering resources and spare parts? You need basic support like food, clothes and sleep. We’ve experienced needs to keep qualified supervisors or directors on-site just to help with MOP-writing or operational commissioning after a break-fix, yet often these staff members can be completely exhausted.
• Top 10 Incidents. One of the most challenging sales support meetings I ever attended was for a Fortune 100 company. The CIO explained that they had never used colocation outsourcing in the past, and they were particularly concerned with our ability to handle incidents efficiently and communicate clearly to their teams exactly what was happening on a real-time basis. Of course, I am proud of our process and procedures around incident management, and I quickly described many of the ideas that I have touched on within this article. Then he surprised me. He asked me if I could name the Top 10 incidents we’ve had in our data center, what the root causes were, and what engineering changes or process changes we made as a result. I quickly responded by saying “yes, I am pretty sure I know most of these.” So he stated that we would like to know on the spot, because that knowledge off the top of my head from an executive staff member would clearly demonstrate that these issues are important and top of mind to everyone in operations. We spent the next 2 hours talking through each incident as best as I could remember. I must admit that although I named ten incidents, they probably weren’t the top ten over the past ten years. And it was an incredibly stressful meeting for me! But it was an awesome teaching moment for me and my staff.
Conclusion: Our Industry Can Be Better
We all need to know the incidents that shape our data center. We need to qualify improvements to the data center through our incident management process, and we need to be able to share these experiences with both our staff and our customers and with other operators.
Placing blame takes a back seat to identifying root causes and preventing recurrence.
I encourage every operator or data center provider to join the Uptime Institute Network. This is not a sales or vendor organization. It’s an operator’s organization with a commitment from all members to protect information of other members. Here are just a few of the benefits of the Network:
• Learning experiences from over 5,000 collected incidents from members
• Abnormal incident trending that allow members to focus resources on areas most likely to cause downtime
• “Flash” reports or early warning bulletins that could impact other member’s facilities
• Cost savings resulting from validation of equipment purchases or alternative sourcing options
• Tours of Network member data centers with the opportunity to apply ideas on best practices or improvements
• Access to member presentations from technical conferences
Sharing information can help find new ways of preventing old problems from causing issues.
I am also hoping to challenge our industry. If we can become more transparent as operators within a common industry, we will all become better. Our designs and technology may be different, but we still share a very common thread. Our common goal remains the confidence of our industry through uptime of our facilities.
Jason Weckworth is senior vice president and COO, RagingWire Data Centers. He has executive responsibility for critical facilities design and development, critical facilities operations, construction, quality assurance, client services, infrastructure service delivery and physical security. Mr. Weckworth brings 25 years of data center operations and construction expertise to the data center industry. Previous to joining RagingWire, he was owner and CEO of Weckworth Construction Company, which focused on the design and construction of highly reliable data center infrastructure by self-performing all electrical work for operational best practices. Mr. Weckworth holds a bachelor’s degree in Business Administration from the California State University, Sacramento.
https://journal.uptimeinstitute.com/wp-content/uploads/2014/09/07.jpg4751201Kevin Heslinhttps://journal.uptimeinstitute.com/wp-content/uploads/2022/12/uptime-institute-logo-r_240x88_v2023-with-space.pngKevin Heslin2014-09-24 07:54:372014-09-24 07:54:37Data Center Outages, Incidents, and Industry Transparency
Involving operations at the beginning of a data center capital project is a good way to reduce TCO and gain other benefits
By Lee Kirby
As the data center industry grows in geographic breadth and technological sophistication, it is natural that design professionals, owners and operators pay attention to the capital-intensive effort of designing and building a new facility. This phase, however, is a very small portion of the life of a data center.
It is intuitive to consider a project’s development in a linear manner: one thing leads to another. In a relatively young industry, when we use terms like design-build-operate, it is easy to slip into a pattern of thinking of Operations as the last group to come to the table when building a data center. In fact, the opposite is true, and it is time to change the way we think about operations. Phrases like “start with the end in mind” may seem like platitudes but speak to the need for broad changes in how we think about—and plan for—data center operations. When launched at the beginning of the design process, an operations-focused approach ensures that the enormous capital investment made in a data center will produce the most efficient returns possible.
In order to change this kind of thinking, we can begin with concepts that have broad acceptance and significance in the industry and apply the principles to operations. Whether it is a new build, retrofit, or expansion, all design-build activity is really just a form of change management: a point in time with actions that must be managed to reduce risk and ensure uptime. Furthermore, operations is an overarching continuum that provides consistency once a data center is in production. It provides discipline and rigor with change management procedures. Ultimately, ensuring uptime is the responsibility of Operations; with that responsibility should go the authority and the role of active participant from the very beginning. Organizations that understand this model establish a mindset that Operations is the customer, which changes the communication dynamics and ensures openness and unity of effort.
Unfortunately, too many data centers have to make significant changes in their first year after substantial completion. Even if the changes are not as extreme as rebuilding infrastructure, there can be enormous costs—both in terms of rework and ongoing loss of efficiency. Most of these costs could be avoided if Operations is asked to provide critical feedback on facility maintainability during the design phase. This input ensures that the original design considers the long-term costs of maintenance. The Value Engineering (VE) process has its benefits, but it tends to focus just on the first costs of the build. If VE is performed without Operations input, increased costs over the life of the data center may dwarf any initial savings realized from the VE changes.
Integrated Design-Build Project Plan
A typical data center design-build process has the following phases:
Pre-construction
Design
Construction
Commissioning
Turnover
The timeline and key milestones for design-build do not need to change. What does need to change is the understanding of the level of activity required by the Operations group to ensure that production environment risk is minimized. This understanding can only be gained when Operations actively participates in the project from the very beginning. The following roadmap illustrates an optimal approach to the traditional design-build phases, and expands those phases to include the key operations activities that must be accomplished concurrently. The integrated approach will successfully prepare the project and the Operations team for turnover into a production environment. The roadmap provides context and shows the path that will ensure an organization achieves industry standards and experiences the full benefit of consistently implemented industry best practices. This summary also identifies the three key milestones to achieving Uptime Institute Tier Certifications.
Pre-construction Phase
Data center strategy
Define measures of success, service level agreements (SLAs), key performance indicators (KPIs)
Develop escalation policies and protocols including contact lists (addressing increasing levels of
severity including alerts, events, and incidents)
Establish inventory of critical spare parts and consumables
Develop housekeeping policy and Critical Environment work rules
Develop Critical Environment work approval and change management processes (normal, expedited,
and emergency)
Develop Critical Environment work approval procedures and forms
Establish risk windows and allowable activities
Develop predictive maintenance program
Commissioning Phase
Maintenance and Operations teams readiness
Commission operations procedures (SOPs, MOPs, and EOPs)
Conduct infrastructure systems operations training
Conduct emergency operations drills and systems recovery training
Conduct safety training and on-site safety planning
Develop on-site safety plans
Conduct key vendor/contractor on-site training
Populate MMS and other key operating systems
Milestone: Tier Certification of Constructed Facility (TCCF)
Turnover Phase
Turnover and transition to production operations
Review commissioning results and prioritize punch list
Implement operations management program
Refine operations procedures (SOPs, MOPs, and EOPs)
Exercise all procedures to ensure optimal effectiveness
Milestone: Tier Certification of Operational Sustainability (TCOS)
Data Center Strategy
The scenario: a data center is going to be built. The organization has allocated capital budget and is accepting bids from various entities depending on whether it is a design-bid-build or design-build project. At this point in time, the business requirements are fresh in the minds of the project sponsor and the business units, as they only recently completed the justification exercise to get capital budget approval. Now is the best time to make key decisions on how to operate and maintain the new data center. Key organizational decisions made at this stage will drive subsequent activity and alignment of the design and operations disciplines throughout the rest of the project. Taking a holistic, operations-focused approach from the start will ensure that the large facility investment about to be made will be implemented in a manner that reduces risks and increases return.
It is critical to clearly define what success looks like to the Operations group. Their criteria will drive service-level expectations to all stakeholders, and the organization will use associated key performance indicators (KPI) as a quantitative means of assessment. With the key measures defined, it is important to thoughtfully develop a concept of maintenance and operations based on industry best practices to achieve recognized standards for Operational Sustainability. These decisions will define fundamental organization structure and determine what functions will be provided by contractors and which will be performed by in-house staff. Creating this up-front structure and definition will eliminate wasted effort in the planning stages since contracts (internal and external) can be developed and managed appropriately from the start. Going through this process will force the team to make most of the essential decisions and lay the foundation for a successful maintenance and operations program. This exercise will generate a detailed responsibility matrix that provides clarity and drives organizational efficiencies.
Management and Operations Planning
During the design phase, Operations has two significant roles:
Management and Operations design review
Management and Operations planning
During design review, the Operations team must conduct a thorough failure analysis and maintenance analysis. According to Uptime Institute’s standards, Tier IV Certified data centers are designed to detect, isolate, and contain failures. All other Tier objective data centers should conduct failure analysis as an important planning factor. Organizations must plan for consequence management in the event of a failure that leads to loss of redundancy and not an outage. A thorough failure analysis allows the data center to effectively prioritize emergency response procedures and training and may lead to design modification if the cost is justified.
Maintenance analysis determines not only if the facility can be maintained as designed, but also at what cost. The total cost of ownership of a data center can increase dramatically if the design fails to accommodate the most effective maintenance practices. Once these analysis efforts are complete, and the results incorporated in the design, planning begins.
Next, the Operations team must develop operating standards based on site mission, reliability and availability requirements, and industry best practices. Establish supporting contracts with vendors, put subcontracts out to bid, and define staffing plans based on the requirements that were decided on in the strategy phase. Defining shifts and staff qualifications affords the talent acquisition team time to secure the best possible personnel resources.
If the organization chooses to acquire an automated maintenance management system, this is the time to make that acquisition. The information that will be flowing in all subsequent phases should be entered into the system in preparation for the production environment. It is critical at this point to define the processes the organization will use to record and access the key information that is needed to maintain the environment. Whether in the presence or absence of an automated system, success depends on thoughtfully engineered procedures.
Management and Operations Program Development
The construction phase is more than just time to build. The infrastructure design is complete, and the management and operations plan is in place. The general contractor now focuses on building to meet the design specifications while the Operations team focuses on building the program as planned to meet the uptime requirements. Both teams are going to be very busy and must put all the key components in place so that they are ready for commissioning.
Also during this time, emergency operating procedures should be written and the training program defined. The goal is to train the staff to perform each critical function on Day One, so it will need to run through emergency response drills during commissioning. The MMS and documentation libraries need to be populated and version control procedures need to be employed to ensure accuracy. All documents, site work rules, and key procedures should be defined and documented with sign-off by all stakeholders. It is critical to have change management procedures in place to ensure coordination between the construction team and the Operations team. Frequently, data centers are built with some variance from the construction documents. Some of these changes are beneficial and some are not, so any deviations must be reviewed by Operations.
Management and Operations Readiness
The commissioning phase is the best time to test the critical infrastructure, test the critical operations procedures (EOPs, SOPs, and MOPs), and train the Operations staff. Safety is the first priority; staff should be thoroughly trained on how to operate within the environment and know how to respond to any incident. All members of the team should know how to properly use the systems that have been implemented to accurately store and process operations data. While in a non-production environment, operating procedures can be tested and retested and used as a means of training and drilling staff. The goal is to mature the team to the point that reacting to an incident is second nature. Exercising the entire staff in the most likely events scenarios is a good way to develop proficiency in taking systems on- and off-line without any risk to personal safety or system integrity. Having the Operations team perform some of the commissioning activities as further training is becoming a more common industry practice.
Management and Operations Turnover and Transition
The construction project has reached substantial completion. The result of working through an integrated design-build project approach is that the Operations team is now trained and ready to assume responsibility for the ongoing operations of the data center. The organization can deploy technology without risk and meet or exceed service levels from Day One as a result of the careful planning, development, training, and testing of the operations management program.
However, even though the operations program is ready just as construction is substantially complete, there is still more work to be done. The construction team has a punch list and the Operations team does too. The first year of operations will require the completion of standard operating procedures and methods for routine maintenance. Up to this point, the focus of building the program was training staff to operate and react to incidents. Now the focus will be on establishing a tempo and optimizing day-to-day procedures between various stakeholders. The data center environment is never static; continuous review of performance metrics and vigilant attention to changing operating conditions is critical. Procedures may need to be refined or redefined, training refreshed, and systems fine-tuned with a continuous quality improvement mindset.
Conclusion
However well designed a data center appears on paper, ultimately its success stands or falls on day-to-day operations over the lifespan of the facility. Successful operations over the long term begins with having—at every stage of the planning and development process—an Operations advocate who deeply understands the integrated mesh of systems, technology, and human activity in a data center. By starting with the end in mind and giving Operations a strong voice from the outset, organizations will reap the benefits of maximum uptime, efficiency, and cost effectiveness year after year.
The video below features author Lee Kirby, along with Google’s Vice President of Data Centers, Joe Kava, discussing how to start with the end in mind by involving data center operations teams starting with the design phase.
Lee Kirby is Uptime Institute’s CTO. In his role, he is responsible for serving Uptime Institute clients throughout the life cycle of the data center from design through operations. Mr. Kirby’s experience includes senior executive positions at Skanska, Lee Technologies and Exodus Communications. Prior to joining the Uptime Institute, he was CEO and founder of Salute Inc. He has more than 30 years of experience in all aspects of information systems, strategic business development, finance, planning, human resources and administration both in the private and public sectors. Mr. Kirby has successfully led several technology startups and turn-arounds as well as built and run world-class global operations. In addition to an MBA from University of Washington and further studies at Henley School of Business in London and Stanford University, Mr. Kirby holds professional certifications in management and security (ITIL v3 Expert, Lean Six Sigma, CCO). In addition to his many years as a successful technology industry leader, he masterfully balanced a successful military career over 36 years (Ret. Colonel) and continues to serve as an advisor to many veteran support organizations. Mr. Kirby also has extensive experience working cooperatively with leading organizations across many Industries, including Morgan Stanley, Citibank, Digital Realty, Microsoft, Cisco and BP.
https://journal.uptimeinstitute.com/wp-content/uploads/2014/07/start-wth-the-end-in-mind-cover.jpg4751201Mark Harrishttps://journal.uptimeinstitute.com/wp-content/uploads/2022/12/uptime-institute-logo-r_240x88_v2023-with-space.pngMark Harris2014-09-18 15:37:492014-11-06 12:42:07Start With the End in Mind!
Using relevant technologies and techniques to develop an optimized system for addressing data center PQ concerns
By Kuochuan Chu
For years, engineers and data centers operators have implemented various strategies to improve power quality in mission-critical facilities. We have found, however, that good power quality requires a solid grounding system. By efficiently utilizing the essential power distribution component of a data center—the transformer, and properly applying phase-shift techniques, harmonic distortion problems can be resolved, significantly improving the overall energy efficiency of a computer room. For our grounding system, we used the structured color-codes management system, so that the power quality and grounding systems can be fully integrated, improving the overall performance and robustness of the data center infrastructure.
Good power quality is essential to reliable data center operation. Once power-related problems affect the overall infrastructure of a data center, the facility may fail, causing financial losses or interrupting years of research.
In recent years, our company planned, designed, and commissioned multiple data centers, and supported several research and development efforts. We also cooperated with manufacturers to develop products to improve overall power system performance and strengthen infrastructure management.
Relevant Research
IEEE Recommended Practice for Powering and Grounding Electronic Equipment (Emerald Book) notes that harmonic currents can cause alternating current (ac) motors and transformers to overheat. It also describes the use of passive or active filters and the transformer phase-shifting technique to offset phase-to-phase harmonic current. Therefore, when we developed our system architecture, we combined IEEE’s power distribution structure and the phase-shifting technique of a zigzag winding transformer to achieve harmonic reduction. We employed different zigzag winding combinations to generate various simulation results.1-5
In developing this article, we referenced the few technical articles that discuss the use of a transformer and phase shifting to eliminate harmonics distortion. Combining common transformer wiring methods and various phase-shifting combinations enabled us to develop an optimal transformer winding configuration.6 (See Figure 1.)
Figure 2. Transformer efficiency comparison chart
High levels of harmonic distortion can affect many vital components of the power system, including transformers, and may cause the temperature of motor cores to rise significantly. Using lower iron-loss cores is the only way to ensure high harmonic resistance performance, and also meet carbon dioxide emissions requirements. 5, 7-9 (See Figure 2.)
Figure 3. Core temperature comparison
Harmonic currents caused by source voltage distortions typically cause significant heating in ac motors, transformers, and any magnetic electrical device that employs ferrous metal in the flux path (See Figure 3). With increasing current frequency, stator windings, rotor circuits, and stator and rotor laminations tend to dissipate additional heat due primarily to eddy currents (exponential loss), hysteresis (linear loss), and, to a lesser degree, skin effect (linear loss). Leakage (e.g., stray) fields set up by harmonic currents in stator and rotor end windings also produce extra heat in any surrounding or nearby metal, according to Arrillaga, et al. [B3]) chapter 4.5.3.2.3.
Problem Definition
Data center operations differ from electronics operations. In data centers, enterprises add IT equipment to meet business demand, and the specifications of equipment installed by leased tenants may be unknown to operators. Therefore, huge financial losses or other damages could result if IT equipment is selected and installed without considering the use of passive/active harmonic filters to handle harmonic distortion. (See Figures 4 and 5.)
Figure 4. Commonly seen data center power system harmonics (voltage) (K Factor 38.81)
Figure 5. Commonly seen data center power system harmonics (Current) (K Factor 39.26)
Also when IT equipment is modified, added, or removed, the capacity of the filter must be adjusted to match the new system’s capacity and levels of harmonic distortion. The facility owner may object to this arrangement as well as to the extra costs. Electrical engineers must develop power quality strategies that can meet these objections.
Method: Isolation and Elimination (IE)
Focusing on the power system architecture and the harmonic problems discussed previously, our team used Matlab Simulink software to simulate power quality problems, test solutions, and identify an optimum solution to develop new products to test in an experiment.
Figure 6. Overall power quality strategy for environmental protection and energy saving
First, we designed a power system architecture that isolated IT equipment from power equipment and that also used new low-temperature core products to help meet environmental protection, energy saving, and carbon reduction requirements as well as reduce required HVAC energy consumption. An amorphous dry-type low temperature K Type zigzag Dz0/2 winding transformer with isolation feature was the main component of this system. See Figures 6-12; Figures 11 and 12 show before and after performance characteristics.
In the past, project grounding concepts were not clearly defined, and engineers would not be familiar with actual site conditions, resulting in confusing grounding system connections. IEEE 1100 is rigorous when it comes to IT equipment grounding; therefore, achieving clean grounding across systems can be a major challenge. It is essential to establish an overall grounding system color code management to avoid wiring mismatches that lead to system downtime.
Outdoor wiring and conduit should bond to the building’s main grounding system to assure the concept of “all grounding and bonding terminated at single mass of earth point.” The overall grounding system comprises branches of each functional grounding system from the main grounding system. Connections between systems should not be improperly mixed in order to achieve isolated grounding functionality. Color coding differentiates between systems (See Figure 13).
The outdoor equipment enclosure grounding should be location specific, rather than being part of the common grounding system. For example, the chassis of the distribution panel on the rooftop should be bonded to adjacent outdoor equipment to ensure equipotential grounding and bonding (See Figure 14).
In addition, lightning risk should be evaluated in accordance with International Electrotechnical Commission (IEC) 62305-2 Protection standards, and the results should be used to build lightning protection equivalent to the grounding. Color coding the ground wire system can minimize problems in the future. Figure 15 is a recommended system.
Cost-benefit Analysis
At present, the power system architecture is only a single-layer. Starting in the second half of next year, there will be several newly constructed data center projects that adopt the IE method in dual-layer power system architectures, in which the IT equipment will use Amorphous K-20 grade with Dy and Dz zigzag winding transformers, and the power equipment will use K-4 grades with Dy and Dz zigzag winding transformers. We shall obtain test data during project commissioning to verify the cost benefit.
IE can be applied to different load characteristics by way of traditional power transformer windings to achieve power quality improvement. Not only we can increase the functionality of a transformer, which is already on the required equipment list, but we can also achieve harmonic reduction.
References
1. Design of Delta Primary – Transposed Zigzag Secondary (DTz) Transformer to Minimize Harmonic Currents on the Three-phase Electric Power Distribution System. Chairul Gagarin Irianto, Rudy
2. Three Phase Transformer Winding Configurations and Differential Relay Compensation. Lawhead, Larry; Hamilton, Randy; and Horak, John. Basler Electric Company.
3. IEEE Recommended Practice for Powering and Grounding Electronic Equipment (IEEE std 1100-2005)
4. A Probabilistic Analysis on the Harmonic Cancellation Characteristics of the Scott Transformer. Mazin, Hooman Erfanian and Gallant, Joey. Department of Electrical and Computer Engineering, University of Alberta, Edmonton, Canada.
5. Transformer Based Solutions to Power Quality Problems. de León, Francisco and Gladstone, Brian, Plitron Manufacturing Inc, and van der Veen, Menno, Ir. buro Vanderveen.
6. Power System Harmonic Effects on Distribution Transformers and New Design Considerations for K Factor Transformers. Jayasinghe, N.R; Lucas, J.R; and Perera Setiabudy, K.B.I.M; and Hudaya, Chairul.
7. Review and The Future of Amorphous Metal Transformers in Asia 2011 edition by Asia Energy Platform 2011
8. The Performance of Silicon and Amorphous Steel Core, Distribution Transformers at Ambient and Cryogenic Temperatures. Bodger, Pat; Harper, David; Gazzard, Matthew; O’Neill, Matthew, and Enright, Wade.
9. Wide Temperature Core Loss Characteristic of Transverse Magnetically Annealed Amorphous Tapes for High Frequency Aerospace Magnetic. Niedra, Janis N. and Schwarze, Gene E.
Figure 8. (Left) Secondary side of transformer. Figure 9. (Right) Primary side of transformer.
Figure 10. Total effect of the high-voltage side
Figure 11. AMVDT_1000 kVA Dz0 Zigzag Dry Type HV Transformer/K-20 AMVDT 30 VA Dz0/2LVTransformer
Figure 12a. System before improvement
Figure 12b. System after improvement
Figure 13. Building grounding
Figure 14. Outdoor grounding
Figure 14. Outdoor grounding
Kuo-Chuan Chu is a licensed PE, who founded Sunrise Professional Engineering Company in 1994. He served as the president of Taiwan Professional Electrical Engineering Association from 2005 to 2007, obtained APEC and international engineer qualification in 2008, and served as chairman of the Taiwan International Project Management
Association from 2009 to 2010.
Mr. Chu possesses a wide range of professional licenses and certifications including Uptime Institute Accredited Tier Designer (ATD). He was the first ATD data center designer in Asia.
Some representative projects include Taiwan Mobile’s Cloud IDC project (the first Uptime Institute Tier III Constructed Facility in North Asia, NCHC National Center for High-Performance Computing, China Medical University Hospital, Changhua Christian Hospital, and Yuan-lin branch LEED-NC/HC.
https://journal.uptimeinstitute.com/wp-content/uploads/2014/09/17.jpg4751201Kevin Heslinhttps://journal.uptimeinstitute.com/wp-content/uploads/2022/12/uptime-institute-logo-r_240x88_v2023-with-space.pngKevin Heslin2014-09-08 13:00:062014-09-15 11:17:12New System Combats Data Center PQ Concerns
By Christopher Muller, Dr. Prabjit Singh, G. Henry White, and Paul Finch
End users have worried about the reliability of electronic gear almost since the introduction of the circuit board. Restrictions on Hazardous Substances (RoHS), or lead-free, manufacturing regulations for electronic equipment that went into effect in 2006 only served to increase their concerns. Today companies selling consumer electronics, industrial process, and control systems products in the European Union and a few other European nations that adhere to RoHS regulations must be aware of a number of additional obligations. RoHS-compliant datacom and IT equipment, in particular, are at risk in locations with poor ambient air quality. Some data centers in urban locations have reported failures of servers and hard disk drives caused by sulfur corrosion.
As a result, new industry-accepted specifications include particulate contamination limits that specify the quantity and deliquescent relative humidity of dust. Additionally, research by ASHRAE’s Technical Committee 9.9 for Mission Critical Facilities, Technology Spaces, and Electronic Equipment led to the publication of a white paper on contamination guideline for data centers1 and the formulation of new gaseous contamination limits used to update International Society of Automation (ISA) Standard 71.04-2013.2 This research also led to the publication of an International Electronics Manufacturing Initiative (iNEMI) position paper3 and efforts to update the Chinese data center design guide GB 50174-2008.4
The Lead-Free Transition
Industry did not foresee one failure mechanism caused by the transition to lead-free products mandated by RoHS. Products with an immersion silver (ImmAg) surface finish will creep corrode in environments that electronic equipment manufacturers consider to be high sulfur (ISA Class G2 or higher).5 In high-pollution locations around the world, as a result, the number and types of corrosion failures have increased dramatically. The common component failures include hard disk drives (HDD), graphic cards, motherboards, DIMMs, capacitors, and transistors. In fact, the rate of failure has become so severe that many of the world’s leading IT and datacom equipment manufacturers have changed their warranties to include requirements for the control of corrosion due to gaseous contamination:
• Dell PowerEdge R310 Rack Server – The following airborne contaminant level supersedes the information that is present in the Getting Started Guide of your system: Airborne Contaminant Level Class G1 as defined by ISA-S71.04-1985.6
• IBM Power7 Server Series – Severity level G1 as per ANSI/ISA 71.04-1985, which states that the reactivity rate of copper coupons shall be less than 300 angstroms (Å)/month (≈ 0.0039 micrograms per square centimeter-hour
[μg/cm2-hour] weight gain). “In addition, the reactivity rate of silver coupons shall be less than 300Å/month (≈ 0.0035 μg/cm2-hour weight gain). The reactive monitoring of gaseous corrosivity should be conducted approximately 2 inches (5 cm) in front of the rack on the air inlet side at one-quarter and three-quarter frame height off the floor or where the air velocity is much higher.7
• HP Integrity Superdome 2 Enclosure – Specification: Gaseous contaminants must be at the G1 level or less as defined by ISA Standard ISA-71.04-1985.8
Contamination Control Process
With the changes to IT and datacom equipment mandated by various RoHS directives, data center owners, managers, and operators should include an environmental contamination monitoring and control section as part of an overall site planning, risk management, mitigation, and improvement plan.
The three parts of this plan should comprise:
1. Considerations for the assessment of the outdoor air and indoor environment with regards to corrosion potential. ISA Standard 71.04 can be used to provide site-specific data about the types and levels of gaseous contamination in the amount of corrosion being formed. Corrosion classification coupons (CCCs) can be used as a survey tool to establish baseline data necessary to determine whether environmental controls are needed and, if so, which ones.
2. A specific contamination control strategy. Corrosion in an indoor environment is most often caused by a short list of chemical contaminants or combination of contaminants. The contaminants present in a specific area are highly dependent on the controls put in place to mitigate them. Most of this would involve the selection and application of the appropriate chemical filtration systems to clean both the outdoor air being used for pressurization and/or ventilation as well as any recirculation air.
3. A real-time environmental monitoring program based on the severity levels established in ISA Standard 71.04. Real-time atmospheric corrosion monitors can provide accurate and timely data on the performance of the chemical filtration systems as well as the room air quality.
Often the relationship between corrosion levels and hardware failures in data centers is overlooked or unknown. However, AMD, Cisco, Cray, Dell, EMC, Huawei, Hitachi, HP, IBM, Intel, Oracle, Seagate, SGI, and others are working hard to increase awareness of the problem and it solutions. These manufacturers are also working to develop successful corrosion monitoring and control programs.
Data Center Design and Operation Requirements
Data centers are dynamic environments where maintenance operations, infrastructure upgrades, and equipment changes take place regularly, leading to possible introduction of airborne contaminants. Data centers also house other contaminants, such as chlorine, that can be emitted from PVC insulation on wires and cables if temperatures get too high.
However, outdoor air used for ventilation, pressurization and/or cooling remains the primary source of airborne contaminants. The growing use of air-side economizers for free cooling, means that even data centers located in regions without major air quality concerns may struggle to maintain an environment conducive to the protection of sensitive electronic equipment. Air used for any of these purposes should be cleaned before being introduced into the data center.
To meet warranty requirements for new IT and datacom equipment, data center owners and operators must take action to eliminate airborne contaminants from these sources. These steps include:
• Measure the reactivity (corrosion) rates inside the data center and in the outdoor air
• Seal all doors, windows, and wall penetrations in the data center
• Install room pressure monitors if the data center envelope is designed to be
positively pressured
• Measure airflow at the supply and exhaust air grills, and at each computer
room air-conditioning (CRAC) unit
• Develop a temperature and humidity profile
It is incumbent upon data center managers to maintain hardware reliability by monitoring and controlling both the gaseous and particulate contamination in their data centers. ASHRAE, in cooperation with many of the world’s leading manufacturers of computer systems, has developed guidelines that summarize the acceptable levels of contamination (See Table 1).
Table 1. Particulate and gaseous contamination guidelines for data centers
Environmental Assessments
ISA Standard 71.04-2013 Environmental Conditions for Process Measurement and Control Systems: Airborne Contaminants describes a simple quantitative method to determine the airborne corrosivity in a data center environment. This method, called “reactivity monitoring” involves the analysis of copper and silver sensors that have been exposed to the environment for a period of time to determine corrosion film thickness and chemistry. Silver reactivity monitoring done as part of the assessment provides a complete accounting of the types of corrosive chemical species in the data center environment.
ISA 71.04 classifies four levels of environmental severity for electrical and electronic systems providing a measure of the corrosion potential of an environment (See Table 2). The overall classification is based on the higher of the total copper and silver reactivity rates.
Corrosion Monitoring
Many options can be considered with respect to air quality monitoring for data center applications. Proper assessment of environmental conditions in the data center requires monitoring of outdoor and ambient air at various locations inside and outside the data center. In addition, consideration should be given to room size and layout to determine the proper placement and type of CCCs, which can help determine compliance with air-quality specifications, and real-time atmospheric corrosion monitors (ACMs). Data from the ACMs can help provide a statistically valid environmental assessment of corrosion rates and of corrosion control strategies. Either monitoring technique may be used to provide the data necessary to troubleshoot and mitigate contamination issues inside the data center.
Table 2. Classification of reactive environments
CCCs are typically used for an initial survey of ambient (outdoor) air quality and the data center environment and may be used on a continuing basis to provide historical data. This is especially important where equipment warranties specify establishing and maintaining an ISA Class G1 environment. Seasonality is a major issue, and outdoor air should be assessed at different times during the year.
Real-time monitoring may also be used but should be limited to the data center environment. Where corrosion problems have been identified, ACMs placed in a number of locations can help determine if contamination is widespread or limited to a specific area. Once a baseline has been established, some of the monitors could be redeployed around the problem area(s) to gauge the effectiveness of contamination control strategies. Once the data center environment is under control and meets the conditions set forth in the manufacturers’ warranties, one can determine the best permanent ACM locations for specific needs.
There is general confidence that corrosion monitoring can be used to identify contaminant types, e.g. active sulfur, sulfur oxides, and inorganic chloride. These determinations can be verified using independent sources of environmental data (air pollution indices, satellite data, etc.) to verify the results obtained from corrosion monitoring.
Contamination Control Case Studies
The following sections include the results of environmental assessments, design, and application of chemical filtration systems and ongoing monitoring of mission critical areas from a number of data centers around the world where corrosion-related electronic equipment failures were reported.
Case Study 1. ISP Data Center
A representative of an internet service provider (ISP) reported a number of equipment failures in one of its data centers. The primary IT equipment vendor determined that the majority of failures were due to sulfur creep corrosion, most likely caused by high levels of motor vehicle pollution.
Reactivity monitoring performed inside the data center and the adjoining UPS battery room according to ISA Standard 71.04 indicated a Class GX – Severe classification for both rooms, with high levels of sulfur contamination (copper sulfide, Cu2S) in both rooms and extremely high levels of chlorine contamination (silver chloride, AgCl) in the battery room. These results are summarized in Table 3.
Table 3. CCC monitoring results – baseline data
Based on these results and advice from the IT equipment vendor, the ISP facility manager added chemical filtration inside the data center and the battery room. Based on the size of the two spaces and the amount of air that needed to be cleaned, the data center required nine stand-alone self-contained chemical filtration systems and the battery room required two systems. These systems were optimized for the control of the acidic corrosive contaminants identified by the CCC monitoring.
Table 4. CCC monitoring results – with chemical filtration systems installed
Within a few days after the chemical filtration systems were installed and operational, dramatic decreases in the copper and silver corrosion rates were observed in both rooms with each now showing severity levels of ISA Class G1 (See Table 4). Further, there was no evidence of either sulfur or chlorine contamination inside either room.
Case Study 2. Internet Data Center
A small data center for a global consulting and IT outsourcing firm was experiencing repeated failures of a single component. The manufacturer performed monitoring with CCCs and found that the continuing failures were due to high sulfur content in the ambient air. The firm installed a single air cleaning system to clean and recirculate this air within the data center and an ACM to gauge the effectiveness of the chemical filtration system.
Figure 1. Reactivity monitoring data before and after chemical filtration was installed.
Data from the ACM were continuously collected the week before the air cleaning unit was installed and the week after chemical filtration was in place. Examination of the copper data indicated a Class G1 environment throughout the monitoring period; whereas, the silver corrosion rate dropped from ISA Class G2 to ISA Class G1 (See Figure 1). No further equipment failures have been reported.
Case Study 3. Auto Manufacturer
An automobile company was planning to expand its manufacturing capacity by building a second production facility. Ambient air quality near its location was extremely poor due to high levels of motor vehicle pollution as well as significant industrial activity in the region. A large number of IT equipment failures had been experienced in the original production facility’s IT center, which resulted in the addition of chemical filtration systems and the use of several ACMs.
During the planning stage for this second production facility, the manufacturer decided to provide for chemical filtration and air monitoring in the design of the IT center to prevent corrosion problems inside the equipment rooms (See Figure 2).
The auto manufacturer started reactivity monitoring with ACMs at the time the IT equipment became operational, and the results indicated a significant reduction in the total amount of contamination in the IT center. However, the silver corrosion rates fluctuated around the Class G1/G2 breakpoint (See Figure 3).
After re-examining the layout of the IT center, it determined that significant amounts of untreated outdoor air were being introduced into the protected spaces through the main entrance.
Figure 2. Automotive manufacturer’s IT center layout showing location of chemical filter systems.
Although the silver corrosion rate was near the specified ISA Class G1, the owner and the IT equipment vendors agreed that steps should be taken to eliminate untreated outdoor air from the IT center Modifications to the facility were proposed and work is ongoing.
Case Study 4. Bank
The other three case studies describe the use of chemical filtration inside the protected spaces. In this example, the owner wanted to clean all the outdoor air that was being used to pressurize the data center space. This bank building was located in a major metropolitan area with high levels of sulfur contamination from coal-burning power plants as well as motor vehicle traffic.
Because the air quality was so poor relative to the IT equipment manufacturers’ air quality guidelines, air cleaning would be accomplished by:
1. Installing a chemical filtration system at the outdoor air intake of the existing HVAC system
2. Adding another chemical filtration system to deliver additional clean pressurization air under the raised floor in the data center to supplement the outdoor ventilation air
Figure 3. Reactivity monitoring data for an auto manufacturer’s IT center
3. Installing three standalone chemical filters systems inside the data center to provide for complete distribution of the clean air. Air monitoring after chemical filtration had been installed showed a tremendous improvement in the data center air quality. Average results from 15 monitoring locations indicated an ISA Class G1 environment for both copper and silver with no evidence of sulfur contamination. These results are summarized in (See Table 5).
A few locations showed ISA Class G2 severity levels, with no specific external or internal sources of contamination identified. Team members suggested moving the CA units to provide better air distribution in these locations in an effort to maintain Class G1 area throughout the data center. Monitoring with CCCs is ongoing.
Case Study 5. Telecommunications Company
This company experienced continuing problems with corrosion-related failures of switchgear and network cards in one of its mobile switching centers (MSC). A chemical filtration system reduced the number of failures per month from an average of 36 per month to ~20 after five months of operation. Although this represented a significant improvement, the owner wanted to improve this performance even further.
The chemical filtration system had been designed to deliver the specified amount of cleaned air to the MSC when running at 70% capacity. The system was adjusted to increase the amount of air delivered to the MSC. The system is now operating at 90% capacity and since then the number of failures has dropped below 10 per month (See Figure 4).
The IT manager is currently considering whether to add additional chemical filtration systems to see if corrosion-related failures can be eliminated altogether.
Figure 4. Reduction in MGW/MSS cards with corrosion failures.
Table 5. Reactivity monitoring results after addition of chemical filtration systems.
Case Study 6. Telecommunications Company 2
This company experienced problems with IT equipment failures and was not willing to provide space inside the data center for chemical filtration systems. It was also discovered that the existing HVAC system supplying ventilation air could not be modified to accept chemical filters. Therefore, the only option available was to replace the existing particulate filters installed in the CRAC units located inside the data center with combination particulate/chemical filters.
Before committing to upgrading all of the CRAC units serving the data center, the owner wanted to determine whether this was a practical and effective solution. As a test, the filters in one CRAC unit were replaced with these combination filters and reactivity monitoring was performed at the inlet of the CRAC unit and in the Cold Aisle supplied by this unit.
Reactivity monitoring performed with an ACM for several days prior to the installation of the new filters indicated an ISA Class G1 copper severity rate but a mid-to-high Class G2 rate for silver. After installation of the filters, the silver reactivity rate immediately fell almost 90% (See Figure 5). This result convinced the customer to put these combination chemical/particulate filters in the all of the remaining CRAC units. The data center has not reported additional equipment failures.
Conclusions
Data centers located in areas with high ambient air pollution, whether from stationary or mobile sources, can experience corrosion-related hardware failures due to the changes in electronic equipment first mandated by the implementation of the European Union (EU) RoHS regulations in 2002 and in more than a dozen countries since that time.
Figure 5. Performance of chemical filters in a CRAC unit.
These regulations, along with the continuing reductions in circuit board feature sizes and miniaturization of components necessary to improve hardware performance, makes today’s electronic hardware more prone to attack by airborne contaminants. Manufacturers have to maintain the reliability of their equipment; therefore, the need to control airborne contaminants and to specify acceptable limits in data centers is now considered to be critical to the continued reliable operation of datacom and IT equipment.
Increases in corrosion-related electronic hardware failures have led to new IT and datacom equipment warranties that require environmental corrosion (reactivity) monitoring and control of airborne contamination where necessary. These additional measures are especially important for urban areas with elevated pollution levels and for locations near industrial facilities, seashores, and other sources that could produce corrosive airborne contaminants.
ISA Standard 71.04 has been updated to now include silver corrosion monitoring as a requirement in determining environmental severity levels. Many manufacturers of datacom and IT equipment currently reference this standard in their site planning / preparation guidelines as well as their terms and conditions for warranty compliance. The addition of silver corrosion rates as a required metric serves to bridge the gap between ambient environmental conditions and the reliability of RoHS-compliant (lead-free) electronic equipment.
Ongoing research will serve to further refine Standard 71.04 both quantitatively and qualitatively. This along with continuing advancements in the monitoring and control of corrosive contaminants will help to prevent costly and potentially catastrophic failure of critical electronic equipment.
References
1. ASHRAE. 2011. 2011 Gaseous and Particulate Contamination Guidelines for Data Centers. Atlanta: American Society of Heating, Refrigerating, and Air-Conditioning Engineers, Inc.
2. ISA. 2013. ANSI/ISA 71.04-2013 (in print): Environmental Conditions for Process Measurement and Control Systems: Airborne Contaminants. Research Triangle Park: International Society for Automation
3. iNEMI 2012. iNEMI Position Statement on the Limits of Temperature, Humidity and Gaseous Contamination in Data Centers and Telecommunication Rooms to Avoid Creep Corrosion on Printed Circuit Boards
4. China National Standard GB 50174-2008: Code for Design of Electronic Information System
5. Muller, C.O. and Yu, H., “Controlling Gaseous and Particulate Contamination in Data Centers,” Proceedings of SMTA China South Technical Conference, Shenzhen, China, 2012.
8. Muller, C. and Yu, H., 2013. “Air Quality Monitoring for Mission Critical / Data Center Environments,” CEEDI White Paper on Data Center Monitoring Systems, China Electronics Engineering Design Institute, Beijing, China.
Chris Muller is the technical director and Global Mission Critical Technology manager at Purafil, Inc. (Doraville, GA), and is responsible for Purafil’s Data Center Business Development program as well as for technical support services and various research and development functions. Prior to joining Purafil, he worked in the chemical process and pharmaceutical manufacturing industries in plant management and quality assurance/quality control.
He has written and spoken extensively on the subject of environmental air quality and the application and use of gas-phase air filtration, corrosion control and monitoring, electronic equipment reliability, and RoHS and counts over 120 articles and peer-reviewed papers, more than 100 seminars, and 7 handbooks to his credit. Mr. Muller has edited chapters in two handbooks on the application and use of gas-phase air filtration, wrote the chapter on gas-phase air filtration in the NAFA Air Filtration Handbook and the chapter on airborne molecular contamination in the Semiconductor Manufacturing Handbook published by McGraw-Hill.
Mr. Muller has consulted on the development of environmental air quality guidelines in mission critical applications for companies such as Dell, Google, HP, Huawei, IBM, and Morgan Stanley. He has worked with the China Electronics Engineering Design Institute (CEEDI) to update China National Standard GB 50174-2008: Code for Design of Electronic Information System.
Dr. Prabjit (PJ) Singh is a senior technical staff member in the Materials and Processes Department in IBM Poughkeepsie, NY, with 34 years of experience in the metallurgical engineering aspects of mainframe computer power, packaging, cooling, and reliability. He has more than 36 patents and is an IBM Master Inventor.
Dr. Singh received a B. Tech. from the Indian Institute of Technology and an MS and Ph.D. from the Stevens Institute of Technology, all in the field of metallurgical engineering. Recently, he received a MS in microelectronic manufacturing from Rensselaer Polytechnic Institute and an MS in electrical engineering from the National Technological University. He is an adjunct professor of electrical engineers at the State University of New York at New Paltz.
Henry White joined HP in 1980, where he has mainly served in HP Focus on Customer Site Environment for product reliability, safety, and POR-like efficiencies. His experience in this area includes site-caused product corrosion, power quality, lightning protection, high-density data center cooling, electrical codes, safety, and regulatory engineering.
Within that framework, he has visited many customer sites worldwide to measure and gauge problems. He used developing techniques to understand zinc whiskers and their effects. He has also developed the on-site measurement techniques in China for site-specific corrosion.
Mr. White has conducted and delivered training for Worldwide HP field teams to understand site-specific topics and better serve HP customers. In parallel with his duties for site environment characterization, he utilizes HP’s ISO 9001 Quality Management processes for new large server introductions and HP Cloud programs to continually improve its product offerings.
Paul Finch is a technical director, EMEA Design & Construction, at Digital Realty. He is the leading expert for mechanical engineering and energy engineering having both strategic and project responsibilities. Since joining the company in 2010, he has published a collection of European design engineering guides and led many successful major developments across London, Amsterdam, Paris, Dublin, and Singapore markets. Mr. Finch has more than 25 years of progressive experience in engineering, construction and property consulting, focused on technical real estate and high dependency mission critical environments in the banking and finance, technology and telecommunications sectors.
https://journal.uptimeinstitute.com/wp-content/uploads/2014/09/11.jpg4751201Kevin Heslinhttps://journal.uptimeinstitute.com/wp-content/uploads/2022/12/uptime-institute-logo-r_240x88_v2023-with-space.pngKevin Heslin2014-09-08 10:01:192014-09-15 13:48:21Solving Air Contaminant Problems in Data Centers
TELUS SIDCs provide support to widespread Canadian network. SIDCs showcase best-in-class innovation and efficiency
By Pete Hegarty
TELUS built two Super Internet Data Center (SIDC) facilities as part of an initiative to help its customers reap the benefits of flexible, reliable, and secure IT and communication solutions. These SIDCs, located in Rimouski, Quebec, and Kamloops, British Columbia, contain the hardware required to support the operations and diverse database applications of TELUS’ business customers, while simultaneously housing and supporting the company’s telecommunications network facilities and services (see Figures 1 and 2). Both facilities required sophisticated and redundant power, cooling, and security systems to meet the organization’s environmental and sustainability goals as well as effectively support and protect customers’ valuable data. A cross-functional project team, led by Lloyd Switzer, senior vice-president of Network Transformation, implemented a cutting-edge design solution that makes both SIDCs among the greenest and most energy-efficient data centers in North America.
Figure 1. Exterior photo of the Kamloops SIDC
TELUS achieved its energy-efficiency goals through a state-of-the-art mechanical design that significantly improves overall operating efficiencies. The modular design supports Concurrent Maintenance, a contractually guaranteed PUE of 1.15, and the ability to add subsequent phases with no disruption to existing operations.
Both SIDCs allow TELUS to provide its customers with next-generation cloud computing and unified communication solutions. To achieve this, teams across the company came together with the industry’s best external partners to collaborate and drive innovation into every aspect of the architecture, design, build, and operations.
Best-in-Class Facilities
The first phase of a seven-phase SIDC plan was completed and commissioned in the fall of 2012. The average cabinet density is 14 kilowatts (kW) per cabinet with the ability to support up to 20 kW per rack. The multi-phased, inherently modular approach was programmed so that subsequent phases will be constructed and added with no disruption to existing operations. Concurrent Maintainability of all major electrical and mechanical systems is achieved through a combination of adequate component redundancy and appropriate system isolation.
Both SIDCs have been constructed to LEED environmental standards and are 80% more efficient than traditional data center facilities.
Other expected results of the project include:
Figure 2. Exterior photo of Rimouski SIDC
• Water savings: 17,000,000 gallons per year
• Energy savings: 10,643,000 kilowatt-hours (kWh) per year
• Carbon savings: 329 tons per year
The SIDCs are exceptional in many other ways. They both:
• Use technology that minimizes water consumption, resulting in a Water
Usage Effectiveness (WUE) of 0.23 liters (l)/kWh, approximately four times
less than a traditional data center.
• Provide protected power by diesel rotary UPS (DRUPS), which eliminates
the need for massive numbers of lead-acid batteries that are hazardous
elements requiring regular replacement and safe disposal. The use of DRUPS
also avoids the need for large rooms to house UPS and their batteries.
• Use a modular concept that enables rapid expansion to leverage the latest IT,
environmental, power, and cooling breakthroughs providing efficiency gains
and flexibility to meet customers’ growing needs (see Figures 3 and 4).
Figure 2. Exterior photo of Rimouski SIDC
TELUS’ data center in Rimouski is strategically located in a province where more than 94% of the generation plants are hydroelectric; the facility operates in free-cooling mode year-round, with only 40 hours of mechanically assisted cooling required annually. The facility in Kamloops enjoys the same low humidity and benefits from the same efficiencies.
Both SIDCs received Tier III Certification of Design Documents and Tier III Certification of Constructed Facility by the Uptime Institute. The city of Rimouski awarded TELUS the Prix rimouskois du mérite architectural (Rimouski Architectural Award) recognizing the data center for exceptional design and construction, including its environmental integration.
Figure 3. Both TELUS SIDCs are based on modular designs
Green Is Good
TELUS teams challenged themselves to develop innovative solutions and new processes that would change the game for TELUS and its customers. Designed around an advanced foundation of efficiency, scalability, reliability, and security, both SIDCs are technologically exceptional in many ways.
Natural cooling: With a maximum IT demand of 16.2 megawatts, the facilities will require168 gigawatt-hours per year. To reduce the environmental impact of such consumption, TELUS chose to place both facilities in areas well known for their green power generation and advantageous climates (see Table 1).
When mechanical systems are operating, a Turbocor compressor (0.25 kW/ton) with magnetic bearings provides 4-5ºF ∆T to supplement cooling to the Cold Aisles. Additionally, the compressor has been re-programmed to work at even higher efficiency to operate within the condensing/evaporating temperature ranges of the glycol/refrigerant of this system.
This innovative approach was achieved through collaboration between TELUS and a partner specializing in energy management systems and has been so successful that TELUS is delivering these same dramatic cooling system improvements in some of its existing data centers.
Modular design: The modular concept enables rapid expansion while leveraging the latest IT, environmental, power and cooling breakthroughs. Additional modules can be added in as little as 16-18 weeks and are non-disruptive to existing operations. The mechanical system is completely independent, and the new module “taps” into a centralized critical power spinal system. By comparison, traditional data center capacity expansions can take up to 18 months.
Figure 4. Module in fabrication at the factory
The modular mechanical system provides a dual refrigerant and water-cooled air-conditioning system to the racks. From a mechanical perspective, each pod can provide up to 2N redundancy with the use of two independent, individually pumped refrigerant cooling coil circuits. The two cooling circuits are fully independent of one another and consist of a pump, a condenser, and a coil array (see Figure 5).
The approach uses a pumped refrigerant that utilizes latent heat to remove excess server heat. The use of micro-channelized rear-door coils substantially increases overall coil capacity and decreases the pressure drop across the coil, which improves the energy efficiency.
The individual modules are cooled by closed-circuit fluid coolers that can provide heat rejection utilizing both water and non-water (air-cooled) processes. This innovative cooling solution results in industry-leading energy efficiencies. The modules are completely built off site, then transported and re-assembled on site.
As a result, the efficiency across utilization (measured in terms of PUE) is significantly improved compared to traditional data center designs. While the PUE of a traditionally designed data center can range from as high as 3.0 to as low as 1.6 in a best-case scenario (approximately at 80% usage), both TELUS facilities have a PUE utilization curve that is almost flat, varying from 1.3 (at no load) to 1.15 (at 100% load). (See Table 2).
The Electrical System
A world-class SIDC runs on solid pillars, with one of them being the electrical system (See Figure 6). This system acts as the foundation of the data center, and consistent reliability was a key component in the planning and design of both TELUS facilities.
Table 1. The moderate climates of Kamloops and Rimouski enable the SIDCs to achieve low emissons.
The main electrical systems of both SIDCs operate in medium voltage, including the critical distribution systems. Incoming power is conditioned and protected right from the entrance point, so there are no unprotected loads in either facility.
Figure 5. TELUS cooling system employed at Kamloops and Rimouski
Figure 6. Physical separation of A and B electrical systems ensures that the system meets Uptime Institute Tier III requirements.
Behind the fully protected electrical architecture is a simple design that eliminates multiple distribution systems. In addition, the architecture ensures that the high-density environments in the IT module do not undergo temperature fluctuations—due to loss of cooling—when switching from normal to emergency power. Other important benefits include keeping short-circuit currents and arc flashes to manageable levels.
The DRUPS are located in individual enclosures outside the building, and adding units to increase capacity is a relatively easy and non-intrusive activity. Since the system is designed to be fully N+1, any of its machines can be removed from service without causing any disruption or limitation of capacity on the building operations. Each of these enclosures sits on its own fuel belly tank that stores 72 hours of fuel at full capacity of the diesel engines.
The output of the DRUPS is split and collected into a complete 2N distribution system—A and B. The main components of this A and B system are located in different rooms, keeping fire separation between them. The entire distribution system was designed with the concept of Concurrent Maintainability. This means that the A or B side of the distribution can be safely de-energized without causing any disruption to IT or mechanical loads.
The electrical system uses the same concept as the architectural distribution. Each module connects to the main distribution, and the introduction of new modules is performed without affecting the operation of the existing ones.
In order to do this, each module includes its own set of critical and mechanical substations (A and B in both cases) that deliver low voltage to the loads (RPPs, mechanical CDUs, pod fans) in the form of bus ducts that run along both service corridors. Each rack receives two sets of electrical feeders from the A and B systems, where power is distributed to the servers through intelligent and metered PDUs.
Figure 7. The mechanical cooling system avoids any single point of failure.
The Mechanical System
If the electrical system is one of the pillars of the SIDCs, the mechanical system is another (see Figure 7). In today’s IT world, server density grows, and because the servers are installed in relatively narrow spaces, keeping a controlled environment where temperature does not undergo large or fast fluctuations and air flows clean and without restriction, is key to the reliability of those servers. As indicated above, the entire cooling system is protected with UPS power and provides the first line of defense against those fluctuations.
The SIDC modules are cooled with a sophisticated, yet, architecturally simple, mechanical system that not only allows for an adequate environment for the IT equipment but is also extremely efficient.
Many technologies today are achieving extremely low PUEs—especially compared to the old days of IDCs with PUEs of 2.0 or worse—but they do that at the expense of significant consumption of water. The TELUS SIDC cooling technology, the first of its kind in the world, not only runs at low PUE levels, but also is extremely frugal in the use of water. For ease of illustration, the system can be divided in its three main components:
1. The elements that capture heat immediately after it’s produced, which increases efficiency to its maximum possible as the hot air does not have to travel far. The facilities achieve this with edge devices—rear door coils or coils situated in the superior part of the Hot Aisle. Multiple fans push the cooled air onto the Cold Aisle to re-enter the IT gear through the front of the racks.
With this arrangement of fully contained Cold Aisles/Hot Aisles, air recirculates with only a minimum contribution of outside air provided by a make-up system. Among many advantages of the system, the need for small quantities of outside air makes it appropriate for installation in virtually any environment as the system is not prone to be affected by pollution, smoke, or any other agent that should not enter the IT space.
2. The CDUs are extremely sophisticated heat exchangers, which ensure the refrigerant lines are always kept within temperature limits. The heat interchange is done at maximum efficiency based on the temperature of the coolant in the return lines. If the temperature of this return is too high and doesn’t allow the refrigerant loop to remain within range, the CDU also has the intelligence and the capability to push this temperature down with the assistance of high-efficiency compressors.
3. The fluid cooler yard, which is situated outside the facilities and is responsible for the final rejection of the heat to the atmosphere. The fluid coolers run in free (and dry) cooling mode year-round except when the wet-bulb temperature exceeds a certain threshold, and then water is sprayed to assist in the rejection.
Table 2. The TELUS facilities maintain a relatively flat PUE across utilization
All of the above mentioned elements are redundant, and the loss of any element does not result in any disruption of the cooling they provide. The fluid coolers have been designed in an N+1 configuration where the CDUs and edge devices are fully 2N redundant, the same scenario as with both refrigerant and coolant loops.
Figure 8. Inside shot of a Cold Aisle at the Kamloops, SIDC
Figure 9. Inside shot of a Cold Aisle at the Rimouski SIDC
The TELUS Team
The TELUS project team challenged traditional approaches to data center design, construction, and operations. In doing so, it created opportunities to transform its approach to future data center builds and enhance existing facilities. The current SIDCs have helped TELUS develop a data center strategy that will enable it to:
• Achieve low total cost of ownership (TCO)
• Support long-term customer growth
• Maximize the advantages of technology change:
density and efficiency
• Align with environmental sustainability and
climate change strategy
• Enable end-to-end service capabilities: cloud/
network/device
• Provide a robust and integrated physical and
logical security
More than 50 team members from across the organization participated in the SIDC project, which involved a multiple-year process of collaboration across many TELUS departments such as Network Transformation, Network Standards, IT, Operations, and Real Estate.
Figure 10. Cold Aisle in fabrication at the factory
The completion of the SIDCs represented an ‘above and beyond’ achievement for the TELUS organization. The magnitude of the undertaking was significantly larger than any infrastructure work in the past. In addition to this, the introduction of a completely new infrastructure model and technology, in many ways revolutionary compared to the company’s legacy data centers, introduced additional pressure to ensure the team was choosing the right model and completing the necessary due diligence to ensure it was a good fit for its business.
Many of these industry-leading concepts are now being deployed across TELUS’ existing data centers, such as the use of ultra-efficient cooling systems. In addition, as a result of the knowledge and best practices created through this project, TELUS has established a center of excellence across IT and data infrastructure that empowers teams to continue working together to drive innovation across their solutions, provide stronger governance, and create shared accountability for driving its data center strategy forward.
Overcoming Challenges
A clear objective combined with the magnitude and high visibility of the undertaking, enabled the multi-disciplinary team to achieve an exceptional goal. One of the most important lessons for TELUS is the self-awareness that when teams are summoned for a project, no matter how large it is, they are capable of succeeding, if the scope and timelines are clear.
During construction of the Rimouski SIDC, the team experienced an issue with server racks, specifically with the power bars on the back. Although great in design, they ended up being too large, therefore preventing the removal of the power supplies from the backs of servers. Even though the proper due diligence had been completed, it wasn’t until the problem arose physically that the team was able to identify it. As a result, TELUS modified the design for the Kamloops SIDC and built mock-ups or prototypes to ensure this does not happen again.
Partners
TELUS worked with external partners on some of the project’s key activities, including Skanska (build partner), Inertech (module design and manufacturer), Cosentini (engineering firm), and Callison (architects). These partners were integral in helping TELUS achieve a scalable and sustainable design for its data centers.
Future Applications
Once TELUS realized the operational energy savings achieved by implementing the modular mechanical system, they quickly explored the applicability within existing legacy data centers. In fact, TELUS has recently completed the conceptual design of a retrofit within one of its existing facilities, and an additional feasibility study is currently underway for another of its existing data centers. The team has learned that it can utilize the existing central plant mechanical system with a similar, customized modular rack and cooling system that was installed in TELUS’ new SIDCs to achieve increased (density) capacity and much improved energy efficiency. And of significant importance, all of this can be accomplished without eliminating the legacy mechanical system.
TELUS’ intention is to start applying these highly efficient solutions to some of its large network sites as well. Some of the traditional legacy equipment is rapidly moving towards a much more server-like gear with a small footprint and large power consumption, which translates into more heat rejection. Large telecom rooms can be relatively easily retrofitted to host an almost completely contained “pod” that will be used for the deployment of those new technologies.
An Ongoing Commitment
When TELUS first started planning the SIDCs in Rimouski and Kamloops, it focused on four main pillars: efficiency, reliability, scalability, and security. And all four pillars were integral to achieving overall sustainability. These pillars are the foundation of the SIDCs and ensure they’re able to meet customer needs now and in the future. With that commitment in place, TELUS’ forward-thinking strategy and innovative approach ensure it will be considered a front-runner in data center design for years to come.
Pete Hegarty
Pete Hegarty has acquired a wealth of industry knowledge and experience in his more than 10 years at TELUS Communications, a leading national communications company, and 25 years in the telecommunications industry. His journey with TELUS has taken him through various positions in Technology Strategy, Network Planning, and Network Transformation. In his current role as Director of TELUS’ Data Centre Strategy, Mr. Hegarty leads an integrated team of talented and highly motivated individuals who are driving the transformation of TELUS’ data center infrastructure to provide the most efficient, reliable and secure Information communications technology (ICT) solutions in Canada.
https://journal.uptimeinstitute.com/wp-content/uploads/2014/09/18.jpg4751201Kevin Heslinhttps://journal.uptimeinstitute.com/wp-content/uploads/2022/12/uptime-institute-logo-r_240x88_v2023-with-space.pngKevin Heslin2014-09-08 09:57:582014-09-08 09:57:58TELUS SIDCs provide support to widespread Canadian network
Compass sets the course with new modular data center approach.
The term modular has been used to describe a variety of approaches to data center design. Historically, the first commercially available modular design was a 2007 Sun Microsystems container-based product called the Black Box. Today, the term describes products that range from shipping containers and simple repeated designs to fully manufactured IT spaces and MEP systems built in factories and shipped to various sites.
Many modular data center providers have written white papers that tout the benefits of their proprietary designs, but there are also some informative reports on the ins and outs of modular design. John Stanley of 451 Research presented the results of his survey work at the Uptime Institute Symposium in May 2012. He surveyed 35 companies that use and provide various types of modular solutions for data centers. His research pointed out that 65% of those surveyed deployed capacity in ‘chunky’ increments, specifically highlighting the need for small chunks of capacity per module or deployment to match growth of their data centers.
Compass has based its business strategy on this industry driver and five main features of modular design:
High quality
Low construction costs
Speed to deploy
Integrated supply chain
Low operating costs
In the Green Grid paper, “Deploying and Using Containerized/Modular Data Center Facilities,” published in November 2011, the Green Grid demonstrated that modular data centers can follow capacity requirements more closely, freeing capital and keeping MEP systems more fully loaded than large-scale deployments. The authors of the paper showed that end users could employ their utility systems and floor spaces more fully, without undue concern for system exhaustion or space starvation. The authors discuss how small increments of capacity can follow compute demands more closely, with the caveat that the facility must also have a faster implementation cycle in order to match the changing IT requirements.
The data center industry is beginning to realize the benefits of the early industrial revolution. Standardized modular power center designs provide some of the same benefits to design and construction personnel. Instead of hand-building custom electrical systems for each data center, the modular approach allows for greater deployment speed, improved quality and lower costs, all achieved by using factory-based labor. The use of modules also relieves labor stacking on the job site, while reducing the overall cost of the work by a significant amount.
In his 1936 paper, Factors Affecting the Cost of Airplanes, T.P. Wright first quantified the cost savings that could be attained using factory labor. Wright showed that the direct labor cost of assembling an airframe decreased by roughly 20% for each doubling of the production numbers. In other words, if the labor cost of building one airframe was $1,000,000, the labor cost of building two of the same models might be $800,000 each. Doubling again would mean the cost of four the same airframes would be $640,000 each, or 36% lower than the first unique model.
Compass Data Centers intended to take advantage of this principle as it developed its patent-pending solution. In doing so, Compass has found that modular designs enable it to:
Benefit from learning-curve dynamics to improve quality and speed of implementation with each iteration
Lower operating costs from design efficiencies that tune initial innovative ideas
Provide predictable reliability attributes and repeatable, low-cost operations
Deliver a standard product
As a result, Compass has moved from building a prototype on every data center project to productizing the data center program and build.
Despite the fact that the industry has not settled on a clear definition of the ‘modular data center,’ it is attempting to evade this ambiguity by proclaiming the coming of ‘Version 2,’ which seems to include prefabrication as a fundamental element. Before, modular construction was associated with ISO containers and packaged chillers. Now, modularity is being embraced as synonymous with sound design and sound capital usage.
The Compass Deployment
Every data center design begins with the establishment of availability and power requirements – reliability and power density are the cornerstones of any data center specification. The business needs of the enterprise and the IT applications to be contained within the data center should drive these decisions.
Virtually every initial design addresses the project power requirements and references the Uptime Institute’s well-known Tier specifications to define reliability requirements. Uptime’s Tier Standard helps define the equipment and systems required to support the reliability and power demands of the business’s IT model. If the needs of a business are truly defined by an Uptime Tier III specification, then its data center design should be certifiable as a Tier III design.
Compass’ Truly Modular Architecture design provides for standard features such as RHI Modular Power Solutions’ Modular Power Center units, which are also built off-site, power modules that can be configured to provide a 2N power infrastructure, and N+1 mechanical systems. Other Compass architecture features include:
10,000 square feet of column-free raised floor space
Hardened structure (Seismic 1.5 and Category 4 Hurricane Winds)
The capability to support up to 20-kW racks
Convenient operations, staging and storage spaces
Uptime Tier III-certifiable design
Uptime Tier III-certifiable facility
The standardized design of the Compass Modular Architecture provides assurance that the facility will be Tier III design certified. Internal auditors and external customers can not only be assured of the design certification, but also have the option to certify the facility itself. Importantly, the ability to productize a unique modular data center solution into a repeatable and well-defined process was a top priority. Modularizing data center components permits control over three primary variables:
Cost
Quality
Schedule
Compass shares the view that these three variables are the only three points that end users actually care about. Compass also believes that modularity:
Is cost effective
Is not always a prefabricated solution
Increases quality
Supports continuous improvement
May bring jurisdictional issues
Some jurisdictions have misconceptions about modular or containerized solutions. They envision standard ISO shipping containers, assembled on-site, as the basis of the construction process.
Meeting the local authority having jurisdiction (AHJ) early in the project’s developmental cycle is an effective way to establish trust and dispel misconceptions. Providing an extensive amount of specific information on the modular components of the proposed data centers is a good way to start.
Next Phase
As part of its schematic designs, Compass decided that its basic architectural scheme would be a shell that would contain a 10,000-square-foot (ft2) column-free, raised-floor hall and all the traditional support spaces. Compass made this decision based on the collective experience of its internal and consultant teams, as well as market analysis.
Compass decided that the systems, called Modular Power Centers (MPCs), would be packaged and delivered as standardized systems. This work was provided by Modular Power Solutions. The MPCs could be installed either internally or externally to the data center’s brick-and-mortar shell structure. Crosby and the MPC executives have filed for patent protection of the intellectual property.
Compass chose not to employ a central mechanical plant, but rather to deploy an N+1 redundant rooftop mechanical system to support the facility’s HVAC requirements. So, the schematic design established the following parameters:
Data Hall:
10,000 ft2 data hall
Column free
36-inch raised-floor white space, supporting up to 500 racks
120 watts per square foot , with the ability to cool heterogeneous loads and accommodate racks up to 30 kW
1.2-MW Modular Power Centers, which could be either internally or externally installed at the facility.
The basis-of-design (BOD) goals are then used for the next step in the design process, the creation of a single-line diagram. The development of the schematic design (SD) phase single-line diagram brings together the conceptual components and requirements of the BOD (see Figure 1).
Figure 1. Schematic design single-line diagram
The initial single-line is the tool that Compass used to determine the structure and components required for the electrical distribution system. The MPCs must be sized to be able to support the demands of the 1.2-MW data hall, the mechanical systems and the support spaces. The single-line diagram is also used to validate the Tier III redundancy and concurrent maintainability requirements. The redundancy of critical components and systems and the requirement for de-energized maintenance must be worked through at this stage of the design process.
The major electrical distribution system components were identified as:
One 2500-kilovolt-ampere (kVA) utility transformer
One 2500-kVA/2000-kW standby-rated generator
One redundant 2500-kVA/2000-kW standby generator
One 480-volts (V), 3000-amp (A) main distribution switchboard
Two 1200-kW high-efficiency uninterruptible power supplies (UPS)
Two 1600-A static transfer switch (STS) bypasses
Two 1600-A UPS output distribution switchboards
Two 1600-A maintenance bypasses
The Compass one-line based on the Tier III requirements provided a look at the electrical system’s redundancy (see Figure 2).
Figure 2. Electrical system redundancy
Then Compass added two isolation or tie breakers to the main switchboard in order to meet the Tier III concurrently maintainable requirement. These breakers were required to allow either side of the switchboard to be shut down and completely de-energized for service. The tie breakers can also be used to enhance fault tolerance. If they are forced to trip before the main circuit breakers on either side, the non-faulted side of the system can remain operational.
The decision was made to look to the local utility provider to supply an N redundant 2500-kVA utility power transformer. The 2500-kVA/2000-kW standby generator in the base system is N redundant. A second N+1 or 2N redundant generator added to the lineup meets the Tier III redundancy requirements. The second generator will be connected to the opposite side of the switchboard lineup. Compass preferred generator redundancy over utility redundancy, finding generators to be more reliable than the utility, based upon its experience that blackouts tend to regional in nature (as seen with hurricane Sandy).
The remaining equipment would be installed in a Power Center module. That equipment was identified as:
Two 480-V, 3000-A main distribution switchboards
Two 1200-kW high-efficiency UPS units
Two 1600-A STS bypasses
Two 1600-A UPS output distribution switchboards
Two 1600-A maintenance bypasses
Based on the equipment defined in the single-line, Compass determined that at least two MPCs would be required.
The tie breakers provide a natural point to split the system. This split became the basis of how the system is packaged. And the size of the modules and weight of the MPCs is constrained by the need to ship them over highways from the assembly facility to the job site. Typically, those shipping packages are not to exceed 50 feet by 12 feet and 100,000 pounds.
Each MPC switchboard lineup features a 3000-A and a 1600-A UL 891-listed switchboard. Each switchboard is equipped with two 3000-A, four 400-A, and four 450-A UL 489-listed circuit breakers. All circuit breakers larger than 200-A are 100% duty rated. All circuit breakers feature zone selective interlocks (ZSIs). A ZSI ties the circuit breaker trip units together, allowing them to communicate in order to ensure that the circuit breaker closest to the fault trips first. Increasing the fault isolation capabilities increases the data center’s ability to maintain operational continuity.
The main switchboards are configured as main-tie-main-tie-main. Each CPC has a dedicated programmable logic controller (PLC). The PLCs are hot swappable, meaning that if either processor goes down, the other processor will automatically take control. The I/O rack is located in the A CPC. There is no power bussing in the I/O section. The switchgear can be manually operated if the I/O rack is de-energized for maintenance.
Modbus Protocol is provided to the Schneider Electric StruXureWare management system at the PLC gateway for each main switchboard. The main switchgear has integrated revenue-grade power-quality metering.
Each side of the redundant power system features a 1.2-MW Schneider Electric APC Symmetra Megawatt UPS (see Figure 3). Each UPS has a dedicated external 1600-A continuous-duty-rated static bypass switch. Power to the two UPS systems is delivered from two separate (A/B) switchboards. Each switchboard is able to support the entire data center. The two tie breakers operate in the normally closed position.
Figure 3. UPS efficiency
Figure 4. (Above) Modular Power Center – top view (patent pending)
Figure 5. (Below) Modular Power Center – plan view (patent pending)
Power for the data hall will be derived from two identical MPC modules, each of which is factory-assembled prior to on-site delivery. The first layouts were completed for the MPCs with the addition of the following components:
Four battery cabinets per side for 5-minutes battery backup at 1.2 MW
Two automatic transfer switches for N+1 rooftop units
One 208/120-V distribution panel for local power needs
Figure 6. Modular Power Center – interior
The MPCs (see Figures 4-8) are IBC-rated R17 structures, which meet Miami-Dade County 149-mph wind-pressure loading requirements. The MPCs are constructed to provide protection with respect to harmful effects on the equipment due to the ingress of water (rain, sleet, snow), and will be undamaged by the external formation of ice on the enclosure or seismic events.
Compass employs 2.0-MW/2.5-MVA, 277/480-V, 3ø, four-wire generator rated at 1825 kW to provide standby power (see Figure 9 and 10).
Compass determined that the data center infrastructure will require support from a 2.0-MW/2.5-MVA generator. The sequence of operation of the total system is controlled automatically through deployment of redundant PLC control units installed in each of the 3000-A main switchboards. Should the primary standby generator fail to come online after loss of the utility source, the swing generator will pick up the critical loads of the system. Each generator will be provided with a weather-protective enclosure. All generator permits (including all operations, fuel storage, noise and air) will be obtained and maintained with the appropriate AHJ. Generators are equipped with 4,000-gallon fuel storage belly tanks for 24 hours of fuel capacity at full load.
Figure 7. Modular Power Center – interior
Figure 8. Modular Power Center – exterior
Figure 9. Standby generator
The output of each UPS module is a 1600-A distribution board equipped with a maintenance bypass. A solenoid key release unit (SKRU) is provided to ensure that the UPS has transferred to bypass before the MBP breaker can be engaged to the output switchboard. This will always be a closed transition transfer so that critical load power will never be lost.
Critical power to the IT load will be provided by eight 300-kVA PDUs installed in an alternating A/B arrangement in the data hall to provide 208/120-V power to either overhead busway or remote power panels. Each PDU has a 300-kVA K-13 rated transformer and six 225-A breakers. Additionally, each PDU has six integrated revenue-grade power-monitoring meters.
Compass determined that the mechanical requirements for each data hall can be supported by four 120-ton rooftop units (RTUs). The four RTUs provide N+1 system redundancy. Power for each RTU will be available from either the A or B System through dedicated automatic transfer switches (see Figure 11). The units feature integrated controls allowing for efficient airside economization across all units. A proprietary rapid-restart feature ensures full air movement within 30 seconds after restoration of power. The system controls deliver uniform under-floor pressures.
Figure 10. Generator exterior
This single-line diagram (see Figure 12) represents the next step in the construction document’s development process: the design development (DD)-phase documents. The updated single-line features significant developments in the design process. The new features are:
The division of the electrical distribution system into two completely separate MPCs
The second generator was added to provide N+1 redundancy
Provisions for ‘A side’ and ‘B side’ mechanical feeders
The integration of the main and output switchboards
The integration of the maintenance bypass (MBP) breaker into the new contiguous switchboard lineup
The introduction of dual-programmable logic controllers (PLCs)
The introduction of a remote main utility circuit breaker
The new single-line diagram now reflects the separate MPCs. The MPCs in this arrangement actually complement each other, providing 2N redundancy to the data hall.
A second generator was added to provide 2N generator redundancy. In the future, this second generator could be shared with additional data halls on the same campus. The redundancy of the generators would then be N+1.
Each MPC was outfitted with provisions to provide power for the entire mechanical system. Normally, power for one-half of the mechanical equipment is supplied by each MPC. Dedicated ATSs will automatically roll power to any active MPC if power were lost.
Figure 11. Power for each RTU is available from dedicated automatic transfer switches.
The new single-line shows how both the input and output switchboards have been integrated into a single switchgear lineup. The new lineup provided for a simplified interconnection scheme when it was installed in the MPC.
The use of dual MPC facilitates the use of dual PLCs. The ability of the PLCs to stay in synchronous operation allows for a seamless transfer of control between either unit.
High levels of arc-flash energy in the main switchboards became a concern when the decision was made to have the utility provide the main 2500-kVA transformer and the transformer’s primary-side protection. Most utilities design their protection schemes to protect the utility’s own equipment. This typically doesn’t translate into limiting the arc-flash energy levels on the secondary side of these large transformers. Remoting the main utility breaker outside the MPC allows the arc-flash energy to be contained outside the remote switchboard. The arc-flash energy inside the MPC is now be significantly reduced.
The deployment of the MPCs is just part of the modular concept that was developed for Compass Data Centers. Compass has done further development of the concept. This work and Tier III compliance with the Uptime Institute are important elements of its business plan to control costs and provide alignment of data center facilities with customers’ business requirements.
Steve Emert earned a BSEE Degree in Electrical Engineering from San Jose State University. He is currently a Registered Professional Engineer in more than 15 states, and is director of Mission-Critical Engineering at Rosendin Electric, the largest privately owned electrical contractor in the U.S. Mr. Emert began his career performing design and analysis of industrial, commercial and utility power systems, cogeneration plant design and coordination studies. In the mid-1990s, he worked at the Ames Research Center located at Moffett Field, CA, where he began a mission-critical-focused career working on the NAS supercomputer and many of the technically advanced NASA facilities.
Since joining Rosendin Electric, Mr. Emert has provided the engineering foundation for the company’s design-build mission-critical construction business. Today Rosendin Electric is the largest design-build electrical contractor for mission-critical facilities in the U.S. Mr. Emert is an active member of the IEEE P1584 IEEE Guidelines for Performing Arc-Flash Hazard Calculations Working Group. He is a member of the IEEE P1584 Configuration Task Group, currently engaged in the process of defining a new set of standards for the next issue of the P1584 Guideline publication. Mr. Emert has coauthored IEEE EMC Society presentations and written articles on electrical power systems for Electrical Contractor Magazine.
https://journal.uptimeinstitute.com/wp-content/uploads/2014/09/emert-cover-photo.jpg4751201Kevin Heslinhttps://journal.uptimeinstitute.com/wp-content/uploads/2022/12/uptime-institute-logo-r_240x88_v2023-with-space.pngKevin Heslin2014-09-04 07:57:362014-09-04 08:41:19Data Center Facility Owners See Modules as Efficient Way to Deploy Capital
Data Center Outages, Incidents, and Industry Transparency
/in Operations/by Kevin HeslinThe lack of transparency can be seen as a root cause of outages and incidents
By Jason Weckworth
I recently began a keynote speech at Uptime Institute Symposium 2013 by making a bold statement. As data center operators, we simply don’t share enough of our critical facilities incidents with each other. Yet Uptime Institute maintains an entire membership organization called the Uptime Institute Network that is dedicated to providing owners and operators the ability to share experiences and best practices by facilitating a rich information nexus exchange between members and the Uptime Institute.
Why isn’t every major data center provider already a member of this Network? Why don’t we share more experiences with each other? Why are we reluctant to share details of our incidents? Of course, we love to talk about each other’s incidents as though our competitors were hit with a plague while we remain immune from any potential for disaster. Our industry remains very secretive about sharing incidents and details of incidents, yet we can all learn so much from each other!
I suppose we’re reluctant to share details with each other because of fear that the information could be used against us in future sales opportunities, but I’ve learned that customers and prospects alike expect data center incidents. Clients are far less concerned about the fact that we will have incidents than about how we actually manage them. So let’s raise the bar as operators. Let’s acknowledge the fact that we need to be better as an industry. We are an insurance policy for every type of critical IT business. None of us can afford to take our customers off-line… period. And when someone does, it hurts our entire industry.
Incidents Every Day
An incident does not mean a data center outage. These terms are often confused, misinterpreted or exaggerated. An outage represents a complete loss of power or cooling to a customer’s rack or power supply. It means loss of both cords, if dual fed, or loss of single cord, if utilizing a transfer switch either upstream or at the rack level.
Equipment and systems will break, period. Expect it. Some will be minor like a faulty vibration switch. Others will be major like an underground cable fault that takes out an entire megawatt of live UPS load (which happened to us). Neither of these types of incidents are an outage at the rack level, yet either of them could result in one if not mitigated properly.
Data Center Risk
Do not ask whether any particular data center has failures. Ask what they do when they have a failure. There is a lot of public data available on the causes of data center outages and incidents, but I particularly like a data set published by Emerson (see Figure 1) because it highlights the fact that most data center incidents are caused by human and mechanical failures, not weather or natural disasters. Uptime Institute Network data provide similar results. This means that, as operators, we play a major role with facility management.
Figure 1. Data provided by Emerson shows that human and mechanical failures cause the vast majority of unplanned outages in data centers.
I have been involved with every data center incident at RagingWire since its opening in 2001. By the end of this year, that will equate to almost 100 megawatt (MW) of generating capacity and 50 MW of critical IT UPS power. I must admit that data center incidents are not pleasant experiences. But learning from them makes us better as a company, and sharing the lessons make us better as an industry.
In 2006, RagingWire experienced one particularly bad incident caused by a defective main breaker that resulted in a complete outage. I distinctly recall sitting in front of the Board of Directors and Executives at 2:00 AM trying to explain what we knew up to that point in time. But we didn’t yet have a root-cause analysis. One of the chief executives looked at me across the table and said, “Jason, we love you and understand the incredible efforts that you and your teams have put forth. You haven’t slept in two days. We know we are stable at the current time, but we don’t yet have an answer for the root cause of the failure, and we have enterprise Fortune 500 companies that are relying on us to give them an answer immediately as our entire business is at risk. So make no mistake. There will be a fall guy, and it’s going to be you if we don’t have the answer to prove this will never happen again. You have four hours, or you and all your engineers are fired!” Fortunately, I’m still at RagingWire, so the story ended well. We used the experience to completely modify our design from N+1 to 2N+2 infrastructure, so that we would never again experience this type of failure. But, I never forgot this idea of our natural tendency to assign blame. It’s hard to fight this cultural phenomenon because there is so much at stake for our operators, but I believe that it is far more important to look beyond blame. Frankly, it doesn’t matter in the immediate aftermath of an incident. Priority #1 is to get operations back to 100%. How does a data center recover? How do you know when your business will be fully protected?
Data centers fail. It is important to understand the root cause and to make sure to fix the vulnerability.
Life Cycle of an Outage
Now I don’t mean to offend anyone, but I do make fun of the communication life cycle that we all go through with every major incident. Of course, we know this is a very serious business, and we live and breathe data center 24 hours per day. But sometimes we need to take a break from the insanity and realize that we’re all in this together. So, here is what I consider to be the communication life cycle of our customers. And often, it’s the same response we see from the Executive Teams!
Stage 1: SURPRISE. Are you kidding? This just happened at your data center? I didn’t think this could happen here! Are my servers down?!?
Stage 2: FEAR. What is really happening? Is it worse than you are telling me? What else is at risk? What aren’t you telling me? Are you going to experience a cascading failure and take down my entire environment?
Stage 3: ANGER. How could this possibly happen? I pay you thousands (or millions) of dollars every month to ensure my uptime! You’re going to pay for this! This is a violation of my SLA.
Stage 4: INTERROGATION. Why did this happen? I want to know every detail. You need to come to my office to explain what happened, lessons learned and why it will never happen again! Where is your incident report? Who did what? And why did it take you so long to notify my staff? Why didn’t you call me directly, before I heard about it from someone else?
Of course, the “not so funny” part of this life cycle is that in reality, all of these reactions are valid. We need to be prepared to address every response, and we truly need to become better operators with every incident.
Operational Priorities
After 12 years of industry growth, many phased expansions into existing infrastructure and major design modifications to increase reliability, I have found that the majority of my time and effort always remains our risk management of the data center as it relates to uptime. Data centers are not created equal. There are many different design strategies and acceptable levels of risk, such as N+1, 2N, 2N+2, etc. However, our common goal as operators is to mitigate risk, address incidents quickly and thoroughly, and return the facility to its original, normal condition, with full redundancy.
The following eight areas represent what I consider to be the most important factors contributing to a data center’s ability to deliver a very high level of operational excellence:
• Staffing. Experience matters. I love to hire Navy nuclear technicians, because they are so disciplined. But, my favorite interview question more than any other, is to ask potential candidates about the incidents they have experienced in the data center. I want people who have lived through the fire. I want to know how they acted under pressure, what went wrong and what surprises they faced. The more difficult the incidents were, the more I appreciate them! There is no substitute for experience, and there is no way to gain experience other than one incident at a time. I also believe that it’s important to have 24×7 technical staff at the data center. Even with sophisticated control systems, there are many, many instances that require human intervention and on-site analysis/decision making, usually within minutes.
• Training. Do you train by process or by trial? It’s important to do both. How do you practice casualty control drills? I like to involve the entire operations staff when we commission a new phase, because we can throw in unexpected failures and test the staff without live load. I also like to thoroughly review every incident with the entire staff during a weekly training meeting, so that they can learn from real-world experiences. Training assessment should be part of every technician’s annual review, with merit given for mastering various areas of the data center operation.
• Resources. I personally prefer in-house expertise and first-level response, but only because design and construction are core in-house disciplines with self-performed labor. During a recent underground cable fault that lost an entire one megawatt UPS feeder, all the loads transferred to alternate UPS sources under a distributed redundancy topology, but the fault created a heat sink with two additional megawatts at risk that we couldn’t cool. With a literal time bomb on our hands and wire temperatures approaching 200°F, we engaged almost 40 in-house electricians to work 24-hours straight in order to run a new overhead feeder and commission it in order to vacate the underground duct bank and cool the environment.
Of course, staffing doesn’t need to be in-house. But it’s important to have immediate access and key contacts at any moment’s notice. This can be suppliers, service contractors or engineers. I have particularly found that key equipment factory engineers have a wealth of knowledge–if you can gain access to them during an incident.
• Incident Reporting. Incident reporting should be the lifeblood of every data center operator. What kind of visibility do they have? Are they reviewed and approved by Operations, Engineering and Executive staff? I personally review, comment on and approve every incident within the data center. Do you share your incident reports with customers? Some operators may prefer to provide a Summary Report, but we should always be willing to share the entire report to any customer that requests one. Another important detail is follow-up. We tend to be very good at documenting initial incidents, but we struggled with all the follow-up as it related to engineering, vendor support and further testing. If your technicians are always putting out fires, it’s difficult to stay focused on the follow-up. For this reason, we initiated a separated SaaS application called FrontRange that allows us to assign tasks with timed escalation for every follow-up item.
• Escalation. Every incident management protocol needs clear escalation channels. What is critical vs. minor? How detailed is your notification and escalation policy? Is re-training frequent due to non-compliance with escalation procedures? Do you have an escalation process that automatically includes engineering staff? Do you include key vendors within your internal escalation process? Do you have automatic dialing so that you can reach multiple sources within minutes with bridge lines? Do you have an incident manager separate from a communication manager? How fast can your staff mobilize, and do they know when to escalate? Is everyone trained regularly?
• Communication. What is your protocol for controlled dissemination of information? Do you have a dedicated communications manager? This may be part of your NOC staff or a dedicated operations staff member with technical knowledge. How will clients be notified during an incident? Do you allow clients direct visibility to equipment status? Do you set up bridge calls with automatic dialers to affected customers for direct communication during events? Do you have a timed protocol to deliver incident reports with 24 or 48 hours? Do you have a communication protocol for your executive team or account managers so they can also contact your customers or at least have knowledge of what is happening? Sometimes it is just as important to communicate with your internal staff as it is your customers.
• Back-up Plans. Can you provide examples of when the unexpected happened? What are your contingency plans? The data center design has back-up redundancy, but what about operational back up with staffing, suppliers, engineering resources and spare parts? You need basic support like food, clothes and sleep. We’ve experienced needs to keep qualified supervisors or directors on-site just to help with MOP-writing or operational commissioning after a break-fix, yet often these staff members can be completely exhausted.
• Top 10 Incidents. One of the most challenging sales support meetings I ever attended was for a Fortune 100 company. The CIO explained that they had never used colocation outsourcing in the past, and they were particularly concerned with our ability to handle incidents efficiently and communicate clearly to their teams exactly what was happening on a real-time basis. Of course, I am proud of our process and procedures around incident management, and I quickly described many of the ideas that I have touched on within this article. Then he surprised me. He asked me if I could name the Top 10 incidents we’ve had in our data center, what the root causes were, and what engineering changes or process changes we made as a result. I quickly responded by saying “yes, I am pretty sure I know most of these.” So he stated that we would like to know on the spot, because that knowledge off the top of my head from an executive staff member would clearly demonstrate that these issues are important and top of mind to everyone in operations. We spent the next 2 hours talking through each incident as best as I could remember. I must admit that although I named ten incidents, they probably weren’t the top ten over the past ten years. And it was an incredibly stressful meeting for me! But it was an awesome teaching moment for me and my staff.
Conclusion: Our Industry Can Be Better
We all need to know the incidents that shape our data center. We need to qualify improvements to the data center through our incident management process, and we need to be able to share these experiences with both our staff and our customers and with other operators.
Placing blame takes a back seat to identifying root causes and preventing recurrence.
I encourage every operator or data center provider to join the Uptime Institute Network. This is not a sales or vendor organization. It’s an operator’s organization with a commitment from all members to protect information of other members. Here are just a few of the benefits of the Network:
• Learning experiences from over 5,000 collected incidents from members
• Abnormal incident trending that allow members to focus resources on areas most likely to cause downtime
• “Flash” reports or early warning bulletins that could impact other member’s facilities
• Cost savings resulting from validation of equipment purchases or alternative sourcing options
• Tours of Network member data centers with the opportunity to apply ideas on best practices or improvements
• Access to member presentations from technical conferences
Sharing information can help find new ways of preventing old problems from causing issues.
I am also hoping to challenge our industry. If we can become more transparent as operators within a common industry, we will all become better. Our designs and technology may be different, but we still share a very common thread. Our common goal remains the confidence of our industry through uptime of our facilities.
Start With the End in Mind!
/in Executive/by Mark HarrisInvolving operations at the beginning of a data center capital project is a good way to reduce TCO and gain other benefits
By Lee Kirby
As the data center industry grows in geographic breadth and technological sophistication, it is natural that design professionals, owners and operators pay attention to the capital-intensive effort of designing and building a new facility. This phase, however, is a very small portion of the life of a data center.
It is intuitive to consider a project’s development in a linear manner: one thing leads to another. In a relatively young industry, when we use terms like design-build-operate, it is easy to slip into a pattern of thinking of Operations as the last group to come to the table when building a data center. In fact, the opposite is true, and it is time to change the way we think about operations. Phrases like “start with the end in mind” may seem like platitudes but speak to the need for broad changes in how we think about—and plan for—data center operations. When launched at the beginning of the design process, an operations-focused approach ensures that the enormous capital investment made in a data center will produce the most efficient returns possible.
In order to change this kind of thinking, we can begin with concepts that have broad acceptance and significance in the industry and apply the principles to operations. Whether it is a new build, retrofit, or expansion, all design-build activity is really just a form of change management: a point in time with actions that must be managed to reduce risk and ensure uptime. Furthermore, operations is an overarching continuum that provides consistency once a data center is in production. It provides discipline and rigor with change management procedures. Ultimately, ensuring uptime is the responsibility of Operations; with that responsibility should go the authority and the role of active participant from the very beginning. Organizations that understand this model establish a mindset that Operations is the customer, which changes the communication dynamics and ensures openness and unity of effort.
Unfortunately, too many data centers have to make significant changes in their first year after substantial completion. Even if the changes are not as extreme as rebuilding infrastructure, there can be enormous costs—both in terms of rework and ongoing loss of efficiency. Most of these costs could be avoided if Operations is asked to provide critical feedback on facility maintainability during the design phase. This input ensures that the original design considers the long-term costs of maintenance. The Value Engineering (VE) process has its benefits, but it tends to focus just on the first costs of the build. If VE is performed without Operations input, increased costs over the life of the data center may dwarf any initial savings realized from the VE changes.
Integrated Design-Build Project Plan
The timeline and key milestones for design-build do not need to change. What does need to change is the understanding of the level of activity required by the Operations group to ensure that production environment risk is minimized. This understanding can only be gained when Operations actively participates in the project from the very beginning. The following roadmap illustrates an optimal approach to the traditional design-build phases, and expands those phases to include the key operations activities that must be accomplished concurrently. The integrated approach will successfully prepare the project and the Operations team for turnover into a production environment. The roadmap provides context and shows the path that will ensure an organization achieves industry standards and experiences the full benefit of consistently implemented industry best practices. This summary also identifies the three key milestones to achieving Uptime Institute Tier Certifications.
Pre-construction Phase
Data center strategy
Organizational alignment
Design Phase
Maintenance and Operations teams review design
Maintenance and Operations teams planning
Milestone: Tier Certification of Design Documents (TCDD)
Construction Phase
Maintenance and Operations teams complete program
Commissioning Phase
Maintenance and Operations teams readiness
Milestone: Tier Certification of Constructed Facility (TCCF)
Turnover Phase
Turnover and transition to production operations
Milestone: Tier Certification of Operational Sustainability (TCOS)
Data Center Strategy
The scenario: a data center is going to be built. The organization has allocated capital budget and is accepting bids from various entities depending on whether it is a design-bid-build or design-build project. At this point in time, the business requirements are fresh in the minds of the project sponsor and the business units, as they only recently completed the justification exercise to get capital budget approval. Now is the best time to make key decisions on how to operate and maintain the new data center. Key organizational decisions made at this stage will drive subsequent activity and alignment of the design and operations disciplines throughout the rest of the project. Taking a holistic, operations-focused approach from the start will ensure that the large facility investment about to be made will be implemented in a manner that reduces risks and increases return.
It is critical to clearly define what success looks like to the Operations group. Their criteria will drive service-level expectations to all stakeholders, and the organization will use associated key performance indicators (KPI) as a quantitative means of assessment. With the key measures defined, it is important to thoughtfully develop a concept of maintenance and operations based on industry best practices to achieve recognized standards for Operational Sustainability. These decisions will define fundamental organization structure and determine what functions will be provided by contractors and which will be performed by in-house staff. Creating this up-front structure and definition will eliminate wasted effort in the planning stages since contracts (internal and external) can be developed and managed appropriately from the start. Going through this process will force the team to make most of the essential decisions and lay the foundation for a successful maintenance and operations program. This exercise will generate a detailed responsibility matrix that provides clarity and drives organizational efficiencies.
Management and Operations Planning
During the design phase, Operations has two significant roles:
During design review, the Operations team must conduct a thorough failure analysis and maintenance analysis. According to Uptime Institute’s standards, Tier IV Certified data centers are designed to detect, isolate, and contain failures. All other Tier objective data centers should conduct failure analysis as an important planning factor. Organizations must plan for consequence management in the event of a failure that leads to loss of redundancy and not an outage. A thorough failure analysis allows the data center to effectively prioritize emergency response procedures and training and may lead to design modification if the cost is justified.
Maintenance analysis determines not only if the facility can be maintained as designed, but also at what cost. The total cost of ownership of a data center can increase dramatically if the design fails to accommodate the most effective maintenance practices. Once these analysis efforts are complete, and the results incorporated in the design, planning begins.
Next, the Operations team must develop operating standards based on site mission, reliability and availability requirements, and industry best practices. Establish supporting contracts with vendors, put subcontracts out to bid, and define staffing plans based on the requirements that were decided on in the strategy phase. Defining shifts and staff qualifications affords the talent acquisition team time to secure the best possible personnel resources.
If the organization chooses to acquire an automated maintenance management system, this is the time to make that acquisition. The information that will be flowing in all subsequent phases should be entered into the system in preparation for the production environment. It is critical at this point to define the processes the organization will use to record and access the key information that is needed to maintain the environment. Whether in the presence or absence of an automated system, success depends on thoughtfully engineered procedures.
Management and Operations Program Development
The construction phase is more than just time to build. The infrastructure design is complete, and the management and operations plan is in place. The general contractor now focuses on building to meet the design specifications while the Operations team focuses on building the program as planned to meet the uptime requirements. Both teams are going to be very busy and must put all the key components in place so that they are ready for commissioning.
Also during this time, emergency operating procedures should be written and the training program defined. The goal is to train the staff to perform each critical function on Day One, so it will need to run through emergency response drills during commissioning. The MMS and documentation libraries need to be populated and version control procedures need to be employed to ensure accuracy. All documents, site work rules, and key procedures should be defined and documented with sign-off by all stakeholders. It is critical to have change management procedures in place to ensure coordination between the construction team and the Operations team. Frequently, data centers are built with some variance from the construction documents. Some of these changes are beneficial and some are not, so any deviations must be reviewed by Operations.
Management and Operations Readiness
The commissioning phase is the best time to test the critical infrastructure, test the critical operations procedures (EOPs, SOPs, and MOPs), and train the Operations staff. Safety is the first priority; staff should be thoroughly trained on how to operate within the environment and know how to respond to any incident. All members of the team should know how to properly use the systems that have been implemented to accurately store and process operations data. While in a non-production environment, operating procedures can be tested and retested and used as a means of training and drilling staff. The goal is to mature the team to the point that reacting to an incident is second nature. Exercising the entire staff in the most likely events scenarios is a good way to develop proficiency in taking systems on- and off-line without any risk to personal safety or system integrity. Having the Operations team perform some of the commissioning activities as further training is becoming a more common industry practice.
Management and Operations Turnover and Transition
The construction project has reached substantial completion. The result of working through an integrated design-build project approach is that the Operations team is now trained and ready to assume responsibility for the ongoing operations of the data center. The organization can deploy technology without risk and meet or exceed service levels from Day One as a result of the careful planning, development, training, and testing of the operations management program.
However, even though the operations program is ready just as construction is substantially complete, there is still more work to be done. The construction team has a punch list and the Operations team does too. The first year of operations will require the completion of standard operating procedures and methods for routine maintenance. Up to this point, the focus of building the program was training staff to operate and react to incidents. Now the focus will be on establishing a tempo and optimizing day-to-day procedures between various stakeholders. The data center environment is never static; continuous review of performance metrics and vigilant attention to changing operating conditions is critical. Procedures may need to be refined or redefined, training refreshed, and systems fine-tuned with a continuous quality improvement mindset.
Conclusion
However well designed a data center appears on paper, ultimately its success stands or falls on day-to-day operations over the lifespan of the facility. Successful operations over the long term begins with having—at every stage of the planning and development process—an Operations advocate who deeply understands the integrated mesh of systems, technology, and human activity in a data center. By starting with the end in mind and giving Operations a strong voice from the outset, organizations will reap the benefits of maximum uptime, efficiency, and cost effectiveness year after year.
The video below features author Lee Kirby, along with Google’s Vice President of Data Centers, Joe Kava, discussing how to start with the end in mind by involving data center operations teams starting with the design phase.
New System Combats Data Center PQ Concerns
/in Operations/by Kevin HeslinUsing relevant technologies and techniques to develop an optimized system for addressing data center PQ concerns
By Kuochuan Chu
For years, engineers and data centers operators have implemented various strategies to improve power quality in mission-critical facilities. We have found, however, that good power quality requires a solid grounding system. By efficiently utilizing the essential power distribution component of a data center—the transformer, and properly applying phase-shift techniques, harmonic distortion problems can be resolved, significantly improving the overall energy efficiency of a computer room. For our grounding system, we used the structured color-codes management system, so that the power quality and grounding systems can be fully integrated, improving the overall performance and robustness of the data center infrastructure.
Good power quality is essential to reliable data center operation. Once power-related problems affect the overall infrastructure of a data center, the facility may fail, causing financial losses or interrupting years of research.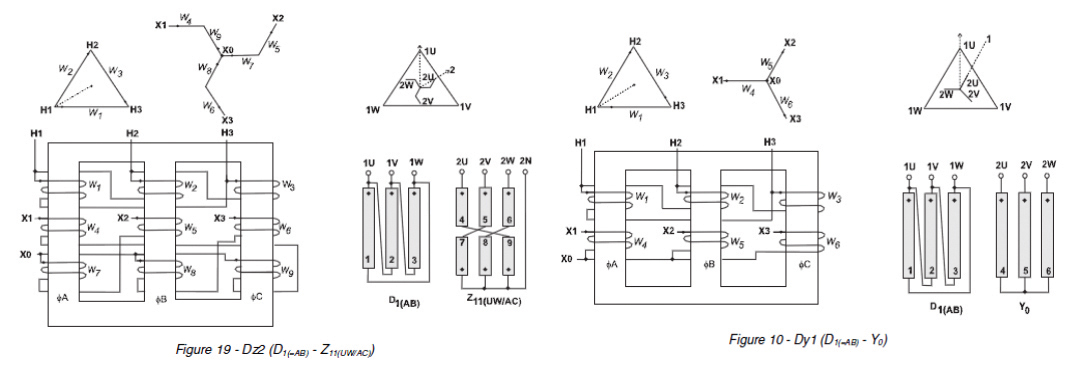
In recent years, our company planned, designed, and commissioned multiple data centers, and supported several research and development efforts. We also cooperated with manufacturers to develop products to improve overall power system performance and strengthen infrastructure management.
Relevant Research
IEEE Recommended Practice for Powering and Grounding Electronic Equipment (Emerald Book) notes that harmonic currents can cause alternating current (ac) motors and transformers to overheat. It also describes the use of passive or active filters and the transformer phase-shifting technique to offset phase-to-phase harmonic current. Therefore, when we developed our system architecture, we combined IEEE’s power distribution structure and the phase-shifting technique of a zigzag winding transformer to achieve harmonic reduction. We employed different zigzag winding combinations to generate various simulation results.1-5
In developing this article, we referenced the few technical articles that discuss the use of a transformer and phase shifting to eliminate harmonics distortion. Combining common transformer wiring methods and various phase-shifting combinations enabled us to develop an optimal transformer winding configuration.6 (See Figure 1.)
Figure 2. Transformer efficiency comparison chart
High levels of harmonic distortion can affect many vital components of the power system, including transformers, and may cause the temperature of motor cores to rise significantly. Using lower iron-loss cores is the only way to ensure high harmonic resistance performance, and also meet carbon dioxide emissions requirements. 5, 7-9 (See Figure 2.)
Figure 3. Core temperature comparison
Harmonic currents caused by source voltage distortions typically cause significant heating in ac motors, transformers, and any magnetic electrical device that employs ferrous metal in the flux path (See Figure 3). With increasing current frequency, stator windings, rotor circuits, and stator and rotor laminations tend to dissipate additional heat due primarily to eddy currents (exponential loss), hysteresis (linear loss), and, to a lesser degree, skin effect (linear loss). Leakage (e.g., stray) fields set up by harmonic currents in stator and rotor end windings also produce extra heat in any surrounding or nearby metal, according to Arrillaga, et al. [B3]) chapter 4.5.3.2.3.
Problem Definition
Data center operations differ from electronics operations. In data centers, enterprises add IT equipment to meet business demand, and the specifications of equipment installed by leased tenants may be unknown to operators. Therefore, huge financial losses or other damages could result if IT equipment is selected and installed without considering the use of passive/active harmonic filters to handle harmonic distortion. (See Figures 4 and 5.)
Figure 4. Commonly seen data center power system harmonics (voltage) (K Factor 38.81)
Figure 5. Commonly seen data center power system harmonics (Current) (K Factor 39.26)
Also when IT equipment is modified, added, or removed, the capacity of the filter must be adjusted to match the new system’s capacity and levels of harmonic distortion. The facility owner may object to this arrangement as well as to the extra costs. Electrical engineers must develop power quality strategies that can meet these objections.
Method: Isolation and Elimination (IE)
Focusing on the power system architecture and the harmonic problems discussed previously, our team used Matlab Simulink software to simulate power quality problems, test solutions, and identify an optimum solution to develop new products to test in an experiment.
Figure 6. Overall power quality strategy for environmental protection and energy saving
First, we designed a power system architecture that isolated IT equipment from power equipment and that also used new low-temperature core products to help meet environmental protection, energy saving, and carbon reduction requirements as well as reduce required HVAC energy consumption. An amorphous dry-type low temperature K Type zigzag Dz0/2 winding transformer with isolation feature was the main component of this system. See Figures 6-12; Figures 11 and 12 show before and after performance characteristics.
In the past, project grounding concepts were not clearly defined, and engineers would not be familiar with actual site conditions, resulting in confusing grounding system connections. IEEE 1100 is rigorous when it comes to IT equipment grounding; therefore, achieving clean grounding across systems can be a major challenge. It is essential to establish an overall grounding system color code management to avoid wiring mismatches that lead to system downtime.
Outdoor wiring and conduit should bond to the building’s main grounding system to assure the concept of “all grounding and bonding terminated at single mass of earth point.” The overall grounding system comprises branches of each functional grounding system from the main grounding system. Connections between systems should not be improperly mixed in order to achieve isolated grounding functionality. Color coding differentiates between systems (See Figure 13).
The outdoor equipment enclosure grounding should be location specific, rather than being part of the common grounding system. For example, the chassis of the distribution panel on the rooftop should be bonded to adjacent outdoor equipment to ensure equipotential grounding and bonding (See Figure 14).
In addition, lightning risk should be evaluated in accordance with International Electrotechnical Commission (IEC) 62305-2 Protection standards, and the results should be used to build lightning protection equivalent to the grounding. Color coding the ground wire system can minimize problems in the future. Figure 15 is a recommended system.
Cost-benefit Analysis
At present, the power system architecture is only a single-layer. Starting in the second half of next year, there will be several newly constructed data center projects that adopt the IE method in dual-layer power system architectures, in which the IT equipment will use Amorphous K-20 grade with Dy and Dz zigzag winding transformers, and the power equipment will use K-4 grades with Dy and Dz zigzag winding transformers. We shall obtain test data during project commissioning to verify the cost benefit.
IE can be applied to different load characteristics by way of traditional power transformer windings to achieve power quality improvement. Not only we can increase the functionality of a transformer, which is already on the required equipment list, but we can also achieve harmonic reduction.
References
1. Design of Delta Primary – Transposed Zigzag Secondary (DTz) Transformer to Minimize Harmonic Currents on the Three-phase Electric Power Distribution System. Chairul Gagarin Irianto, Rudy
2. Three Phase Transformer Winding Configurations and Differential Relay Compensation. Lawhead, Larry; Hamilton, Randy; and Horak, John. Basler Electric Company.
3. IEEE Recommended Practice for Powering and Grounding Electronic Equipment (IEEE std 1100-2005)
4. A Probabilistic Analysis on the Harmonic Cancellation Characteristics of the Scott Transformer. Mazin, Hooman Erfanian and Gallant, Joey. Department of Electrical and Computer Engineering, University of Alberta, Edmonton, Canada.
5. Transformer Based Solutions to Power Quality Problems. de León, Francisco and Gladstone, Brian, Plitron Manufacturing Inc, and van der Veen, Menno, Ir. buro Vanderveen.
6. Power System Harmonic Effects on Distribution Transformers and New Design Considerations for K Factor Transformers. Jayasinghe, N.R; Lucas, J.R; and Perera Setiabudy, K.B.I.M; and Hudaya, Chairul.
7. Review and The Future of Amorphous Metal Transformers in Asia 2011 edition by Asia Energy Platform 2011
8. The Performance of Silicon and Amorphous Steel Core, Distribution Transformers at Ambient and Cryogenic Temperatures. Bodger, Pat; Harper, David; Gazzard, Matthew; O’Neill, Matthew, and Enright, Wade.
9. Wide Temperature Core Loss Characteristic of Transverse Magnetically Annealed Amorphous Tapes for High Frequency Aerospace Magnetic. Niedra, Janis N. and Schwarze, Gene E.
Figure 7. (Top, middle, bottom) Sub-systems architecture
Figure 8. (Left) Secondary side of transformer. Figure 9. (Right) Primary side of transformer.
Figure 10. Total effect of the high-voltage side
Figure 11. AMVDT_1000 kVA Dz0 Zigzag Dry Type HV Transformer/K-20 AMVDT 30 VA Dz0/2LVTransformer
Figure 12a. System before improvement
Figure 12b. System after improvement
Figure 13. Building grounding
Figure 14. Outdoor grounding
Figure 14. Outdoor grounding
Kuo-Chuan Chu is a licensed PE, who founded Sunrise Professional Engineering Company in 1994. He served as the president of Taiwan Professional Electrical Engineering Association from 2005 to 2007, obtained APEC and international engineer qualification in 2008, and served as chairman of the Taiwan International Project Management
Mr. Chu possesses a wide range of professional licenses and certifications including Uptime Institute Accredited Tier Designer (ATD). He was the first ATD data center designer in Asia.
Some representative projects include Taiwan Mobile’s Cloud IDC project (the first Uptime Institute Tier III Constructed Facility in North Asia, NCHC National Center for High-Performance Computing, China Medical University Hospital, Changhua Christian Hospital, and Yuan-lin branch LEED-NC/HC.
Solving Air Contaminant Problems in Data Centers
/in Operations/by Kevin HeslinRoHS-compliant products exacerbate the problem
By Christopher Muller, Dr. Prabjit Singh, G. Henry White, and Paul Finch
End users have worried about the reliability of electronic gear almost since the introduction of the circuit board. Restrictions on Hazardous Substances (RoHS), or lead-free, manufacturing regulations for electronic equipment that went into effect in 2006 only served to increase their concerns. Today companies selling consumer electronics, industrial process, and control systems products in the European Union and a few other European nations that adhere to RoHS regulations must be aware of a number of additional obligations. RoHS-compliant datacom and IT equipment, in particular, are at risk in locations with poor ambient air quality. Some data centers in urban locations have reported failures of servers and hard disk drives caused by sulfur corrosion.
As a result, new industry-accepted specifications include particulate contamination limits that specify the quantity and deliquescent relative humidity of dust. Additionally, research by ASHRAE’s Technical Committee 9.9 for Mission Critical Facilities, Technology Spaces, and Electronic Equipment led to the publication of a white paper on contamination guideline for data centers1 and the formulation of new gaseous contamination limits used to update International Society of Automation (ISA) Standard 71.04-2013.2 This research also led to the publication of an International Electronics Manufacturing Initiative (iNEMI) position paper3 and efforts to update the Chinese data center design guide GB 50174-2008.4
The Lead-Free Transition
Industry did not foresee one failure mechanism caused by the transition to lead-free products mandated by RoHS. Products with an immersion silver (ImmAg) surface finish will creep corrode in environments that electronic equipment manufacturers consider to be high sulfur (ISA Class G2 or higher).5 In high-pollution locations around the world, as a result, the number and types of corrosion failures have increased dramatically. The common component failures include hard disk drives (HDD), graphic cards, motherboards, DIMMs, capacitors, and transistors. In fact, the rate of failure has become so severe that many of the world’s leading IT and datacom equipment manufacturers have changed their warranties to include requirements for the control of corrosion due to gaseous contamination:
• Dell PowerEdge R310 Rack Server – The following airborne contaminant level supersedes the information that is present in the Getting Started Guide of your system: Airborne Contaminant Level Class G1 as defined by ISA-S71.04-1985.6
• IBM Power7 Server Series – Severity level G1 as per ANSI/ISA 71.04-1985, which states that the reactivity rate of copper coupons shall be less than 300 angstroms (Å)/month (≈ 0.0039 micrograms per square centimeter-hour
[μg/cm2-hour] weight gain). “In addition, the reactivity rate of silver coupons shall be less than 300Å/month (≈ 0.0035 μg/cm2-hour weight gain). The reactive monitoring of gaseous corrosivity should be conducted approximately 2 inches (5 cm) in front of the rack on the air inlet side at one-quarter and three-quarter frame height off the floor or where the air velocity is much higher.7
• HP Integrity Superdome 2 Enclosure – Specification: Gaseous contaminants must be at the G1 level or less as defined by ISA Standard ISA-71.04-1985.8
Contamination Control Process
With the changes to IT and datacom equipment mandated by various RoHS directives, data center owners, managers, and operators should include an environmental contamination monitoring and control section as part of an overall site planning, risk management, mitigation, and improvement plan.
The three parts of this plan should comprise:
1. Considerations for the assessment of the outdoor air and indoor environment with regards to corrosion potential. ISA Standard 71.04 can be used to provide site-specific data about the types and levels of gaseous contamination in the amount of corrosion being formed. Corrosion classification coupons (CCCs) can be used as a survey tool to establish baseline data necessary to determine whether environmental controls are needed and, if so, which ones.
2. A specific contamination control strategy. Corrosion in an indoor environment is most often caused by a short list of chemical contaminants or combination of contaminants. The contaminants present in a specific area are highly dependent on the controls put in place to mitigate them. Most of this would involve the selection and application of the appropriate chemical filtration systems to clean both the outdoor air being used for pressurization and/or ventilation as well as any recirculation air.
3. A real-time environmental monitoring program based on the severity levels established in ISA Standard 71.04. Real-time atmospheric corrosion monitors can provide accurate and timely data on the performance of the chemical filtration systems as well as the room air quality.
Often the relationship between corrosion levels and hardware failures in data centers is overlooked or unknown. However, AMD, Cisco, Cray, Dell, EMC, Huawei, Hitachi, HP, IBM, Intel, Oracle, Seagate, SGI, and others are working hard to increase awareness of the problem and it solutions. These manufacturers are also working to develop successful corrosion monitoring and control programs.
Data Center Design and Operation Requirements
Data centers are dynamic environments where maintenance operations, infrastructure upgrades, and equipment changes take place regularly, leading to possible introduction of airborne contaminants. Data centers also house other contaminants, such as chlorine, that can be emitted from PVC insulation on wires and cables if temperatures get too high.
However, outdoor air used for ventilation, pressurization and/or cooling remains the primary source of airborne contaminants. The growing use of air-side economizers for free cooling, means that even data centers located in regions without major air quality concerns may struggle to maintain an environment conducive to the protection of sensitive electronic equipment. Air used for any of these purposes should be cleaned before being introduced into the data center.
To meet warranty requirements for new IT and datacom equipment, data center owners and operators must take action to eliminate airborne contaminants from these sources. These steps include:
• Measure the reactivity (corrosion) rates inside the data center and in the outdoor air
• Seal all doors, windows, and wall penetrations in the data center
• Install room pressure monitors if the data center envelope is designed to be
positively pressured
• Measure airflow at the supply and exhaust air grills, and at each computer
room air-conditioning (CRAC) unit
• Develop a temperature and humidity profile
It is incumbent upon data center managers to maintain hardware reliability by monitoring and controlling both the gaseous and particulate contamination in their data centers. ASHRAE, in cooperation with many of the world’s leading manufacturers of computer systems, has developed guidelines that summarize the acceptable levels of contamination (See Table 1).
Table 1. Particulate and gaseous contamination guidelines for data centers
Environmental Assessments
ISA Standard 71.04-2013 Environmental Conditions for Process Measurement and Control Systems: Airborne Contaminants describes a simple quantitative method to determine the airborne corrosivity in a data center environment. This method, called “reactivity monitoring” involves the analysis of copper and silver sensors that have been exposed to the environment for a period of time to determine corrosion film thickness and chemistry. Silver reactivity monitoring done as part of the assessment provides a complete accounting of the types of corrosive chemical species in the data center environment.
ISA 71.04 classifies four levels of environmental severity for electrical and electronic systems providing a measure of the corrosion potential of an environment (See Table 2). The overall classification is based on the higher of the total copper and silver reactivity rates.
Corrosion Monitoring
Many options can be considered with respect to air quality monitoring for data center applications. Proper assessment of environmental conditions in the data center requires monitoring of outdoor and ambient air at various locations inside and outside the data center. In addition, consideration should be given to room size and layout to determine the proper placement and type of CCCs, which can help determine compliance with air-quality specifications, and real-time atmospheric corrosion monitors (ACMs). Data from the ACMs can help provide a statistically valid environmental assessment of corrosion rates and of corrosion control strategies. Either monitoring technique may be used to provide the data necessary to troubleshoot and mitigate contamination issues inside the data center.
Table 2. Classification of reactive environments
CCCs are typically used for an initial survey of ambient (outdoor) air quality and the data center environment and may be used on a continuing basis to provide historical data. This is especially important where equipment warranties specify establishing and maintaining an ISA Class G1 environment. Seasonality is a major issue, and outdoor air should be assessed at different times during the year.
Real-time monitoring may also be used but should be limited to the data center environment. Where corrosion problems have been identified, ACMs placed in a number of locations can help determine if contamination is widespread or limited to a specific area. Once a baseline has been established, some of the monitors could be redeployed around the problem area(s) to gauge the effectiveness of contamination control strategies. Once the data center environment is under control and meets the conditions set forth in the manufacturers’ warranties, one can determine the best permanent ACM locations for specific needs.
There is general confidence that corrosion monitoring can be used to identify contaminant types, e.g. active sulfur, sulfur oxides, and inorganic chloride. These determinations can be verified using independent sources of environmental data (air pollution indices, satellite data, etc.) to verify the results obtained from corrosion monitoring.
Contamination Control Case Studies
The following sections include the results of environmental assessments, design, and application of chemical filtration systems and ongoing monitoring of mission critical areas from a number of data centers around the world where corrosion-related electronic equipment failures were reported.
Case Study 1. ISP Data Center
A representative of an internet service provider (ISP) reported a number of equipment failures in one of its data centers. The primary IT equipment vendor determined that the majority of failures were due to sulfur creep corrosion, most likely caused by high levels of motor vehicle pollution.
Reactivity monitoring performed inside the data center and the adjoining UPS battery room according to ISA Standard 71.04 indicated a Class GX – Severe classification for both rooms, with high levels of sulfur contamination (copper sulfide, Cu2S) in both rooms and extremely high levels of chlorine contamination (silver chloride, AgCl) in the battery room. These results are summarized in Table 3.
Table 3. CCC monitoring results – baseline data
Based on these results and advice from the IT equipment vendor, the ISP facility manager added chemical filtration inside the data center and the battery room. Based on the size of the two spaces and the amount of air that needed to be cleaned, the data center required nine stand-alone self-contained chemical filtration systems and the battery room required two systems. These systems were optimized for the control of the acidic corrosive contaminants identified by the CCC monitoring.
Table 4. CCC monitoring results – with chemical filtration systems installed
Within a few days after the chemical filtration systems were installed and operational, dramatic decreases in the copper and silver corrosion rates were observed in both rooms with each now showing severity levels of ISA Class G1 (See Table 4). Further, there was no evidence of either sulfur or chlorine contamination inside either room.
Case Study 2. Internet Data Center
A small data center for a global consulting and IT outsourcing firm was experiencing repeated failures of a single component. The manufacturer performed monitoring with CCCs and found that the continuing failures were due to high sulfur content in the ambient air. The firm installed a single air cleaning system to clean and recirculate this air within the data center and an ACM to gauge the effectiveness of the chemical filtration system.
Figure 1. Reactivity monitoring data before and after chemical filtration was installed.
Data from the ACM were continuously collected the week before the air cleaning unit was installed and the week after chemical filtration was in place. Examination of the copper data indicated a Class G1 environment throughout the monitoring period; whereas, the silver corrosion rate dropped from ISA Class G2 to ISA Class G1 (See Figure 1). No further equipment failures have been reported.
Case Study 3. Auto Manufacturer
An automobile company was planning to expand its manufacturing capacity by building a second production facility. Ambient air quality near its location was extremely poor due to high levels of motor vehicle pollution as well as significant industrial activity in the region. A large number of IT equipment failures had been experienced in the original production facility’s IT center, which resulted in the addition of chemical filtration systems and the use of several ACMs.
During the planning stage for this second production facility, the manufacturer decided to provide for chemical filtration and air monitoring in the design of the IT center to prevent corrosion problems inside the equipment rooms (See Figure 2).
The auto manufacturer started reactivity monitoring with ACMs at the time the IT equipment became operational, and the results indicated a significant reduction in the total amount of contamination in the IT center. However, the silver corrosion rates fluctuated around the Class G1/G2 breakpoint (See Figure 3).
After re-examining the layout of the IT center, it determined that significant amounts of untreated outdoor air were being introduced into the protected spaces through the main entrance.
Figure 2. Automotive manufacturer’s IT center layout showing location of chemical filter systems.
Although the silver corrosion rate was near the specified ISA Class G1, the owner and the IT equipment vendors agreed that steps should be taken to eliminate untreated outdoor air from the IT center Modifications to the facility were proposed and work is ongoing.
Case Study 4. Bank
The other three case studies describe the use of chemical filtration inside the protected spaces. In this example, the owner wanted to clean all the outdoor air that was being used to pressurize the data center space. This bank building was located in a major metropolitan area with high levels of sulfur contamination from coal-burning power plants as well as motor vehicle traffic.
Because the air quality was so poor relative to the IT equipment manufacturers’ air quality guidelines, air cleaning would be accomplished by:
1. Installing a chemical filtration system at the outdoor air intake of the existing HVAC system
2. Adding another chemical filtration system to deliver additional clean pressurization air under the raised floor in the data center to supplement the outdoor ventilation air
Figure 3. Reactivity monitoring data for an auto manufacturer’s IT center
3. Installing three standalone chemical filters systems inside the data center to provide for complete distribution of the clean air. Air monitoring after chemical filtration had been installed showed a tremendous improvement in the data center air quality. Average results from 15 monitoring locations indicated an ISA Class G1 environment for both copper and silver with no evidence of sulfur contamination. These results are summarized in (See Table 5).
A few locations showed ISA Class G2 severity levels, with no specific external or internal sources of contamination identified. Team members suggested moving the CA units to provide better air distribution in these locations in an effort to maintain Class G1 area throughout the data center. Monitoring with CCCs is ongoing.
Case Study 5. Telecommunications Company
This company experienced continuing problems with corrosion-related failures of switchgear and network cards in one of its mobile switching centers (MSC). A chemical filtration system reduced the number of failures per month from an average of 36 per month to ~20 after five months of operation. Although this represented a significant improvement, the owner wanted to improve this performance even further.
The chemical filtration system had been designed to deliver the specified amount of cleaned air to the MSC when running at 70% capacity. The system was adjusted to increase the amount of air delivered to the MSC. The system is now operating at 90% capacity and since then the number of failures has dropped below 10 per month (See Figure 4).
The IT manager is currently considering whether to add additional chemical filtration systems to see if corrosion-related failures can be eliminated altogether.
Figure 4. Reduction in MGW/MSS cards with corrosion failures.
Table 5. Reactivity monitoring results after addition of chemical filtration systems.
Case Study 6. Telecommunications Company 2
This company experienced problems with IT equipment failures and was not willing to provide space inside the data center for chemical filtration systems. It was also discovered that the existing HVAC system supplying ventilation air could not be modified to accept chemical filters. Therefore, the only option available was to replace the existing particulate filters installed in the CRAC units located inside the data center with combination particulate/chemical filters.
Before committing to upgrading all of the CRAC units serving the data center, the owner wanted to determine whether this was a practical and effective solution. As a test, the filters in one CRAC unit were replaced with these combination filters and reactivity monitoring was performed at the inlet of the CRAC unit and in the Cold Aisle supplied by this unit.
Reactivity monitoring performed with an ACM for several days prior to the installation of the new filters indicated an ISA Class G1 copper severity rate but a mid-to-high Class G2 rate for silver. After installation of the filters, the silver reactivity rate immediately fell almost 90% (See Figure 5). This result convinced the customer to put these combination chemical/particulate filters in the all of the remaining CRAC units. The data center has not reported additional equipment failures.
Conclusions
Data centers located in areas with high ambient air pollution, whether from stationary or mobile sources, can experience corrosion-related hardware failures due to the changes in electronic equipment first mandated by the implementation of the European Union (EU) RoHS regulations in 2002 and in more than a dozen countries since that time.
Figure 5. Performance of chemical filters in a CRAC unit.
These regulations, along with the continuing reductions in circuit board feature sizes and miniaturization of components necessary to improve hardware performance, makes today’s electronic hardware more prone to attack by airborne contaminants. Manufacturers have to maintain the reliability of their equipment; therefore, the need to control airborne contaminants and to specify acceptable limits in data centers is now considered to be critical to the continued reliable operation of datacom and IT equipment.
Increases in corrosion-related electronic hardware failures have led to new IT and datacom equipment warranties that require environmental corrosion (reactivity) monitoring and control of airborne contamination where necessary. These additional measures are especially important for urban areas with elevated pollution levels and for locations near industrial facilities, seashores, and other sources that could produce corrosive airborne contaminants.
ISA Standard 71.04 has been updated to now include silver corrosion monitoring as a requirement in determining environmental severity levels. Many manufacturers of datacom and IT equipment currently reference this standard in their site planning / preparation guidelines as well as their terms and conditions for warranty compliance. The addition of silver corrosion rates as a required metric serves to bridge the gap between ambient environmental conditions and the reliability of RoHS-compliant (lead-free) electronic equipment.
Ongoing research will serve to further refine Standard 71.04 both quantitatively and qualitatively. This along with continuing advancements in the monitoring and control of corrosive contaminants will help to prevent costly and potentially catastrophic failure of critical electronic equipment.
References
1. ASHRAE. 2011. 2011 Gaseous and Particulate Contamination Guidelines for Data Centers. Atlanta: American Society of Heating, Refrigerating, and Air-Conditioning Engineers, Inc.
2. ISA. 2013. ANSI/ISA 71.04-2013 (in print): Environmental Conditions for Process Measurement and Control Systems: Airborne Contaminants. Research Triangle Park: International Society for Automation
3. iNEMI 2012. iNEMI Position Statement on the Limits of Temperature, Humidity and Gaseous Contamination in Data Centers and Telecommunication Rooms to Avoid Creep Corrosion on Printed Circuit Boards
4. China National Standard GB 50174-2008: Code for Design of Electronic Information System
5. Muller, C.O. and Yu, H., “Controlling Gaseous and Particulate Contamination in Data Centers,” Proceedings of SMTA China South Technical Conference, Shenzhen, China, 2012.
6. Airborne Contaminant Level Update. July, 2010. © 2013 Dell Inc.
7. Power7 information: Environmental design criteria. July, 2012. © 2013 IBM Corporation.
8. Muller, C. and Yu, H., 2013. “Air Quality Monitoring for Mission Critical / Data Center Environments,” CEEDI White Paper on Data Center Monitoring Systems, China Electronics Engineering Design Institute, Beijing, China.
He has written and spoken extensively on the subject of environmental air quality and the application and use of gas-phase air filtration, corrosion control and monitoring, electronic equipment reliability, and RoHS and counts over 120 articles and peer-reviewed papers, more than 100 seminars, and 7 handbooks to his credit. Mr. Muller has edited chapters in two handbooks on the application and use of gas-phase air filtration, wrote the chapter on gas-phase air filtration in the NAFA Air Filtration Handbook and the chapter on airborne molecular contamination in the Semiconductor Manufacturing Handbook published by McGraw-Hill.
Mr. Muller has consulted on the development of environmental air quality guidelines in mission critical applications for companies such as Dell, Google, HP, Huawei, IBM, and Morgan Stanley. He has worked with the China Electronics Engineering Design Institute (CEEDI) to update China National Standard GB 50174-2008: Code for Design of Electronic Information System.
Dr. Singh received a B. Tech. from the Indian Institute of Technology and an MS and Ph.D. from the Stevens Institute of Technology, all in the field of metallurgical engineering. Recently, he received a MS in microelectronic manufacturing from Rensselaer Polytechnic Institute and an MS in electrical engineering from the National Technological University. He is an adjunct professor of electrical engineers at the State University of New York at New Paltz.
Henry White joined HP in 1980, where he has mainly served in HP Focus on Customer Site Environment for product reliability, safety, and POR-like efficiencies. His experience in this area includes site-caused product corrosion, power quality, lightning protection, high-density data center cooling, electrical codes, safety, and regulatory engineering. ped the on-site measurement techniques in China for site-specific corrosion.
Within that framework, he has visited many customer sites worldwide to measure and gauge problems. He used developing techniques to understand zinc whiskers and their effects. He has also develo
Mr. White has conducted and delivered training for Worldwide HP field teams to understand site-specific topics and better serve HP customers. In parallel with his duties for site environment characterization, he utilizes HP’s ISO 9001 Quality Management processes for new large server introductions and HP Cloud programs to continually improve its product offerings.
Paul Finch is a technical director, EMEA Design & Construction, at Digital Realty. He is the leading expert for mechanical engineering and energy engineering having both strategic and project responsibilities. Since joining the company in 2010, he has published a collection of European design engineering guides and led many successful major developments across London, Amsterdam, Paris, Dublin, and Singapore markets. Mr. Finch has more than 25 years of progressive experience in engineering, construction and property consulting, focused on technical real estate and high dependency mission critical environments in the banking and finance, technology and telecommunications sectors.
TELUS SIDCs provide support to widespread Canadian network
/in Design/by Kevin HeslinTELUS SIDCs provide support to widespread Canadian network. SIDCs showcase best-in-class innovation and efficiency
By Pete Hegarty
TELUS built two Super Internet Data Center (SIDC) facilities as part of an initiative to help its customers reap the benefits of flexible, reliable, and secure IT and communication solutions. These SIDCs, located in Rimouski, Quebec, and Kamloops, British Columbia, contain the hardware required to support the operations and diverse database applications of TELUS’ business customers, while simultaneously housing and supporting the company’s telecommunications network facilities and services (see Figures 1 and 2). Both facilities required sophisticated and redundant power, cooling, and security systems to meet the organization’s environmental and sustainability goals as well as effectively support and protect customers’ valuable data. A cross-functional project team, led by Lloyd Switzer, senior vice-president of Network Transformation, implemented a cutting-edge design solution that makes both SIDCs among the greenest and most energy-efficient data centers in North America.
Figure 1. Exterior photo of the Kamloops SIDC
TELUS achieved its energy-efficiency goals through a state-of-the-art mechanical design that significantly improves overall operating efficiencies. The modular design supports Concurrent Maintenance, a contractually guaranteed PUE of 1.15, and the ability to add subsequent phases with no disruption to existing operations.
Both SIDCs allow TELUS to provide its customers with next-generation cloud computing and unified communication solutions. To achieve this, teams across the company came together with the industry’s best external partners to collaborate and drive innovation into every aspect of the architecture, design, build, and operations.
Best-in-Class Facilities
The first phase of a seven-phase SIDC plan was completed and commissioned in the fall of 2012. The average cabinet density is 14 kilowatts (kW) per cabinet with the ability to support up to 20 kW per rack. The multi-phased, inherently modular approach was programmed so that subsequent phases will be constructed and added with no disruption to existing operations. Concurrent Maintainability of all major electrical and mechanical systems is achieved through a combination of adequate component redundancy and appropriate system isolation.
Both SIDCs have been constructed to LEED environmental standards and are 80% more efficient than traditional data center facilities.
Other expected results of the project include:
Figure 2. Exterior photo of Rimouski SIDC
• Water savings: 17,000,000 gallons per year
• Energy savings: 10,643,000 kilowatt-hours (kWh) per year
• Carbon savings: 329 tons per year
The SIDCs are exceptional in many other ways. They both:
• Use technology that minimizes water consumption, resulting in a Water
Usage Effectiveness (WUE) of 0.23 liters (l)/kWh, approximately four times
less than a traditional data center.
• Provide protected power by diesel rotary UPS (DRUPS), which eliminates
the need for massive numbers of lead-acid batteries that are hazardous
elements requiring regular replacement and safe disposal. The use of DRUPS
also avoids the need for large rooms to house UPS and their batteries.
• Use a modular concept that enables rapid expansion to leverage the latest IT,
environmental, power, and cooling breakthroughs providing efficiency gains
and flexibility to meet customers’ growing needs (see Figures 3 and 4).
Figure 2. Exterior photo of Rimouski SIDC
TELUS’ data center in Rimouski is strategically located in a province where more than 94% of the generation plants are hydroelectric; the facility operates in free-cooling mode year-round, with only 40 hours of mechanically assisted cooling required annually. The facility in Kamloops enjoys the same low humidity and benefits from the same efficiencies.
Both SIDCs received Tier III Certification of Design Documents and Tier III Certification of Constructed Facility by the Uptime Institute. The city of Rimouski awarded TELUS the Prix rimouskois du mérite architectural (Rimouski Architectural Award) recognizing the data center for exceptional design and construction, including its environmental integration.
Figure 3. Both TELUS SIDCs are based on modular designs
Green Is Good
TELUS teams challenged themselves to develop innovative solutions and new processes that would change the game for TELUS and its customers. Designed around an advanced foundation of efficiency, scalability, reliability, and security, both SIDCs are technologically exceptional in many ways.
Natural cooling: With a maximum IT demand of 16.2 megawatts, the facilities will require168 gigawatt-hours per year. To reduce the environmental impact of such consumption, TELUS chose to place both facilities in areas well known for their green power generation and advantageous climates (see Table 1).
When mechanical systems are operating, a Turbocor compressor (0.25 kW/ton) with magnetic bearings provides 4-5ºF ∆T to supplement cooling to the Cold Aisles. Additionally, the compressor has been re-programmed to work at even higher efficiency to operate within the condensing/evaporating temperature ranges of the glycol/refrigerant of this system.
This innovative approach was achieved through collaboration between TELUS and a partner specializing in energy management systems and has been so successful that TELUS is delivering these same dramatic cooling system improvements in some of its existing data centers.
Modular design: The modular concept enables rapid expansion while leveraging the latest IT, environmental, power and cooling breakthroughs. Additional modules can be added in as little as 16-18 weeks and are non-disruptive to existing operations. The mechanical system is completely independent, and the new module “taps” into a centralized critical power spinal system. By comparison, traditional data center capacity expansions can take up to 18 months.
Figure 4. Module in fabrication at the factory
The modular mechanical system provides a dual refrigerant and water-cooled air-conditioning system to the racks. From a mechanical perspective, each pod can provide up to 2N redundancy with the use of two independent, individually pumped refrigerant cooling coil circuits. The two cooling circuits are fully independent of one another and consist of a pump, a condenser, and a coil array (see Figure 5).
The approach uses a pumped refrigerant that utilizes latent heat to remove excess server heat. The use of micro-channelized rear-door coils substantially increases overall coil capacity and decreases the pressure drop across the coil, which improves the energy efficiency.
The individual modules are cooled by closed-circuit fluid coolers that can provide heat rejection utilizing both water and non-water (air-cooled) processes. This innovative cooling solution results in industry-leading energy efficiencies. The modules are completely built off site, then transported and re-assembled on site.
As a result, the efficiency across utilization (measured in terms of PUE) is significantly improved compared to traditional data center designs. While the PUE of a traditionally designed data center can range from as high as 3.0 to as low as 1.6 in a best-case scenario (approximately at 80% usage), both TELUS facilities have a PUE utilization curve that is almost flat, varying from 1.3 (at no load) to 1.15 (at 100% load). (See Table 2).
The Electrical System
A world-class SIDC runs on solid pillars, with one of them being the electrical system (See Figure 6). This system acts as the foundation of the data center, and consistent reliability was a key component in the planning and design of both TELUS facilities.
Table 1. The moderate climates of Kamloops and Rimouski enable the SIDCs to achieve low emissons.
The main electrical systems of both SIDCs operate in medium voltage, including the critical distribution systems. Incoming power is conditioned and protected right from the entrance point, so there are no unprotected loads in either facility.
Figure 5. TELUS cooling system employed at Kamloops and Rimouski
Figure 6. Physical separation of A and B electrical systems ensures that the system meets Uptime Institute Tier III requirements.
Behind the fully protected electrical architecture is a simple design that eliminates multiple distribution systems. In addition, the architecture ensures that the high-density environments in the IT module do not undergo temperature fluctuations—due to loss of cooling—when switching from normal to emergency power. Other important benefits include keeping short-circuit currents and arc flashes to manageable levels.
The DRUPS are located in individual enclosures outside the building, and adding units to increase capacity is a relatively easy and non-intrusive activity. Since the system is designed to be fully N+1, any of its machines can be removed from service without causing any disruption or limitation of capacity on the building operations. Each of these enclosures sits on its own fuel belly tank that stores 72 hours of fuel at full capacity of the diesel engines.
The output of the DRUPS is split and collected into a complete 2N distribution system—A and B. The main components of this A and B system are located in different rooms, keeping fire separation between them. The entire distribution system was designed with the concept of Concurrent Maintainability. This means that the A or B side of the distribution can be safely de-energized without causing any disruption to IT or mechanical loads.
The electrical system uses the same concept as the architectural distribution. Each module connects to the main distribution, and the introduction of new modules is performed without affecting the operation of the existing ones.
In order to do this, each module includes its own set of critical and mechanical substations (A and B in both cases) that deliver low voltage to the loads (RPPs, mechanical CDUs, pod fans) in the form of bus ducts that run along both service corridors. Each rack receives two sets of electrical feeders from the A and B systems, where power is distributed to the servers through intelligent and metered PDUs.
Figure 7. The mechanical cooling system avoids any single point of failure.
The Mechanical System
If the electrical system is one of the pillars of the SIDCs, the mechanical system is another (see Figure 7). In today’s IT world, server density grows, and because the servers are installed in relatively narrow spaces, keeping a controlled environment where temperature does not undergo large or fast fluctuations and air flows clean and without restriction, is key to the reliability of those servers. As indicated above, the entire cooling system is protected with UPS power and provides the first line of defense against those fluctuations.
The SIDC modules are cooled with a sophisticated, yet, architecturally simple, mechanical system that not only allows for an adequate environment for the IT equipment but is also extremely efficient.
Many technologies today are achieving extremely low PUEs—especially compared to the old days of IDCs with PUEs of 2.0 or worse—but they do that at the expense of significant consumption of water. The TELUS SIDC cooling technology, the first of its kind in the world, not only runs at low PUE levels, but also is extremely frugal in the use of water. For ease of illustration, the system can be divided in its three main components:
1. The elements that capture heat immediately after it’s produced, which increases efficiency to its maximum possible as the hot air does not have to travel far. The facilities achieve this with edge devices—rear door coils or coils situated in the superior part of the Hot Aisle. Multiple fans push the cooled air onto the Cold Aisle to re-enter the IT gear through the front of the racks.
With this arrangement of fully contained Cold Aisles/Hot Aisles, air recirculates with only a minimum contribution of outside air provided by a make-up system. Among many advantages of the system, the need for small quantities of outside air makes it appropriate for installation in virtually any environment as the system is not prone to be affected by pollution, smoke, or any other agent that should not enter the IT space.
2. The CDUs are extremely sophisticated heat exchangers, which ensure the refrigerant lines are always kept within temperature limits. The heat interchange is done at maximum efficiency based on the temperature of the coolant in the return lines. If the temperature of this return is too high and doesn’t allow the refrigerant loop to remain within range, the CDU also has the intelligence and the capability to push this temperature down with the assistance of high-efficiency compressors.
3. The fluid cooler yard, which is situated outside the facilities and is responsible for the final rejection of the heat to the atmosphere. The fluid coolers run in free (and dry) cooling mode year-round except when the wet-bulb temperature exceeds a certain threshold, and then water is sprayed to assist in the rejection.
Table 2. The TELUS facilities maintain a relatively flat PUE across utilization
All of the above mentioned elements are redundant, and the loss of any element does not result in any disruption of the cooling they provide. The fluid coolers have been designed in an N+1 configuration where the CDUs and edge devices are fully 2N redundant, the same scenario as with both refrigerant and coolant loops.
Figure 8. Inside shot of a Cold Aisle at the Kamloops, SIDC
Figure 9. Inside shot of a Cold Aisle at the Rimouski SIDC
The TELUS Team
The TELUS project team challenged traditional approaches to data center design, construction, and operations. In doing so, it created opportunities to transform its approach to future data center builds and enhance existing facilities. The current SIDCs have helped TELUS develop a data center strategy that will enable it to:
• Achieve low total cost of ownership (TCO)
• Support long-term customer growth
• Maximize the advantages of technology change:
density and efficiency
• Align with environmental sustainability and
climate change strategy
• Enable end-to-end service capabilities: cloud/
network/device
• Provide a robust and integrated physical and
logical security
More than 50 team members from across the organization participated in the SIDC project, which involved a multiple-year process of collaboration across many TELUS departments such as Network Transformation, Network Standards, IT, Operations, and Real Estate.
Figure 10. Cold Aisle in fabrication at the factory
The completion of the SIDCs represented an ‘above and beyond’ achievement for the TELUS organization. The magnitude of the undertaking was significantly larger than any infrastructure work in the past. In addition to this, the introduction of a completely new infrastructure model and technology, in many ways revolutionary compared to the company’s legacy data centers, introduced additional pressure to ensure the team was choosing the right model and completing the necessary due diligence to ensure it was a good fit for its business.
Many of these industry-leading concepts are now being deployed across TELUS’ existing data centers, such as the use of ultra-efficient cooling systems. In addition, as a result of the knowledge and best practices created through this project, TELUS has established a center of excellence across IT and data infrastructure that empowers teams to continue working together to drive innovation across their solutions, provide stronger governance, and create shared accountability for driving its data center strategy forward.
Overcoming Challenges
A clear objective combined with the magnitude and high visibility of the undertaking, enabled the multi-disciplinary team to achieve an exceptional goal. One of the most important lessons for TELUS is the self-awareness that when teams are summoned for a project, no matter how large it is, they are capable of succeeding, if the scope and timelines are clear.
During construction of the Rimouski SIDC, the team experienced an issue with server racks, specifically with the power bars on the back. Although great in design, they ended up being too large, therefore preventing the removal of the power supplies from the backs of servers. Even though the proper due diligence had been completed, it wasn’t until the problem arose physically that the team was able to identify it. As a result, TELUS modified the design for the Kamloops SIDC and built mock-ups or prototypes to ensure this does not happen again.
Partners
TELUS worked with external partners on some of the project’s key activities, including Skanska (build partner), Inertech (module design and manufacturer), Cosentini (engineering firm), and Callison (architects). These partners were integral in helping TELUS achieve a scalable and sustainable design for its data centers.
Future Applications
Once TELUS realized the operational energy savings achieved by implementing the modular mechanical system, they quickly explored the applicability within existing legacy data centers. In fact, TELUS has recently completed the conceptual design of a retrofit within one of its existing facilities, and an additional feasibility study is currently underway for another of its existing data centers. The team has learned that it can utilize the existing central plant mechanical system with a similar, customized modular rack and cooling system that was installed in TELUS’ new SIDCs to achieve increased (density) capacity and much improved energy efficiency. And of significant importance, all of this can be accomplished without eliminating the legacy mechanical system.
TELUS’ intention is to start applying these highly efficient solutions to some of its large network sites as well. Some of the traditional legacy equipment is rapidly moving towards a much more server-like gear with a small footprint and large power consumption, which translates into more heat rejection. Large telecom rooms can be relatively easily retrofitted to host an almost completely contained “pod” that will be used for the deployment of those new technologies.
An Ongoing Commitment
When TELUS first started planning the SIDCs in Rimouski and Kamloops, it focused on four main pillars: efficiency, reliability, scalability, and security. And all four pillars were integral to achieving overall sustainability. These pillars are the foundation of the SIDCs and ensure they’re able to meet customer needs now and in the future. With that commitment in place, TELUS’ forward-thinking strategy and innovative approach ensure it will be considered a front-runner in data center design for years to come.
Pete Hegarty
Pete Hegarty has acquired a wealth of industry knowledge and experience in his more than 10 years at TELUS Communications, a leading national communications company, and 25 years in the telecommunications industry. His journey with TELUS has taken him through various positions in Technology Strategy, Network Planning, and Network Transformation. In his current role as Director of TELUS’ Data Centre Strategy, Mr. Hegarty leads an integrated team of talented and highly motivated individuals who are driving the transformation of TELUS’ data center infrastructure to provide the most efficient, reliable and secure Information communications technology (ICT) solutions in Canada.
Data Center Facility Owners See Modules as Efficient Way to Deploy Capital
/in Design/by Kevin HeslinCompass sets the course with new modular data center approach.
The term modular has been used to describe a variety of approaches to data center design. Historically, the first commercially available modular design was a 2007 Sun Microsystems container-based product called the Black Box. Today, the term describes products that range from shipping containers and simple repeated designs to fully manufactured IT spaces and MEP systems built in factories and shipped to various sites.
Many modular data center providers have written white papers that tout the benefits of their proprietary designs, but there are also some informative reports on the ins and outs of modular design. John Stanley of 451 Research presented the results of his survey work at the Uptime Institute Symposium in May 2012. He surveyed 35 companies that use and provide various types of modular solutions for data centers. His research pointed out that 65% of those surveyed deployed capacity in ‘chunky’ increments, specifically highlighting the need for small chunks of capacity per module or deployment to match growth of their data centers.
Compass has based its business strategy on this industry driver and five main features of modular design:
In the Green Grid paper, “Deploying and Using Containerized/Modular Data Center Facilities,” published in November 2011, the Green Grid demonstrated that modular data centers can follow capacity requirements more closely, freeing capital and keeping MEP systems more fully loaded than large-scale deployments. The authors of the paper showed that end users could employ their utility systems and floor spaces more fully, without undue concern for system exhaustion or space starvation. The authors discuss how small increments of capacity can follow compute demands more closely, with the caveat that the facility must also have a faster implementation cycle in order to match the changing IT requirements.
The data center industry is beginning to realize the benefits of the early industrial revolution. Standardized modular power center designs provide some of the same benefits to design and construction personnel. Instead of hand-building custom electrical systems for each data center, the modular approach allows for greater deployment speed, improved quality and lower costs, all achieved by using factory-based labor. The use of modules also relieves labor stacking on the job site, while reducing the overall cost of the work by a significant amount.
In his 1936 paper, Factors Affecting the Cost of Airplanes, T.P. Wright first quantified the cost savings that could be attained using factory labor. Wright showed that the direct labor cost of assembling an airframe decreased by roughly 20% for each doubling of the production numbers. In other words, if the labor cost of building one airframe was $1,000,000, the labor cost of building two of the same models might be $800,000 each. Doubling again would mean the cost of four the same airframes would be $640,000 each, or 36% lower than the first unique model.
Compass Data Centers intended to take advantage of this principle as it developed its patent-pending solution. In doing so, Compass has found that modular designs enable it to:
As a result, Compass has moved from building a prototype on every data center project to productizing the data center program and build.
Despite the fact that the industry has not settled on a clear definition of the ‘modular data center,’ it is attempting to evade this ambiguity by proclaiming the coming of ‘Version 2,’ which seems to include prefabrication as a fundamental element. Before, modular construction was associated with ISO containers and packaged chillers. Now, modularity is being embraced as synonymous with sound design and sound capital usage.
The Compass Deployment
Every data center design begins with the establishment of availability and power requirements – reliability and power density are the cornerstones of any data center specification. The business needs of the enterprise and the IT applications to be contained within the data center should drive these decisions.
Virtually every initial design addresses the project power requirements and references the Uptime Institute’s well-known Tier specifications to define reliability requirements. Uptime’s Tier Standard helps define the equipment and systems required to support the reliability and power demands of the business’s IT model. If the needs of a business are truly defined by an Uptime Tier III specification, then its data center design should be certifiable as a Tier III design.
Compass’ Truly Modular Architecture design provides for standard features such as RHI Modular Power Solutions’ Modular Power Center units, which are also built off-site, power modules that can be configured to provide a 2N power infrastructure, and N+1 mechanical systems. Other Compass architecture features include:
The standardized design of the Compass Modular Architecture provides assurance that the facility will be Tier III design certified. Internal auditors and external customers can not only be assured of the design certification, but also have the option to certify the facility itself. Importantly, the ability to productize a unique modular data center solution into a repeatable and well-defined process was a top priority. Modularizing data center components permits control over three primary variables:
Compass shares the view that these three variables are the only three points that end users actually care about. Compass also believes that modularity:
Some jurisdictions have misconceptions about modular or containerized solutions. They envision standard ISO shipping containers, assembled on-site, as the basis of the construction process.
Meeting the local authority having jurisdiction (AHJ) early in the project’s developmental cycle is an effective way to establish trust and dispel misconceptions. Providing an extensive amount of specific information on the modular components of the proposed data centers is a good way to start.
Next Phase
As part of its schematic designs, Compass decided that its basic architectural scheme would be a shell that would contain a 10,000-square-foot (ft2) column-free, raised-floor hall and all the traditional support spaces. Compass made this decision based on the collective experience of its internal and consultant teams, as well as market analysis.
Compass decided that the systems, called Modular Power Centers (MPCs), would be packaged and delivered as standardized systems. This work was provided by Modular Power Solutions. The MPCs could be installed either internally or externally to the data center’s brick-and-mortar shell structure. Crosby and the MPC executives have filed for patent protection of the intellectual property.
Compass chose not to employ a central mechanical plant, but rather to deploy an N+1 redundant rooftop mechanical system to support the facility’s HVAC requirements. So, the schematic design established the following parameters:
Data Hall:
Support Spaces:
Modular Power Centers:
The basis-of-design (BOD) goals are then used for the next step in the design process, the creation of a single-line diagram. The development of the schematic design (SD) phase single-line diagram brings together the conceptual components and requirements of the BOD (see Figure 1).
Figure 1. Schematic design single-line diagram
The initial single-line is the tool that Compass used to determine the structure and components required for the electrical distribution system. The MPCs must be sized to be able to support the demands of the 1.2-MW data hall, the mechanical systems and the support spaces. The single-line diagram is also used to validate the Tier III redundancy and concurrent maintainability requirements. The redundancy of critical components and systems and the requirement for de-energized maintenance must be worked through at this stage of the design process.
The major electrical distribution system components were identified as:
The Compass one-line based on the Tier III requirements provided a look at the electrical system’s redundancy (see Figure 2).
Figure 2. Electrical system redundancy
Then Compass added two isolation or tie breakers to the main switchboard in order to meet the Tier III concurrently maintainable requirement. These breakers were required to allow either side of the switchboard to be shut down and completely de-energized for service. The tie breakers can also be used to enhance fault tolerance. If they are forced to trip before the main circuit breakers on either side, the non-faulted side of the system can remain operational.
The decision was made to look to the local utility provider to supply an N redundant 2500-kVA utility power transformer. The 2500-kVA/2000-kW standby generator in the base system is N redundant. A second N+1 or 2N redundant generator added to the lineup meets the Tier III redundancy requirements. The second generator will be connected to the opposite side of the switchboard lineup. Compass preferred generator redundancy over utility redundancy, finding generators to be more reliable than the utility, based upon its experience that blackouts tend to regional in nature (as seen with hurricane Sandy).
The remaining equipment would be installed in a Power Center module. That equipment was identified as:
Based on the equipment defined in the single-line, Compass determined that at least two MPCs would be required.
The tie breakers provide a natural point to split the system. This split became the basis of how the system is packaged. And the size of the modules and weight of the MPCs is constrained by the need to ship them over highways from the assembly facility to the job site. Typically, those shipping packages are not to exceed 50 feet by 12 feet and 100,000 pounds.
Each MPC switchboard lineup features a 3000-A and a 1600-A UL 891-listed switchboard. Each switchboard is equipped with two 3000-A, four 400-A, and four 450-A UL 489-listed circuit breakers. All circuit breakers larger than 200-A are 100% duty rated. All circuit breakers feature zone selective interlocks (ZSIs). A ZSI ties the circuit breaker trip units together, allowing them to communicate in order to ensure that the circuit breaker closest to the fault trips first. Increasing the fault isolation capabilities increases the data center’s ability to maintain operational continuity.
The main switchboards are configured as main-tie-main-tie-main. Each CPC has a dedicated programmable logic controller (PLC). The PLCs are hot swappable, meaning that if either processor goes down, the other processor will automatically take control. The I/O rack is located in the A CPC. There is no power bussing in the I/O section. The switchgear can be manually operated if the I/O rack is de-energized for maintenance.
Modbus Protocol is provided to the Schneider Electric StruXureWare management system at the PLC gateway for each main switchboard. The main switchgear has integrated revenue-grade power-quality metering.
Each side of the redundant power system features a 1.2-MW Schneider Electric APC Symmetra Megawatt UPS (see Figure 3). Each UPS has a dedicated external 1600-A continuous-duty-rated static bypass switch. Power to the two UPS systems is delivered from two separate (A/B) switchboards. Each switchboard is able to support the entire data center. The two tie breakers operate in the normally closed position.
Figure 3. UPS efficiency
Figure 4. (Above) Modular Power Center – top view (patent pending)
Figure 5. (Below) Modular Power Center – plan view (patent pending)
Power for the data hall will be derived from two identical MPC modules, each of which is factory-assembled prior to on-site delivery. The first layouts were completed for the MPCs with the addition of the following components:
Figure 6. Modular Power
Center – interior
The MPCs (see Figures 4-8) are IBC-rated R17 structures, which meet Miami-Dade County 149-mph wind-pressure loading requirements. The MPCs are constructed to provide protection with respect to harmful effects on the equipment due to the ingress of water (rain, sleet, snow), and will be undamaged by the external formation of ice on the enclosure or seismic events.
Compass employs 2.0-MW/2.5-MVA, 277/480-V, 3ø, four-wire generator rated at 1825 kW to provide standby power (see Figure 9 and 10).
Compass determined that the data center infrastructure will require support from a 2.0-MW/2.5-MVA generator. The sequence of operation of the total system is controlled automatically through deployment of redundant PLC control units installed in each of the 3000-A main switchboards. Should the primary standby generator fail to come online after loss of the utility source, the swing generator will pick up the critical loads of the system. Each generator will be provided with a weather-protective enclosure. All generator permits (including all operations, fuel storage, noise and air) will be obtained and maintained with the appropriate AHJ. Generators are equipped with 4,000-gallon fuel storage belly tanks for 24 hours of fuel capacity at full load.
Figure 7. Modular Power Center – interior
Figure 8. Modular Power Center – exterior
Figure 9. Standby generator
The output of each UPS module is a 1600-A distribution board equipped with a maintenance bypass. A solenoid key release unit (SKRU) is provided to ensure that the UPS has transferred to bypass before the MBP breaker can be engaged to the output switchboard. This will always be a closed transition transfer so that critical load power will never be lost.
Critical power to the IT load will be provided by eight 300-kVA PDUs installed in an alternating A/B arrangement in the data hall to provide 208/120-V power to either overhead busway or remote power panels. Each PDU has a 300-kVA K-13 rated transformer and six 225-A breakers. Additionally, each PDU has six integrated revenue-grade power-monitoring meters.
Compass determined that the mechanical requirements for each data hall can be supported by four 120-ton rooftop units (RTUs). The four RTUs provide N+1 system redundancy. Power for each RTU will be available from either the A or B System through dedicated automatic transfer switches (see Figure 11). The units feature integrated controls allowing for efficient airside economization across all units. A proprietary rapid-restart feature ensures full air movement within 30 seconds after restoration of power. The system controls deliver uniform under-floor pressures.
Figure 10. Generator exterior
This single-line diagram (see Figure 12) represents the next step in the construction document’s development process: the design development (DD)-phase documents. The updated single-line features significant developments in the design process. The new features are:
The division of the electrical distribution system into two completely separate MPCs
The new single-line diagram now reflects the separate MPCs. The MPCs in this arrangement actually complement each other, providing 2N redundancy to the data hall.
A second generator was added to provide 2N generator redundancy. In the future, this second generator could be shared with additional data halls on the same campus. The redundancy of the generators would then be N+1.
Each MPC was outfitted with provisions to provide power for the entire mechanical system. Normally, power for one-half of the mechanical equipment is supplied by each MPC. Dedicated ATSs will automatically roll power to any active MPC if power were lost.
Figure 11. Power for each RTU is available from dedicated automatic transfer switches.
The new single-line shows how both the input and output switchboards have been integrated into a single switchgear lineup. The new lineup provided for a simplified interconnection scheme when it was installed in the MPC.
The use of dual MPC facilitates the use of dual PLCs. The ability of the PLCs to stay in synchronous operation allows for a seamless transfer of control between either unit.
High levels of arc-flash energy in the main switchboards became a concern when the decision was made to have the utility provide the main 2500-kVA transformer and the transformer’s primary-side protection. Most utilities design their protection schemes to protect the utility’s own equipment. This typically doesn’t translate into limiting the arc-flash energy levels on the secondary side of these large transformers. Remoting the main utility breaker outside the MPC allows the arc-flash energy to be contained outside the remote switchboard. The arc-flash energy inside the MPC is now be significantly reduced.
Figure 12. Design-Development (DD) single-line diagram (patent pending)
The deployment of the MPCs is just part of the modular concept that was developed for Compass Data Centers. Compass has done further development of the concept. This work and Tier III compliance with the Uptime Institute are important elements of its business plan to control costs and provide alignment of data center facilities with customers’ business requirements.
Since joining Rosendin Electric, Mr. Emert has provided the engineering foundation for the company’s design-build mission-critical construction business. Today Rosendin Electric is the largest design-build electrical contractor for mission-critical facilities in the U.S. Mr. Emert is an active member of the IEEE P1584 IEEE Guidelines for Performing Arc-Flash Hazard Calculations Working Group. He is a member of the IEEE P1584 Configuration Task Group, currently engaged in the process of defining a new set of standards for the next issue of the P1584 Guideline publication. Mr. Emert has coauthored IEEE EMC Society presentations and written articles on electrical power systems for Electrical Contractor Magazine.