
Outage data shows cloud apps must be designed for failure
One of the most significant differences between cloud and traditional (i.e., non-cloud) software is how resiliency is built into the applications. When architecting a cloud application, the onus is on software developers to architect resiliency in their application architecture. Conversely, in a more traditional application, data center teams, infrastructure engineers and software developers work together to meet resiliency requirements.
In traditional architecture, applications run on a single server that contains an operating system. If the server fails, the application becomes unavailable. Resiliency features are often integrated into the server and data center to prevent outages.
In contrast, cloud-native applications are designed to function across multiple servers or services within a composable architecture. Application developers create software that can continue operating even if a resource or data center becomes unavailable. Cloud providers openly acknowledge that their services and data centers are not infallible. They emphasize that developers need to determine their acceptable failure tolerance and structure their applications accordingly.
Today, developers have little visibility into how their architectural decisions affect application performance. This report uses historical outage data to quantify the advantage of designing greater application resiliency using composable architectures.
Architecting for resiliency
Regions and availability zones (AZs) are key components in cloud-native architectures:
- An availability zone is a data center (or multiple data centers). Each zone is often understood to have redundant and separate power and networking.
- A region is a geographical location containing multiple AZs. Each region is physically isolated from and independent of every other region in terms of utility, power, local network and other resources.
Uptime refers to the amount of time an application is accessible to customers. Availability is this amount expressed as a percentage of the total period. Conversely, downtime is when the application is inaccessible. By architecting resiliency across regions and AZs, developers aim to maximize both uptime and availability.
Cloud provider service level agreements (SLAs) guarantee a minimum level of service by offering some assurances regarding uptime. If a service’s availability drops below this threshold, the customer is entitled to a partial or full refund.
The Uptime Intelligence report Build resilient apps: do not rely solely on cloud infrastructure describes several simple cloud application architectures and explains how each design affects availability. Table 1 shows a summary of these architectures.
Table 1 Summary of application architecture characteristics
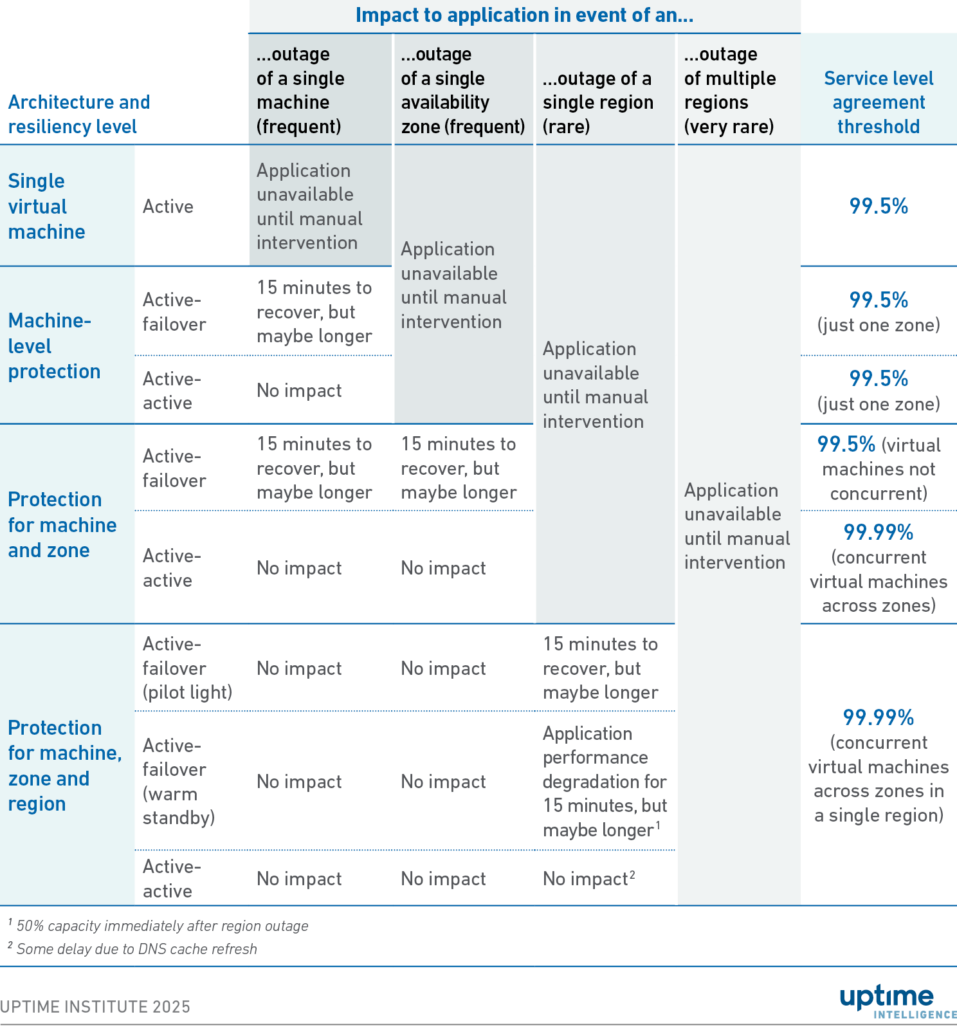
Table 1 also shows the SLA threshold at which a refund is due. The SLA serves as a marketing tool, demonstrating the cloud provider’s confidence in its ability to maintain infrastructure by offering a monetary guarantee to customers.
However, this figure does not fully reflect availability. Providers set thresholds to balance the risk of an SLA claim with the potential for increased revenue from perceived reliability. In practice, it is unclear how the choice of architecture affects an application’s availability.
Status updates indicate issues
Cloud service providers publish real-time updates on their services’ performance and availability. These inform customers of technical issues, preventing an influx of client support calls while problems are being resolved.
Uptime Intelligence obtained status updates from AWS, Google Cloud and Microsoft Azure for 2024 to measure historical availability. This research aims to determine whether incidents reported in these historical updates would have affected applications architected using virtual machines deployed in:
- The same AZ (single-zone).
- Different AZs in the same region (dual-zone).
- Different AZs in different regions (dual-region).
Each status update in the outage data was analyzed to determine whether the three application architectures would likely become unavailable due to that outage. Average annual availabilities were calculated by collating all outages in 2024 and measuring their impact on each architecture. Both control plane issues (affecting the management of resources) and data plane issues (affecting the operation of services) were regarded as having an impact on the application’s availability.
This analysis relies on cloud providers reporting their issues correctly — and they have a strong incentive to do so because their support systems would be overwhelmed by user queries if they failed to report an issue.
Many historical updates indicated that these issues affected only a subset of users. For consistency, this report assumes that if such warnings could have affected an application’s availability then they should be counted as an outage. As such, the figures represented here reflect the worst-case scenarios, where even minor issues could meaningfully affect application availability. Since this report covers assessments of infrastructure availability, the figures exclude issues related to operating systems or application code, which remain the customer’s responsibility rather than the cloud provider’s.
Respectable availability
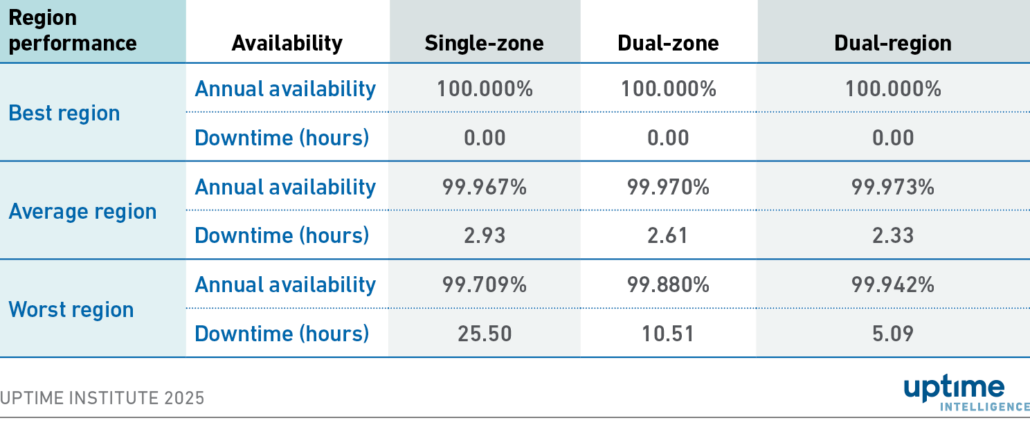
Table 2 shows the average application availability achieved over the entire year for all AWS, Google Cloud and Microsoft Azure AZs and regions, based on selected architectures: single-zone, dual-zone and dual-region.
Table 2 Average availability by architecture
As various status notifications provide different levels of detail, it would be unfair to give comparisons between cloud providers on a non-equivalent basis. As a result, provider-specific breakouts are not included in this report.
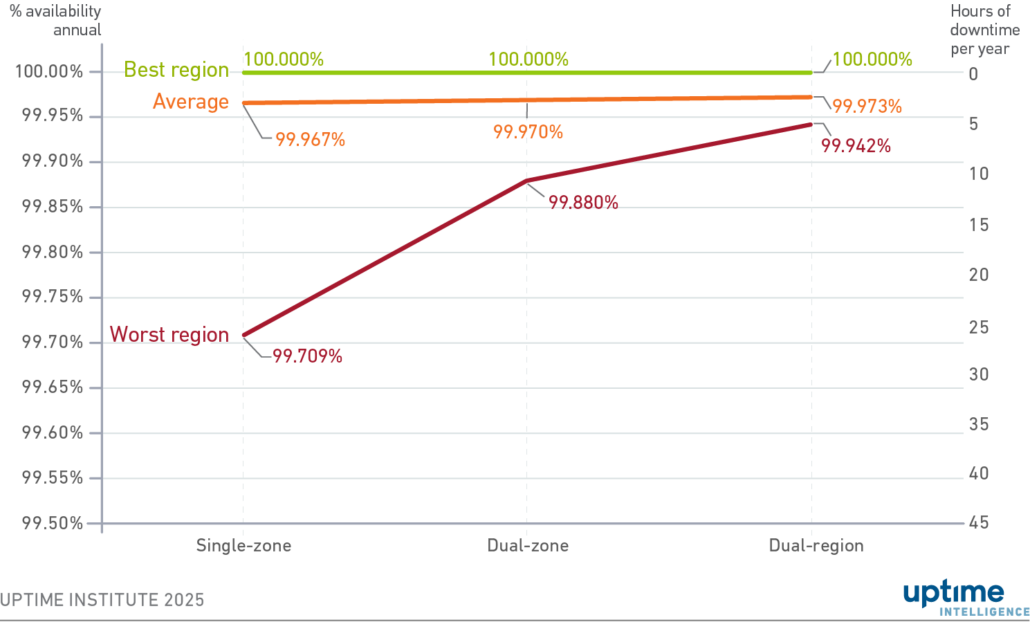
Instead of breaking out providers, Figure 1 shows the availability of the best and worst performing regions, alongside the average, for the different architectures. The difference between average and worst region availabilities shows how most regions had high levels of uptime in 2024, but some regions had serious incidents.
Figure 1 Regional availabilities for application architectures
In 2024, 31 incidents were likely to impact application architectures, and no cloud provider was immune from issues. Major outages that affected cloud providers include:
- February 14: A regional metadata store issue in Google’s us-west1 region disrupted multiple Google Cloud products, including load balancing.
- July 30: Microsoft Azure users worldwide experienced intermittent connection errors, timeouts, and latency spikes for 5 hours. The root cause was traced to a misconfiguration following the mitigation of a Distributed Denial-of-Service (DDoS) attack, which led to network congestion and packet loss. The incident’s global reach and long duration materially impacted the average availability calculation.
- September 25: An issue with a subsystem that handles requests for authentication and authorization caused errors and increased latency across multiple service APIs in AWS’s us-west-2 Oregon region.
The highly publicized CrowdStrike incident in July 2024, which caused widespread system crashes on Windows computers worldwide, is not included here because it did not directly affect cloud infrastructure. However, it did have an impact on customers using Windows in the cloud.
Resiliency pays off
Figure 1 shows that, in most cases, a resilient application architected across multiple AZs and regions experiences only slightly less downtime than an application architected in a single-zone. On average, an application architected across AZs experiences 19 minutes less downtime than a single-zone architecture. This rises to 36 minutes when the application is architected across regions.
In some AZs and regions, architecting resiliency into applications had no impact on availability. Of the 116 cloud provider regions examined in this study, 29 experienced no issues, according to status updates.
However, averages can be misleading. Enterprises that experience no downtime due to the fortunate placement of their applications might believe that designing for resiliency is not worthwhile. But for those whose applications were in one of the affected AZs or regions in 2024, the value of resiliency is clear.
The worst-performing zone had an annual availability of 99.71%, resulting in a significant 25 hours of downtime in 2024 for applications running solely in that zone. However, if the application had been architected to run across multiple zones, this would have dropped to 10 hours. And if it was designed to run across multiple regions, the downtime would have been reduced to 5 hours — one-fifth of a single-zone architecture.
The challenge for enterprises is that there is no way to predict which zones and regions may suffer an outage. If an enterprise has chosen a region without incidents, then the cost of configuring resiliency may seem unnecessary. However, if the enterprise chose the worst-performing region, the impact would have been substantial. Unfortunately, resiliency comes at a cost. More resources working across more locations have a financial and environmental impact. This report has not examined the cost differences between these architectures. However, future reports will compare the availability of these architectures with their cost and carbon footprint.
The Uptime Intelligence View
Cloud providers are delivering respectable levels of availability. However, some regions had better availability than others in 2024. As such, organizations should architect resiliency into all their applications across AZs and regions. Dual-zone and dual-region architectures demonstrate a significant availability gain over single-zone designs.
 UI @ 2021


 2020
2020


