Municipal requirements imposed difficult space considerations for Italian insurance company’s Tier IV data center
By Andrea Ambrosi and Roberto Del Nero
Space planning is often the key to a successful data center project. Organizing a facility into functional blocks is a fundamental way to limit interference between systems, reduce any problem related to power distribution, and simplify project development. However, identifying functional blocks and optimizing space within an existing building can be extremely complex. Converting an office building into a data center can cause further complexity.
This was the challenge facing Maestrale, a consortium of four engineering companies active in the building field including Ariatta Ingegneria dei Sistemi Srl as the mechanical and electrical engineer, when a major Italian insurance company, UnipolSai Assicurazioni S.p.a (UnipolSai), asked it to design a data center in an office building that had been built at the end of the 1980s in Bologna, Italy. UnipolSai set ambitious performance goals by requiring the electrical and mechanical infrastructure to be Uptime Institute Tier IV Certification of Constructed Facility and very energy efficient.
In addition, the completed facility, designed and built to meet UnipolSai’s requirements, has the following attributes:
• 1,200 kilowatts (kW) maximum overall IT equipment load
• UPS capacity: not less than 10 minutes
• Four equipment rooms having a total area of 1,400 square meters (m2)
• Cold Aisle/Hot Aisle floor layouts : In an energy-conscious project, all innovative free-cooling technologies must be considered.
After a thorough investigation of these free-cooling technologies, Ariatta chose direct free cooling for the UnipolSai project.
MUNICIPAL RESTRICTIONS
The goal of the architectural and structural design of a data center is to accommodate, contain, and protect the mechanical, electrical, and IT equipment. The size, location, and configuration of the mechanical and electrical infrastructure will determine the architecture of the rest of the building. In a pre-existing building, however, this approach does not always apply. More often, builders must work around limitations such as fixed perimeter length and floor height, floors not capable of bearing the weight of expected IT equipment, lack of adjoining external spaces, and other restrictions imposed by municipal regulations. In this project, a series of restrictions and duties imposed by the Municipality of Bologna had a direct impact on technical choices, in particular:
• Any part or any piece of equipment more than 1.8-meters high on the outside yard or on any external surface of the building (e.g., the roof) would be considered added volume, and therefore not allowed.
• Any modification or remodelling activity that changed the shape of the building was to be considered as incompatible with municipal regulations.
• The location was part of a residential area with strict noise limits (noise levels at property lines of 50 decibels [dbA] during the day and 40 dbA at night).
New structural work would also be subject to seismic laws, now in force throughout the country. In addition, UnipolSai’s commitment to Uptime Institute Tier IV Certification required it to also find solutions to achieve Continuous Cooling to IT equipment and to Compartmentalize ancillary systems. The final design incorporates a diesel rotary UPS (DRUPS) in a 2N distribution scheme, a radial double-feed electrical system, and an N+1 mechanical system with dual-water distribution backbone (Line 1 and Line 2) that enable the UnipolSai facility to meet Uptime Institute Tier IV requirements. Refrigerated water chillers with magnetic levitation bearings and air exchangers inserted in an N+1 hydraulic scheme serve the mechanical systems. The chillers are provided with double electric service entrance controlled by an automatic transfer switch (ATS). The DRUPS combine UPS and diesel engine-generator functions and do not require battery systems, which are normally part of static UPS systems. Uptime Institute Tier IV requires Compartmentalization, which necessitates more space. Eliminating the batteries saved a great deal of space. In addition, using the DRUPS to feed the chillers ensured that the facility would meet Tier IV requirements for Continuous Cooling with no need for storage tanks, which would be difficult to place in this site. The DRUPS also completely eliminated cooling requirements in the UPS room because the design ambient temperature would be around 30°C (maximum 40°C). Finally, using the DRUPS greatly simplified the distribution structure, limiting the ATSs on primary electric systems to a very minimum.
Municipal restrictions meant that the best option for locating the DRUPS and chillers would require radically transforming some areas inside building. For example, Ariatta uncovered an office floor and adapted structures and waterproofing to install the chiller plant (see Figures 1 and 2).
Figures 1 and 2. Bird’s eye and ground level views of the chiller plant.
Positioning the DRUPS posed another challenge. In another municipality, its dimensions (12-m length by 4.5-m height), weight, and maintenance requirements would have guided the design team towards a simple solution, such as installing them in containers directly on the floor. However, municipal restrictions for this location (1.8-m limit above street level) required an alternative solution. As a result, geological, geotechnical, and hydrogeological studies of the site of the underground garage showed that:
• Soil conditions met the technical and structural requirements of the DRUPS installation.
• The stratum was lower than the foundations.
• Flood indexes are fixed 30 centimeters above street level (taking zero level as reference).
The garage area was therefore opened and completely modified to contain a watertight tank containing the DRUPs. The tank included a 1.2-m high parapet to prevent flooding. The tank was equipped with redundant water lifting systems fed by the DRUPS (see Figures 3 and 4).
Figures 3 and 4. Particular care was given to protect the DRUPS against water intrusions. Soundproofing was also necessary.
Meeting the city’s acoustic requirements required soundproofing the DRUPS machines, so the DRUPS systems were double shielded reducing noise levels to 40 decibels (dbA) at 10 m during normal operation when connected to mains power. Low-noise chillers and high-performance acoustic barriers helped the entire facility meets its acoustical goals.
After identifying technical rooms and allocating space for equipment rooms, Ariatta had to design systems that met UnipolSai’s IT and mechanical and electrical requirements, IT distribution needs, and Uptime Institute Tier IV Compartmentalization requirements.
The floors of the existing building did not always align, especially on lower stories. These changes in elevation were hard to read in plans and sections. To meet this challenge, Starching S.R.L. Studio Architettura & Ingegneria and Redesco Progetti Srl, both part of the Maestrale Consortium, developed a three-dimensional Revit model, which included information about the mechanical and electrical systems. The Revit model helped identify problems caused by the misalignment of the floors and conflict between systems in the design phase. It also helped communicate new information about the project to contractors during the construction phase (see Figure 5 and 6).
Figures 5 and 6. Revit models helped highlight changes in building elevations that were hard to discern in other media and also aided in communication with contractors.
The use of 3D models is becoming a common way to eliminate interference between systems in final design solutions, with positive effects on the execution of work in general and only a moderate increase in engineering costs.
Figure 7. Fire-rated pipe enclosure
At UnipolSai, Compartmentalizing ancillary systems represented one of the main problems to be resolved to obtain Uptime Institute Tier IV Certification because of restrictions caused by the existing building. Ariatta engaged in continuous dialogue with the Uptime Institute to identify technical solutions. This dialogue, along with studies and functional demonstrations carried out jointly with sector specialists, led to a shared solution where two complementary systems that form the technological backbone are compartmentalized, with respect to one another (see Figure 7). The enclosures, which basically run parallel to each other, have:
• An external fire-resistant layer (60 minutes, same as the building structure)
• An insulation layer to keep the temperature of the technological systems within design limits for 60 minutes
• A channel that contains and protects against leaks absorbs shocks
• Dedicated independent mounting brackets. This solution was needed where the architectural characteristics of the building affected the technological backbone (see Figure 8).
Figure 8. The layout of the building limited the potential paths for pipe runs.
ENERGY EFFICIENCY
The choice of direct free cooling was made following an environmental study intended to determine and analyse the time periods when outdoor thermo-hygrometric conditions are favorable to the indoor IT microclimate of the UnipolSai data center as well as the relevant technical, economic, and energy impact of free cooling on the facility. The next-generation IT equipment used at UnipolSai allows it to modify the environmental parameters used as reference.
Figure 9. UnipolSai sized equipment to meet the requirements of ASHRAE’s “Thermal Guidelines for Data Processing Environments, 3rd edition,” as illustrated by that publication’s Figure 2.
The air conditioning systems in the data center were sized to guarantee temperatures between 24–26°C (75-79°F) per Class A1 equipment rooms as per ASHRAE “Thermal Guidelines for Data Processing Environments, 3rd edition”, in accordance with ASHRAE psychrometric chart (see Figure 9). The studies carried out showed that, in the Bologna region specifically, the outdoor thermo-hygrometric conditions are favorable to the IT microclimate of the data center about 70% of the time with energy savings of approximately 2,000 megawatt-hours. Direct free cooling brought undeniable advantages in terms of energy efficiency but introduced a significant functional complication issue related to Tiers compliance. The Tier Standards do not reference direct free cooling or other economization systems as the Tier requirements apply regardless of the technology. Eventually, it was decided that the free cooling system had to be subordinated to IT equipment continuous operation and excluded every time there was a problem with the mechanical and electrical systems, in which case continued operations would be ensured by the chiller plant.
Eventually, it was decided that the free cooling system had to be subordinated to IT equipment continuous operation and excluded every time there was a problem with the mechanical and electrical systems, in which case Continous Cooling would be ensured by the chiller plant. The direct free cooling functional setting, with unchanneled hot air rejection that was dictated by the pre-existing architectural restrictions, dictated the room layout and drove the choice of Cold Aisle containment. The direct free-cooling system consists of N+1 CRACs placed along the perimeter of the room, blowing cool air into a 60-inch plenum created by the access floor. The same units manage the free-cooling system. Every machine is equipped with a dual feed electric entrance controlled by an ATS and connected to a dual water circuit through a series of automatic valves (see Figure 10).
Figure 10. CRACs are connected with a dual-feed electric entrance controlled by an ATS and connected to a dual water circuit.
Containing the Cold Aisles caused a behavioral response among the IT operators, who normally work in a cold environment. At UnipolSai’s data center, they feel hot air heat when entering the data center. Design return air temperatures in the circulation areas are 32–34°C (90-93°F), and design supply air temperatures are 24–26°C (75-79°F). It became necessary to start an informational campaign to prevent alarmism in connection with room temperatures in the areas outside the functional aisles (See Figures 11-13).
Figures 11-13. Pictures show underfloor piping, containers, and raised floor environment.
Prefabricated electric busbars placed on the floor at regular intervals provide power supply to the IT racks. This decision was made in collaboration with UnipolSai technicians who considered it the most flexible solution in terms of installation and power draw, both initially and to accommodate future changes (see Figure 14 and 15).
Figure 14. Electric busbar
Figure 15. Taps on the busbar allow great flexibility on the data center floor and feed servers on the white space floor below.
In addition, a labeling system involving univocal synthetic description (alphanumeric code) and color coding, which allows a quick visual identification any part of any system makes simplifies the process of testing, operating, and managing all building systems (see Figure 16 and 17).
Figure 16-17. UnipolSai benefits from a well-thought out labeling system, which simplifies many aspects of operations.
FINAL TESTING
Functional tests were carried out at nominal load with the support of electric heaters, distributed in a regular manner within the equipment rooms and connected to the infrastructure feeding the IT equipment (see Figure 18-19). Also, Uptime Institute observed technical and functional tests were as part of Tier IV Certification of Constructed Facility (TCCF). The results of all the tests were positive; final demonstrations are pending. The data center has received Uptime Institute Tier IV Certification of Design Documents and is in progress for Tier IV Certification of Constructed Facility.
Figure 18-19. Two views of the data center floor, including heaters, during final testing.
To fully respond to the energy saving and absorption control policy of UnipolSai, the site was equipped with a network of heat/cooling energy meters and electrical meters connected to the central supervision system. Each chiller, and pumping and air handling system was specifically metered on electrical side, with chillers metered on the thermal side. Each electric system feeding IT loads is also metered.
UnipolSai also adopted DCIM software that, if properly used, can represent the first step towards an effective organization of the maintenance process, essential for keeping a system efficient and operational, independently from its level of redundancy and sophistication.
Andrea Ambrosi
Andrea Ambrosi, is project manager, design team manager and site manager at Ariatta Ingegneria dei Sistemi Srl (Ariatta). He is responsible for the executive planning and management of operations of electrical power, control and supervision systems, safety, and security and fire detection systems to be installed in data centers. He has specific experience in Domotics and special systems for the high-tech residential sector. He has been an Accredited Tier Designer since 2013 and Accredited Tier Specialist since 2014.
Roberto Del Nero, is a project manager and design team manager at
Roberto Del Nero
Ariatta, where he is responsible for the executive planning and management of mechanical plants, control and supervision systems, fire systems, plumbing and drainage to be installed in data center. He has been LEED AP (Accredited Professional) since 2009, Accredited Tier Designer since 2013 and Accredited Tier Specialist since 2014.
https://journal.uptimeinstitute.com/wp-content/uploads/2015/10/Unipol.jpg4751201Kevin Heslinhttps://journal.uptimeinstitute.com/wp-content/uploads/2022/12/uptime-institute-logo-r_240x88_v2023-with-space.pngKevin Heslin2015-10-28 13:08:132015-10-28 13:08:13Unipol Takes Space Planning to a New Level
Conventional wisdom blames “human error” for the majority of outages, but those failures are incorrectly attributed to front-line operator errors, rather than management mistakes
By Julian Kudritzki, with Anne Corning
Data centers, oil rigs, ships, power plants, and airplanes may seem like vastly different entities, but all are large and complex systems that can be subject to failures—sometimes catastrophic failure. Natural events like earthquakes or storms may initiate a complex system failure. But often blame is assigned to “human error”—front-line operator mistakes, which combine with a lack of appropriate procedures and resources or compromised structures that result from poor management decisions.
“Human error” is an insufficient and misleading term. The front-line operator’s presence at the site of the incident ascribes responsibility to the operator for failure to rescue the situation. But this masks the underlying causes of an incident. It is more helpful to consider the site of the incident as a spectacle of mismanagement.
Responsibility for an incident, in most cases, can be attributed to a senior management decision (e.g., design compromises, budget cuts, staff reductions, vendor selecting and resourcing) seemingly disconnected in time and space from the site of the incident. What decisions led to a situation where front line operators were unprepared or untrained to respond to an incident and mishandled it?
To safeguard against failures, standards and practices have evolved in many industries that encompass strict criteria and requirements for the design and operation of systems, often including inspection regimens and certifications. Compiled, codified, and enforced by agencies and entities in each industry, these programs and requirements help protect the service user from the bodily injuries or financial effects of failures and spur industries to maintain preparedness and best practices.
Twenty years of Uptime Institute research into the causes of data center incidents places predominant accountability for failures at the management level and finds only single-digit percentages of spontaneous equipment failure.
This fundamental and permanent truth compelled the Uptime Institute to step further into standards and certifications that were unique to the data center and IT industry. Uptime Institute undertook a collaborative approach with a variety of stakeholders to develop outcome-based criteria that would be lasting and developed by and for the industry. Uptime Institute¹s Certifications were conceived to evaluate, in an unbiased fashion, front-line operations within the context of management structure and organizational behaviors.
EXAMINING FAILURES
The sinking of the Titanic. The Deepwater Horizon oil spill. DC-10 air crashes in the 1970s. The failure of New Orleans’ levee system. The Three Mile Island nuclear release. The northeast (U.S.) blackout of 2003. Battery fires in Boeing 787s. The space shuttle Challenger disaster. Fukushima Daiichi nuclear disaster. The grounding of the Kulluk arctic drilling rig. These are a few of the most infamous, and in some cases tragic, engineering system failures in history. While the examples come from vastly different industries and each story unfolded in its own unique way, they all have something in common with each other—and with data centers. All exemplify highly complex systems operating in technologically sophisticated industries.
The hallmarks of so-called complex systems are “a large number of interacting components, emergent properties difficult to anticipate from the knowledge of single components, adaptability to absorb random disruptions, and highly vulnerable to widespread failure under adverse conditions (Dueñas-Osorio and Vemuru 2009).” Additionally, the components of complex systems typically interact in non-linear fashion, operating in large interconnected networks.
Large systems and the industries that use them have many safeguards against failure and multiple layers of protection and backup. Thus, when they fail it is due to much more than a single element or mistake.
It is a truism that complex systems tend to fail in complex ways. Looking at just a few examples from various industries, again and again we see that it was not a single factor but the compound effect of multiple factors that disrupted these sophisticated systems. Often referred to as “cascading failures,” complex system breakdowns usually begin when one component or element of the system fails, requiring nearby “nodes” (or other components in the system network) to take up the workload or service obligation of the failed component. If this increased load is too great, it can cause other nodes to overload and fail as well, creating a waterfall effect as every component failure increases the load on the other, already stressed components. The following transferable concept is drawn from the power industry:
Power transmission systems are heterogeneous networks of large numbers of components that interact in diverse ways. When component operating limits are exceeded, protection acts to disconnect the component and the component ”fails” in the sense of not being available… Components can also fail in the sense of misoperation or damage due to aging, fire, weather, poor maintenance, or incorrect design or operating settings…. The effects of the component failure can be local or can involve components far away, so that the loading of many other components throughout the network is increased… the flows all over the network change (Dobson, et al. 2009).
A component of the network can be mechanical, structural or human agent, as front-line operators respond to an emerging crisis. Just as engineering components can fail when overloaded, so can human effectiveness and decision-making capacity diminish under duress. A defining characteristic of a high risk organization is that it provides structure and guidance despite extenuating circumstances—duress is its standard operating condition.
The sinking of the Titanic is perhaps the most well-known complex system failure in history. This disaster was caused by the compound effect of structural issues, management decisions, and operating mistakes that led to the tragic loss of 1,495 lives. Just a few of the critical contributing factors include design compromises (e.g., reducing the height of the watertight bulkheads that allowed water to flow over the tops and limiting the number of lifeboats for aesthetic considerations), poor discretionary decisions (e.g., sailing at excessive speed on a moonless night despite reports of icebergs ahead), operator error (e.g., the lookout in the crow’s nest had no binoculars—a cabinet key had been left behind in Southampton), and misjudgment in the crisis response (e.g., the pilot tried to reverse thrust when the iceberg was spotted, instead of continuing at full speed and using the momentum of the ship to turn course and reduce impact). And, of course, there was the hubris of believing the ship was unsinkable.
Figure 1a. (Left) NTSB photo of the burned auxiliary power unit battery from a JAL Boeing 787 that caught fire on January 7, 2013 at Boston¹s Logan International Airport. Photo credit: By National Transportation Safety Board (NTSB) [Public domain], via Wikimedia Commons. Figure 1b. (Right) A side-by-side comparison of an original Boeing Dreamliner (787) battery compared and a damaged Japan Air Lines battery. Photo credit: By National Transportation Safety Board (NTSB) [Public domain], via Wikimedia Commons.
Looking at a more recent example, the issue of battery fires in Japan Airlines (JAL) Boeing 787s, which came to light in 2013 (see Figure 1), was ultimately blamed on a combination of design, engineering, and process management shortfalls (Gallagher 2014). Following its investigation, the U.S. National Transportation Safety Board reported (NTSB 2014):
• Manufacturer errors in design and quality control. The manufacturer failed to adequately account for the thermal runaway phenomenon: an initial overheating of the batteries triggered a chemical reaction that generated more heat, thus causing the batteries to explode or catch fire. Battery “manufacturing defects and lack of oversight in the cell manufacturing process” resulted in the development of lithium mineral deposits in the batteries. Called lithium dendrites, these deposits can cause a short circuit that reacts chemically with the battery cell, creating heat. Lithium dendrites occurred in wrinkles that were found in some of the battery electrolyte material, a manufacturing quality control issue.
• Shortfall in certification processes. The NTSB found shortcomings in U.S. Federal Aviation Administration (FAA) guidance and certification processes. Some important factors were overlooked that should have been considered during safety assessment of the batteries.
• Lack of contractor oversight and proper change orders. A cadre of contractors and subcontractors were involved in the manufacture of the 787’s electrical systems and battery components. Certain entities made changes to the specifications and instructions without proper approval or oversight. When the FAA performed an audit, it found that Boeing’s prime contractor wasn’t following battery component assembly and installation instructions and was mislabeling parts. A lack of “adherence to written procedures and communications” was cited.
How many of these circumstances parallel those that can happen during the construction and operation of a data center? It is all too common to find deviations from as-designed systems during the construction process, inconsistent quality control oversight, and the use of multiple subcontractors. Insourced and outsourced resources may disregard or hurry past written procedures, documentation, and communication protocols (search Avoiding Data Center Construction Problems @ journal.uptimeinstitute.com).
THE NATURE OF COMPLEX SYSTEM FAILURES
Large industrial and engineered systems are risky by their very nature. The greater the number of components and the higher the energy and heat levels, velocity, and size and weight of these components the greater the skill and teamwork required to plan, manage, and operate the systems safely. Between mechanical components and human actions, there are thousands of possible points where an error can occur and potentially trigger a chain of failures.
In his seminal article on the topic of complex system failure How Complex Systems Fail, first published in 1998 and still widely referenced today, Dr. Richard I. Cook identifies and discusses 18 core elements of failure in complex systems:
1. Complex systems are intrinsically hazardous systems.
2. Complex systems are heavily and successfully defended against failure.
3. Catastrophe requires multiple failures—single point failures are not enough.
4. Complex systems contain changing mixtures of failures latent within them.
5. Complex systems run in degraded mode.
6. Catastrophe is always just around the corner.
7. Post-accident attribution to a root cause is fundamentally wrong.
8. Hindsight biases post-accident assessments of human performance.
9. Human operators have dual roles: as producers and as defenders against failure.
10. All practitioner actions are gambles.
11. Actions at the sharp end resolve all ambiguity.
12. Human practitioners are the adaptable element of complex systems.
13. Human expertise in complex systems is constantly changing.
14. Change introduces new forms of failure.
15. Views of cause limit the effectiveness of defenses against future events.
16. Safety is a characteristic of systems and not of their components.
17. People continuously create safety.
18. Failure-free operations require experience with failure (Cook 1998).
Let’s examine some of these principles in the context of a data center. Certainly high-voltage electrical systems, large-scale mechanical and infrastructure components, high-pressure water piping, power generators, and other elements create hazards [Element 1] for both humans and mechanical systems/structures. Data center systems are defended from failure by a broad range of measures [Element 2], both technical (e.g., redundancy, alarms, and safety features of equipment) and human (e.g., knowledge, training, and procedures). Because of these multiple layers of protection, a catastrophic failure would require the breakdown of multiple systems or multiple individual points of failure [Element 3].
RUNNING NEAR CRITICAL FAILURE Complex systems science suggests that most large-scale complex systems, even well-run ones, by their very nature are operating in “degraded mode” [Element 5], i.e., close to the critical failure point. This is due to the progression over time of various factors including steadily increasing load demand, engineering forces, and economic factors.
The enormous investments in data center and other highly available infrastructure systems perversely incents conditions of elevated risk and higher likelihood of failure. Maximizing capacity, increasing density, and hastening production from installed infrastructure improves the return on investment (ROI) on these major capital investments. Deferred maintenance, whether due to lack of budget or hands-off periods due to heightened production, further pushes equipment towards performance limits—the breaking point.
The increasing density of data center infrastructure exemplifies the dynamics that continually and inexorably push a system towards critical failure. Server density is driven by a mixture of engineering forces (advancements in server design and efficiency) and economic pressures (demand for more processing capacity without increasing facility footprint). Increased density then necessitates corresponding increases in the number of critical heating and cooling elements. Now the system is running at higher risk, with more components (each of which is subject to individual fault/failure), more power flowing through the facility, more heat generated, etc.
This development trajectory demonstrates just a few of the powerful “self-organizing” forces in any complex system. According to Dobson, et al (2009), “these forces drive the system to a dynamic equilibrium that keeps [it] near a certain pattern of operating margins relative to the load. Note that engineering improvements and load growth are driven by strong, underlying economic and societal forces that are not easily modified.”
Because of this dynamic mix of forces, the potential for a catastrophic outcome is inherent in the very nature of complex systems [Element 6]. For large-scale mission critical and business critical systems, the profound implication is that designers, system planners, and operators must acknowledge the potential for failure and build in safeguards.
WHY IS IT SO EASY TO BLAME HUMAN ERROR?
Human error is often cited as the root cause of many engineering system failures, yet it does not often cause a major disaster on its own. Based on analysis of 20 years of data center incidents, Uptime Institute holds that human error must signify management failure to drive change and improvement. Leadership decisions and priorities that result in a lack of adequate staffing and training, an organizational culture that becomes dominated by a fire drill mentality, or budget cutting that reduces preventive/proactive maintenance could result in cascading failures that truly flow from the top down.
Although front-line operator error may sometimes appear to cause an incident, a single mistake (just like a single data center component failure) is not often sufficient to bring down a large and robust complex system unless conditions are such that the system is already teetering on the edge of critical failure and has multiple underlying risk factors. For example, media reports after the 1983 Exxon Valdez oil spill zeroed in on the fact that the captain, Joseph Hazelwood, was not at the bridge at the time of the accident and accused him of drinking heavily that night. However, more measured assessments of the accident by the NTSB and others found that Exxon had consistently failed to supervise the captain or provide sufficient crew for necessary rest breaks (see Figure 2).
Figure 2. Shortly after leaving the Port of Valdez, the Exxon Valdez ran aground on Bligh Reef. The picture was taken three days after the vessel grounded, just before a storm arrived. Photo credit: Office of Response and Restoration, National Ocean Service, National Oceanic and Atmospheric Administration [Public domain], via Wikimedia Commons.
Perhaps even more critical was the lack of essential navigation systems: the tanker’s radar was not operational at time of the accident. Reports indicate that Exxon’s management had allowed the RAYCAS radar system to stay broken for an entire year before the vessel ran aground because it was expensive to operate. There was also inadequate disaster preparedness and an insufficient quantity of oil spill containment equipment in the region, despite the experiences of previous small oil spills. Four years before the accident, a letter written by Captain James Woodle, who at that time was the Exxon oil group¹s Valdez port commander, warned upper management, “Due to a reduction in manning, age of equipment, limited training and lack of personnel, serious doubt exists that [we] would be able to contain and clean-up effectively a medium or large size oil spill” (Palast 1999).
As Dr. Cook points out, post-accident attribution to a root cause is fundamentally wrong [Element 7]. Complete failure requires multiple faults, thus attribution of blame to a single isolated element is myopic and, arguably, scapegoating. Exxon blamed Captain Hazelwood for the accident, and his share of the blame obscures the underlying mismanagement that led to the failure. Inadequate enforcement by the U.S. Coast Guard and other regulatory agencies further contributed to the disaster.
Similarly, the grounding of the oil rig Kulluk was the direct result of a cascade of discrete failures, errors, and mishaps, but the disaster was first set in motion by Royal Dutch Shell’s executive decision to move the rig off of the Alaskan coastline to avoid tax liability, despite high risks (Lavelle 2014). As a result, the rig and its tow vessels undertook a challenging 1,700-nautical-mile journey across the icy and storm-tossed waters of the Gulf of Alaska in December 2012 (Funk 2014).
There had already been a chain of engineering and inspection compromises and shortfalls surrounding the Kulluk, including the installation of used and uncertified tow shackles, a rushed refurbishment of the tow vessel Discovery, and electrical system issues with the other tow vessel, the Aivik, which had not been reported to the Coast Guard as required. (Discovery experienced an exhaust system explosion and other mechanical issues in the following months. Ultimately the tow company—a contractor—was charged with a felony for multiple violations.)
This journey would be the Kulluk’s last, and it included a series of additional mistakes and mishaps. Gale-force winds put continual stress on the tow line and winches. The tow ship was captained on this trip by an inexperienced replacement, who seemingly mistook tow line tensile alarms (set to go off when tension exceeded 300 tons) for another alarm that was known to be falsely annunciating. At one point the Aivik, in attempting to circle back and attach a new tow line, was swamped by a wave, sending water into the fuel pumps (a problem that had previously been identified but not addressed), which caused the engines to begin to fail over the next several hours (see Figure 3).
Waves crash over the mobile offshore drilling unit Kulluk where it sits aground on the southeast side of Sitkalidak Island, Alaska, Jan. 1, 2013. A Unified Command, consisting of the Coast Guard, federal, state, local and tribal partners and industry representatives was established in response to the grounding. U.S. Coast Guard photo by Petty Officer 3rd Class Jonathan Klingenberg.
Despite harrowing conditions, Coast Guard helicopters were eventually able to rescue the 18 crew members aboard the Kulluk. Valiant last-ditch tow attempts were made by the (repaired) Aivik and Coast Guard tugboat Alert, before the effort had to be abandoned and the oil rig was pushed aground by winds and currents.
Poor management decision making, lack of adherence to proper procedures and safety requirements, taking shortcuts in the repair of critical mechanical equipment, insufficient contractor oversight, lack of personnel training/experience all of these elements of complex system failure are readily seen as contributing factors in the Kulluk disaster.
EXAMINING DATA CENTER SYSTEM FAILURES
Two recent incidents demonstrate how the dynamics of complex systems failures can quickly play out in the data center environment.
Example A
Tier III Concurrent Maintenance data center criteria (see Uptime Institute Tier Standard: Topology) require multiple, diverse independent distribution paths serving all critical equipment to allow maintenance activity without impacting critical load. The data center in this example had been designed appropriately with fuel pumps and engine- generator controls powered from multiple circuit panels. As built, however, a single panel powered both, whether due to implementation oversight or cost reduction measures. At issue is not the installer, but rather the quality of communications from the implementation team and the operations team.
In the course of operations, technicians had to shut off utility power during the performance of routine maintenance to an electrical switchgear. This meant the building was running on engine-generator sets. However, when the engine-generator sets started to surge due to a clogged fuel line. The UPS automatically switched the facility to battery power. The day tanks for the engine-generator sets were starting to run dry. If quick-thinking operators had not discovered the fuel pump issue in time, there would have been an outage to the entire facility: a cascade of events leading down a rapid pathway from simple routine maintenance activity to complete system failure.
Example B
Tier IV Fault Tolerant data center criteria require the ability to detect and isolate a fault while maintaining capacity to handle critical load. In this example, a Tier IV enterprise data center shared space with corporate offices in the same building, with a single chilled water plant used to cool both sides of the building. The office air handling units also brought in outside air to reduce cooling costs.
One night, the site experienced particularly cold temperatures and the control system did not switch from outside air to chilled water for office building cooling, which affected data center cooling as well. The freeze stat (a temperature sensing device that monitors a heat exchanger to prevent its coils from freezing) failed to trip; thus the temperature continued to drop and the cooling coil froze and burst, leaking chilled water onto the floor of the data center. There was a limited leak detection system in place and connected, but it had not been fully tested yet. Chilled water continued to leak until pressure dropped and then the chilled water machines started to spin offline in response. Once the chilled water machines went offline neither the office building nor data center had active cooling.
At this point, despite the extreme outside cold, temperatures in the data hall rose through the night. As a result of the elevated indoor temperature conditions, the facility experienced myriad device-level (e.g., servers, disc drives, and fans) failures over the following several weeks. Though a critical shut down was not the issue, damage to components and systems—and the cost of cleanup and replacement parts and labor—were significant. One single initiating factor—a cold night—combined with other elements in a cascade of failures.
In both of these cases, severe disaster was averted, but relying on front-line operators to save the situation is neither robust not reliable.
PREVENTING FAILURES IN THE DATA CENTER
Organizations that adhere to the principles of Concurrent Maintainability and/or Fault Tolerance, as outlined in Tier Standard: Topology, take a vital first step toward reducing the risk of a data center failure or outage.
However, facility infrastructure is only one component of failure prevention; how a facility is run and operated on a day-to-day basis is equally critical. As Dr. Cook noted, humans have a dual role in complex systems as both the potential producers (causes) of failure as well as, simultaneously, some of the best defenders against failure [Element 9].
The fingerprints of human error can be seen on the two data center examples. In Example A, the electrical panel was not set up as originally designed, and the leak detection system, which could have alerted operators to the problem, had not been fully activated in Example B.
Dr. Cook also points out that human operators are the most adaptable component of complex systems [Element 12], as they “actively adapt the system to maximize production and minimize accidents.” For example, operators may “restructure the system to reduce exposure of vulnerable parts,” reorganize critical resources to focus on areas of high demand, provide “pathways for retreat or recovery,” and “establish means for early detection of changed system performance in order to allow graceful cutbacks in production or other means of increasing resiliency.” Given the highly dynamic nature of complex system environments, this human-driven adaptability is key.
STANDARDIZATION CAN ADDRESS MANAGEMENT SHORTFALLS
In most of the notable failures in recent decades, there was a breakdown or circumvention of established standards and certifications. It was not a lack of standards, but a lack of compliance or sloppiness that contributed the most to the disastrous outcomes. For example, in the case of the Boeing batteries, the causes were bad design, poor quality inspections, and lack of contractor oversight. In the case of the Exxon Valdez, inoperable navigation systems and inadequate crew manpower and oversight—along with insufficient disaster preparednesswere critical factors. If leadership, operators, and oversight agencies had adhered to their own policies and requirements and had not cut corners for economics or expediency, these disasters might have been avoided.
Ongoing operating and management practices and adherence to recognized standards and requirements, therefore, must be the focus of long-term risk mitigation. In fact, Dr. Cook states that “failure-free operations are the result of activities of people who work to keep the system within the boundaries of tolerable performance….human practitioner adaptations to changing conditions actually create safety from moment to moment” [Element 17]. This emphasis on human activities as decisive in preventing failures dovetails with Uptime Institute’s advocacy of operational excellence as set forth in the Tier Standard: Operational Sustainability. This was the data center industry¹s first standardization, developed by and for data centers, to address the management shortfalls that could unwind the most advanced, complex, and intelligent of solutions. Uptime Institute was compelled by its findings that the vast majority of data center incidents could be attributed to operations, despite advancements in technology, monitoring, and automation.
The Operational Sustainability criteria pinpoint the elements that impact long-term data center performance, encompassing site management and operating behaviors, and documentation and mitigation of site-specific risks. The detailed criteria include personnel qualifications and training and policies and procedures that support operating teams in effectively preventing failures and responding appropriately when small failures occur to avoid having them cascade into large critical failures. As Dr. Cook states, “Failure free operations require experience with failure” [Element 18]. We have the opportunity to learn from the experience of other industries, and, more importantly, from the data center industry¹s own experience, as collected and analyzed in Uptime Institute’s Abnormal Incident Reports database. Uptime Institute has captured and catalogued the lessons learned from more than 5,000 errors and incidents over the last 20 years and used that research knowledgebase to help develop an authoritative set of benchmarks. It has ratified these with leading industry experts and gained the consensus of global stakeholders from each sector of the industry. Uptime Institute’s Tier Certifications and Management & Operations (M&O) Stamp of Approval provide the most definitive guidelines for and verification of effective risk mitigation and operations management.
Dr. Cook explains, “More robust system performance is likely to arise in systems where operators can discern the edge of the envelope. It also depends on calibrating how their actions move system performance towards or away from the edge of the envelope. [Element 18]” Uptime Institute¹s deep subject matter expertise, long experience, and evidence-based standards can help data center operators identify and stay on the right side of that edge. Organizations like CenturyLink are recognizing the value of applying a consistent set of standards to ensure operational excellence and minimize the risk of failure in the complex systems represented by their data center portfolio (See the sidebar CenturyLink and the M&O Stamp of Approval).
CONCLUSION
Complex systems fail in complex ways, a reality exacerbated by the business need to operate complex systems on the very edge of failure. The highly dynamic environments of building and operating an airplane, ship, or oil rig share many traits with running a high availability data center. The risk tolerance for a data center is similarly very low, and data centers are susceptible to the heroics and missteps of many disciplines. The coalescing element is management, which makes sure that frontline operators are equipped with the hands, tools, parts, and processes they need, and, the unbiased oversight and certifications to identify risks and drive continuous improvement against the continuous exposure to complex failure.
REFERENCES
ASME (American Society of Mechanical Engineers). 2011. Initiative to Address Complex Systems Failure: Prevention and Mitigation of Consequences. Report prepared by Nexight Group for ASME (June). Silver Spring MD: Nexight Group. http://nexightgroup.com/wp-content/uploads/2013/02/initiative-to-address-complex-systems-failure.pdf
Bassett, Vicki. (1998). “Causes and effects of the rapid sinking of the Titanic,” working paper. Department of Mechanical Engineering, the University of Wisconsin. http://writing.engr.vt.edu/uer/bassett.html#authorinfo.
BBC News. 2015. “Safety worries lead US airline to ban battery shipments.” March 3, 2015. http://www.bbc.com/news/technology-31709198
Brown, Christopher and Matthew Mescal. 2014. View From the Field. Webinar presented by Uptime Institute, May 29, 2014. https://uptimeinstitute.com/research-publications/asset/webinar-recording-view-from-the-field
Cook, Richard I. 1998. “How Complex Systems Fail (Being a Short Treatise on the Nature of Failure; How Failure is Evaluated; How Failure is Attributed to Proximate Cause; and the Resulting New Understanding of Patient Safety).” Chicago, IL: Cognitive Technologies Laboratory, University of Chicago. Copyright 1998, 1999, 2000 by R.I. Cook, MD, for CtL. Revision D (00.04.21), http://web.mit.edu/2.75/resources/rando/How%20Complex%20Systems%20Fail.pdf
Dobson, Ian, Benjamin A. Carreras, Vickie E. Lynch and David E. Newman. 2009. “Complex systems analysis of a series of blackouts: Cascading failure, critical points, and self-organization.” Chaos: An Interdisciplinary Journal of Nonlinear Science 17: 026103 (published by the American Institute of Physics).
Dobson, Ian, Benjamin A. Carreras, Vickie E. Lynch and David E. Newman. 2009. “Complex systems analysis of a series of blackouts: Cascading failure, critical points, and self-organization.” Chaos: An Interdisciplinary Journal of Nonlinear Science 17: 026103 (published by the American Institute of Physics).
Dueñas-Osorio, Leonard and Srivishnu Mohan Vemuru. 2009. Abstract for “Cascading failures in complex infrastructure systems.” Structural Safety 31 (2): 157-167.
Funk, McKenzie. 2014. “The Wreck of the Kulluk.” New York Times Magazine December 30, 2014. http://www.nytimes.com/2015/01/04/magazine/the-wreck-of-the-kulluk.html?_r=0
Gallagher, Sean. 2014. “NTSB blames bad battery designand bad managementin Boeing 787 fires.” Ars Technica, December 2, 2014. http://arstechnica.com/information-technology/2014/12/ntsb-blames-bad-battery-design-and-bad-management-in-boeing-787-fires/
Glass, Robert, Walt Beyeler, Kevin Stamber, Laura Glass, Randall LaViolette, Stephen Contrad, Nancy Brodsky, Theresa Brown, Andy Scholand, and Mark Ehlen. 2005. Simulation and Analysis of Cascading Failure in Critical Infrastructure. Presentation (annotated version) Los Alamos National Laboratory, National Infrastructure Simulation and Analysis Center (Department of Homeland Security), and Sandia National Laboratories, July 2005..New Mexico: Sandia National Laboratories. http://www.sandia.gov/CasosEngineering/docs/Glass_annotatedpresentation.pdf
Kirby, R. Lee. 2012. “Reliability Centered Maintenance: A New Approach.” Mission Critical, June 12, 2012. http://www.missioncriticalmagazine.com/articles/84992-reliability-centered-maintenance–a-new-approach
Klesner, Keith. 2015. “Avoiding Data Center Construction Problems.” The The Uptime Institute Journal. 5: Spring 2014: 6-12. https://journal.uptimeinstitute.com/avoiding-data-center-construction-problems/
Lipsitz, Lewis A. 2012. “Understanding Health Care as a Complex System: The Foundation for Unintended Consequences.” Journal of the American Medical Association 308 (3): 243244. http://jama.jamanetwork.com/article.aspx?articleid=1217248
Lavelle, Marianne. 2014. “Coast Guard blames Shell risk taking in the wreck of the Kulluk.” National Geographic, April 4, 2014. http://news.nationalgeographic.com/news/energy/2014/04/140404-coast-guard-blames-shell-in-kulluk-rig-accident/
“Exxon Valdez Oil Spill.” New York Times. On NYTimes.com, last updated August 3, 2010. http://topics.nytimes.com/top/reference/timestopics/subjects/e/exxon_valdez_oil_spill_1989/index.html
NTSB (National Transportation Safety Board). 2014. “Auxiliary Power Unit Battery Fire Japan Airlines Boeing 787-8, JA829J.” Aircraft Incident Report released 11/21/14. Washington, DC: National Transportation Safety Board. http://www.ntsb.gov/Pages/..%5Cinvestigations%5CAccidentReports%5CPages%5CAIR1401.aspx
Palast, Greg. 1999. “Ten Years After But Who Was to Blame?” for Observer/Guardian UK, March 20, 1999. http://www.gregpalast.com/ten-years-after-but-who-was-to-blame/
Pederson, Brian. 2014. “Complex systems and critical missionstoday’s data center.” Lehigh Valley Business, November 14, 2014. http://www.lvb.com/article/20141114/CANUDIGIT/141119895/complex-systems-and-critical-missions–todays-data-center
Plsek, Paul. 2003. Complexity and the Adoption of Innovation in Healthcare. Presentation, Accelerating Quality Improvement in Health Care Strategies to Speed the Diffusion of Evidence-Based Innovations, conference in Washington, DC, January 27-28, 2003. Roswell, GA: Paul E Plsek & Associates, Inc. http://www.nihcm.org/pdf/Plsek.pdf
Reason, J. 2000. “Human Errors Models and Management.” British Medical Journal 320 (7237): 768770. http://www.ncbi.nlm.nih.gov/pmc/articles/PMC1117770/
Reuters. 2014. “Design flaws led to lithium-ion battery fires in Boeing 787: U.S. NTSB.” December 2, 2014. http://www.reuters.com/article/2014/12/02/us-boeing-787-batteryidUSKCN0JF35G20141202
Wikipedia, s.v. “Cascading Failure,” last modified April 12, 2015. https://en.wikipedia.org/wiki/Cascading_failure
Wikipedia, s.v. “The Sinking of The Titanic,” last modified July 21, 2015. https://en.wikipedia.org/wiki/Sinking_of_the_RMS_Titanic
Wikipedia, s.v. “SOLAS Convention,” last modified June 21, 2015. https://en.wikipedia.org/wiki/SOLAS_Convention
John Maclean, author of numerous books, including Fire on the Mountain (Morrow 1999), analyzing deadly wildland fires, suggests rebranding of high reliability organizations, which is a fundamental concept of firefighting crews, military, and commercial airline industry. He argued for high risk organizations. A high reliability organization may only fail, like a goalkeeper, as performance is so highly anticipated. A high risk organization is tasked with averting or minimizing impact and may gauge success in a non-binary fashion. It is a recurring theme in Mr. Maclean’s forensic analyses of deadly fires that front-line operators, including the perished, carry the blame for the outcome and management shortfalls are far less exposed.
CENTURYLINK AND THE M&O STAMP OF APPROVAL
The IT industry has growing awareness of the importance of management-people-process issues. That’s why Uptime Institute¹s Management & Operations (M&0) Stamp of Approval focuses on assessing and evaluating both operations activities and management as equally critical to ensuring data center reliability and performance. The M&O Stamp can be applied to a single data center facility, or administered across an entire portfolio to ensure consistency.
Recognizing the necessity of making a commitment to excellence at all levels of an organization, CenturyLink is the first service provider to embrace the M&O assesment for all of its data centers. It has contracted Uptime Institute to assess 57 data center facilities across a global portfolio. This decision shows the company is willing to hold itself to a uniform set of high standards and operate with transparency. The company has committed to achieve M&O Stamp of Approval standards and certification across the board, protecting its vital networks and assets from failure and downtime and providing its customers with assurance.
Julian Kudritzki
Julian Kudritzki joined Uptime Institute in 2004 and currently serves as Chief Operating Officer. He is responsible for the global proliferation of Uptime Institute standards. He has supported the founding of Uptime Institute offices in numerous regions, including Brasil, Russia, and North Asia. He has collaborated on the development of numerous Uptime Institute publications, education programs, and unique initiatives such as Server Roundup and FORCSS. He is based in Seattle, WA.
Anne Corning
Anne Corning is a technical and business writer with more than 20 years experience in the high tech, healthcare, and engineering fields. She earned her B.A. from the University of Chicago and her M.B.A. from the University of Washington’s Foster School of Business. She has provided marketing, research, and writing for organizations such as Microsoft, Skanska USA Mission Critical, McKesson, Jetstream Software, Hitachi Consulting, Seattle Children’s Hospital Center for Clinical Research, Adaptive Energy, Thinking Machines Corporation (now part of Oracle), BlueCross BlueShield of Massachusetts, and the University of Washington Institute for Translational Health Sciences. She has been a part of several successful entrepreneurial ventures and is a Six Sigma Green Belt.
—-
https://journal.uptimeinstitute.com/wp-content/uploads/2015/10/systemsfailures.jpg4751201Kevin Heslinhttps://journal.uptimeinstitute.com/wp-content/uploads/2022/12/uptime-institute-logo-r_240x88_v2023-with-space.pngKevin Heslin2015-10-09 13:37:472016-08-23 08:53:49Examining and Learning from Complex Systems Failures
Allocating IT costs to internal customers improves accountability, cuts waste
By Scott Killian
You’ve heard the complaints many times before: IT costs too much. I have no idea what I’m paying for. I can’t accurately budget for IT costs. I can do better getting IT services myself.
The problem is that end-user departments and organizations can sometimes see IT operations as just a black box. In recent years, IT chargeback systems have attracted more interest as a way to address all those concerns and rising energy use and costs. In fact, IT chargeback can be a cornerstone of practical, enterprise-wide efficiency efforts.
IT chargeback is a method of charging internal consumers (e.g., departments, functional units) for the IT services they used. Instead of bundling all IT costs under the IT department, a chargeback program allocates the various costs of delivering IT (e.g., services, hardware, software, maintenance) to the business units that consume them.
Many organizations already use some form of IT chargeback, but many don’t, instead treating IT as corporate overhead. Resistance to IT chargeback often comes from the perception that it requires too much effort. It’s true that time, administrative cost, and organizational maturity is needed to implement chargeback.
However, the increased adoption of private and public cloud computing is causing organizations to re-evaluate and reconsider IT chargeback methods. Cloud computing has led some enterprises to ask their IT organizations to explain their internal costs. Cloud options can shave a substantial amount from IT budgets, which pressures IT organizations to improve cost modeling to either fend off or justify a cloud transition. In some cases, IT is now viewed as more of a commodity—with market competition. In these circumstances, accountability and efficiency improvements can bring significant cost savings that make chargeback a more attractive path.
CHARGEBACK vs. UNATTRIBUTED ACCOUNTING
All costs are centralized in traditional IT accounting. One central department pays for all IT equipment and activities, typically out of the CTO or CIO’s budget, and these costs are treated as corporate overhead shared evenly by multiple departments. In an IT chargeback accounting model, individual cost centers are charged for their IT service based on use and activity. As a result, all IT costs are “zeroed out” because they have all been assigned to user groups. IT is no longer considered overhead, instead it can be viewed as part of each department’s business and operating expenses (OpEx).
With the adoption of IT chargeback, an organization can expect to see significant shifts in awareness, culture, and accountability, including:
• Increased transparency due to accurate allocation of IT costs and usage. Chargeback allows consumers to see their costs and understand how those costs are determined.
• Improved IT financial management, as groups become more aware of the cost of their IT usage and business choices. With chargeback, consumers become more interested and invested in the costs of delivering IT as a service.
• Increased awareness of how IT contributes to the business of the organization. IT is not just overhead but is seen as providing real business value.
• Responsibility for controlling IT costs shifts to business units, which become accountable for their own use.
• Alignment of IT operations and expenditures with the business. IT is no longer just an island of overhead costs but becomes integrated into business planning, strategy, and operations.
The benefits of an IT chargeback model included simplified IT investment decision making, reduced resource consumption, improved relationships between business units and IT, and greater perception of IT value. Holding departments accountable leads them to modify their behaviors and improve efficiency. For example, chargeback tends to reduce overall resource consumption as business units stop hoarding surplus servers or other resources to avoid the cost of maintaining these underutilized assets. At the same time, organizations experience increased internal customer satisfaction as IT and the business units become more closely aligned and begin working together to analyze and improve efficiency.
Perhaps most importantly, IT chargeback drives cost control. As users become aware of the direct costs of their activities, they become more willing to improve their utilization, optimize their software and activities, and analyze cost data to make better spending decisions. This can extend the life of existing resources and infrastructure, defer resource upgrades, and identify underutilized resources that can be deployed more efficiently. Just as we have seen in organizations that adopt a server decommissioning program (such as the successful initiatives of Uptime Institute’s Server Roundup) (https://uptimeinstitute.com/training-events/server-roundup), IT chargeback identifies underutilized assets that can be reassigned or decommissioned. As a result, more space and power becomes available to other equipment and services, thus extending the life of existing infrastructure. An organization doesn’t have to build new infrastructure if it can get more from current equipment and systems.
IT chargeback also allows organizations to make fully informed decisions about outsourcing. Chargeback provides useful metrics that can be compared against cloud providers and other outsource IT options. As IT organizations are being driven to emulate cloud provider services, a chargeback applies free-market principles to IT (with appropriate governance and controls). The IT group becomes more akin to a service provider, tracking and reporting the same metrics on a more apples-to-apples basis.
Showback is closely related to chargeback and offers many of the same advantages without some of the drawbacks. This strategy employs the same approach as chargeback, with tracking and cost-center allocation of IT expenses. Showback measures and displays the IT cost breakdown by consumer unit just as chargeback does, but without actually transferring costs back. Costs remain in the IT group, but information is still transparent about consumer utilization. Showback can be easy to implement since there is no immediate budgetary impact on user groups.
The premise behind showback and chargeback is the same: awareness drives accountability. However, since business units know they will not be charged in a showback system, their attention to efficiency and improving utilization may not be as focused. Many organizations have found that starting with a showback approach for an initial 3-6 months is an effective way to introduce chargeback, testing the methodology and metrics and allowing consumer groups to get used to the approach before full implementation of chargeback accountability.
The stakeholders affected by chargeback/showback include:
• Consumers: Business units that consume IT resources, e.g., organizational entities, departments, applications, and end users.
• Internal service providers: Groups responsible for providing IT services, e.g., data center teams, network teams, and storage.
• Project sponsor: The group funding the effort and ultimately responsible for its success. Often this is someone under the CTO or can also be a finance/accounting leader.
• Executive team: The C-suite individuals responsible for setting chargeback as an organizational priority and ensuring enterprise-wide participation to bring it to fruition.
• Administrator: The group responsible for operating the chargeback program (e.g., IT finance and accounting).
CHARGEBACK METHODS
A range of approaches have been developed for implementing chargeback in an organization, as summarized in Figure 1. The degree of complexity, degree of difficulty, and cost to implement decreases from the top of the chart [service-based pricing (SBP)], to the bottom [high-level allocation (HLA)]. HLA is the simplest method; it uses a straight division of IT costs based on a generic metric such as headcount. Slightly more effort to implement is low-level allocation (LLA), which bases consumer costs on something more related to IT activity such as the number of users or servers. Direct cost (DC) more closely resembles a time and materials charge but is often tied to headcount as well.
Figure 1. Methods for chargeback allocation.
Measured resource usage (MRU) focuses on the amount of actual resource usage of each department, using metrics such as power (in kilowatts), network bandwidth and terabytes of storage. Tiered flat rate (TFR), negotiated flat rate (NFR), and service based pricing (SBP) are all increasingly sophisticated applications of measuring actual usage by service.
THE CHARGEBACK SWEET SPOT
Measured resource usage (MRU) is often the sweet spot for chargeback implementation. It makes use of readily available data that are likely already known or collected. For example, data center teams typically measure power consumption at the server level, and storage groups know how many terabytes are being used by different users/departments. MRU is a straight allocation of IT costs, thus it is fairly intuitive for consumer organizations to accept. It is not quite as simple as other methods to implement but does provide fairness and is easily controllable.
MRU treats IT services as a utility, consumed and reserved based on key activities:
• Data center = power
• Network = bandwidth
• Storage = bytes
• Cloud =virtual machines or other metric
• Network Operations Center = ticket count or total time to resolve per customer
PREPARING FOR CHARGEBACK IMPLEMENTATION
If an organization is to successfully implement chargeback, it must choose the method that best fits its objectives and apply the method with rigor and consistency. Executive buy-in is critical. Without top-down leadership, chargeback initiatives often fail to take hold. It is human nature to resist accountability and extra effort, so leadership is needed to ensure that chargeback becomes an integral part of the business operations.
To start, it’s important that an organization know the infrastructure capital expense (CapEx) and OpEx costs. Measuring, tracking, reporting, and questioning these costs, and acting on the information to base investment and operating decisions on real costs is critical to becoming an efficient IT organization. To understand CapEx costs, organizations should consider the following:
• Facility construction or acquisition
• Power and cooling infrastructure equipment: new, replacement, or upgrades
• IT hardware: server, network, and storage hardware
• Software licenses, including operating system and application software
• Racks, cables: initial costs (i.e., items installed in the initial set up of the data room)
OpEx incorporates all the ongoing costs of running an IT facility. They are ultimately larger than CapEx in the long run, and include:
• FTE/payroll
• Utility expenses
• Critical facility maintenance (e.g., critical power and cooling, fire and life safety, fuel systems)
• Housekeeping and grounds (e.g., cleaning, landscaping, snow removal)
• Disposal/recycling
• Lease expenses
• Hardware maintenance
• Other facility fees such as insurance, legal, and accounting fees
• General building maintenance (e.g., office area, roof, plumbing)
• Network expenses (in some circumstances)
The first three items (FTE/payroll, utilities, and critical facility maintenance) typically make up the largest portion of these costs. For example, utilities can account for a significant portion of the IT budget. If IT is operated in a colocation environment, the biggest costs could be lease expenses. The charges from a colocation provider typically will include all the other costs, often negotiated. For enterprise-owned data centers, all these OpEx categories can fluctuate monthly depending on activities, seasonality, maintenance schedules, etc. Organizations can still budget and plan for OpEx effectively, but it takes an awareness of fluctuations and expense patterns.
At a fundamental level, the goal is to identify resource consumption by consumer, for example the actual kilowatts per department. More sophisticated resource metrics might include the cost of hardware installation (moves, adds, changes) or the cost per maintenance ticket. For example, in the healthcare industry, applications for managing patient medical data are typically large and energy intensive. If 50% of a facility’s servers are used for managing patient medical data, the company could determine the kilowatt per server and multiply total OpEx by the percentage of total IT critical power used for this activity as a way to allocate costs. If 50% of its servers are only using 30% of the total IT critical load, then it could use 30% to determine the allocation of data center operating costs. The closer the data can get to representing actual IT usage, the better.
An organization that can compile this type of data for about 95% of its IT costs will usually find it sufficient for implementing a very effective chargeback program. It isn’t necessary for every dollar to be accounted for. Expense allocations will be closely proportional based on actual consumption of kilowatts and/or bandwidth consumed and reserved by each user organization. Excess resources typically are absorbed proportionally by all. Even IT staff costs can be allocated by tracking and charging their activity to different customers using timesheets or by headcount where staff is dedicated to specific customers.
Another step in preparing an organization to adopt an IT chargeback methodology is defining service levels. What’s key is setting expectations appropriately so that end users, just like customers, know what they are getting for what they are paying. Defining uptime (e.g., Tier level such as Tier III Concurrent Maintainability or Tier IV Fault Tolerant infrastructure or other uptime and/or downtime requirements, if any), and outlining a detailed service catalog are important.
IT CHARGEBACK DRIVES EFFICIENT IT
Adopting an IT chargeback model may sound daunting, and doing so does take some organizational commitment and resources, but the results are worthwhile. Organizations that have implemented IT chargeback have experienced reductions in resource consumption due to increased customer accountability, and higher, more efficient utilization of hardware, space, power, and cooling due to reduction in servers. IT chargeback brings a new, enterprise-wide focus on lowering data center infrastructure costs with diverse teams working together from the same transparent data to achieve common goals, now possible because everyone has “skin in the game.”
Essentially, achieving efficient IT outcomes demands a “follow the money” mindset. IT chargeback drives a holistic approach in which optimizing data center and IT resource consumption becomes the norm. A chargeback model also helps to propel organizational maturity, as it drives the need for more automation and integrated monitoring, for example the use of a DCIM system. To collect data and track resources and key performance indicators manually is too tedious and time consuming, so stakeholders have an incentive to improve automated tracking, which ultimately improves overall business performance and effectiveness.
IT chargeback is more than just an accounting methodology; it helps drive the process of optimizing business operations and efficiency, improving competitiveness and adding real value to support the enterprise mission.
IT CHARGEBACK DOs AND DON’Ts
19 May 2015, Uptime Institute gathered a group of senior stakeholders for the Executive Assembly for Efficient IT. The group was composed of leaders from large financial, healthcare, retail and Web-scale IT organizations and the purpose of the meeting was to share experiences, success stories and challenges to improving IT efficiency.
At Uptime Institute’s 2015 Symposium, executives from leading data center organizations that have implemented IT chargeback discussed the positive results they had achieved. They also shared the following recommendations for companies considering adopting an IT chargeback methodology.
DO:
• Partner with the Finance department. Finance has to completely buy in to implementing chargeback.
• Inventory assets and determine who is using them. A complete inventory of the number of data centers, number of servers, etc., is needed to develop a clear picture of what is being used.
• Chargeback needs strong senior-level support; it will not succeed as a bottom-up initiative. Similarly don’t try to implement it from the field. Insist that C-suite representatives (COO/CFO) visit the data center so the C-suite understands the concept and requirements.
• Focus on cash management as the goal, not finance issues (e.g., depreciation) or IT equipment (e.g., server models and UPS equipment specifications). Know the audience, and get everyone on the same page talking about straight dollars and cents.
• Don’t give teams too much budget—ratchet it down. Make departments have to make trade-offs so they begin to make smarter decisions.
• Build a dedicated team to develop the chargeback model. Then show people the steps and help them understand the decision process.
• Data is critical: show all the data, including data from the configuration management data base (CMDB), in monthly discussions.
• Be transparent to show and add credibility. For example, explain clearly, “Here’s where we are and here’s where we are trying to get to.”
• Above all, communicate. People will need time to get used to the idea.
DON’TS:
• Don’t try to drive chargeback from the bottom up.
• Simpler is better: don’t overcomplicate the model. Simplify the rules and prioritize; don’t get hung up perfecting every detail because it doesn’t save much money. Approximations can be sufficient.
• Don’t move too quickly: start with showback. Test it out first; then, move to chargeback.
• To get a real return, get rid of the old hardware. Move quickly to remove old hardware when new items are purchased. The efficiency gains are worth it.
• The most challenging roadblocks can turn out to be the business units themselves. Organizational changes might need to go the second level within the business unit if it has functions and layers under them that should be separate.
Scott Killian
Scott Killian joined the Uptime Institute in 2014 and currently serves as VP for Efficient IT Program. He surveys the industry for current practices and develops new products to facilitate industry adoption of best practices. Mr. Killian directly delivers consulting at the site management, reporting, and governance levels. He is based in Virginia.
Prior to joining Uptime Institute, Mr. Killian led AOL’s holistic resource consumption initiative, which resulted in AOL winning two Uptime Institute Server Roundups for decommissioning more than 18,000 servers and reducing operating expenses more than US$6 million. In addition, AOL received three awards in the Green Enterprise IT (GEIT) program. AOL accomplished all this in the context of a five-year plan developed by Mr. Killian to optimize data center resources, which saved US$17 million annually.
NEXTDC deploys new isolated parallel diesel rotary uninterruptible power supply systems and other innovative technologies
By Jeffrey Van Zetten
NEXTDC’s colocation data centers in Australia incorporate innovation in engineering design, equipment selection, commissioning, testing, and operation. This quality-first philosophy saw NEXTDC become one of 15 organizations globally to win a 2015 Brill Award for Efficient IT. NEXTDC’s B1 Brisbane, M1 Melbourne, S1 Sydney, C1 Canberra, and P1 Perth data centers (see Figure 1-3), have a combined 40-megawatt (MW) IT load (see Figure 4).
Figure 1. Exterior of NEXTDC’s 11.5-MW S1 Sydney data center, which is Uptime Institute Tier III Design Documents and Constructed Facility Certified
Figure 2. Exterior of NEXTDC’s 5.5-MW P1 Perth data center, which is Uptime Institute Tier III Design Documents and Constructed Facility Certified
Figure 3. Exterior of NEXTDC’s 12-MW M1 Melbourne data center, which is Uptime Institute Tier III Design Documents Certified
Figure 4. NEXTDC’s current footprint: 40+ MW IT capacity distributed across Australia
In order to accomplish the business goals NEXTDC established, it set the following priorities:
1. High reliability, so that clients can trust NEXTDC facilities with their mission critical IT equipment
2. The most energy-efficient design possible, especially where it can also assist reliability and total cost of ownerships, but not at the detriment of high reliability
3. Efficient total cost of ownership and day one CapEx by utilizing innovative design and technology
4. Capital efficiency and scalability to allow flexible growth and cash flow according to demand
5. Speed to market, as NEXTDC was committed to build and open five facilities within just a few years using a small team across the entire 5,000-kilometer-wide continent, to be the first truly national carrier-neutral colocation provider in
the Australian market
6. Flexible design suitable for the different regions and climates of Australia ranging
from subtropical to near desert.
NEXTDC put key engineering design decisions for these facilities through rigorous engineering decision matrices that weighed and scored the risks, reliability, efficiency, maintenance, total cost of ownership, day one CapEx, full final day CapEx, scalability, vendor local after-sales support, delivery, and references. The company extensively examined all the possible alternative designs to obtain accurate costing and modeling. NEXTDC Engineering and management worked closely to ensure the design would be in accord with the driving brief and the mandate on which the company is based.
NEXTDC also carefully selected the technology providers, manufacturers, and contractors for its projects. This scrutiny was critical, as the quality of local support in Australia can vary from city to city and region to region. NEXTDC paid as much attention to the track record of after-sales service teams as to the initial service or technology.
“Many companies promote innovative technologies; however, we were particularly interested in the after-sales support and the track record of the people who would support the technology,” said Mr. Van Zetten. “We needed to know if they were a stable and reliable team and had in-built resilience and reliability, not only in their equipment, but in their personnel.” NEXTDC’s Perth and Sydney data centers successfully achieved Uptime Institute Tier III Certification of Design Documents (TCDD) and Tier III Certification of Constructed Facilities (TCCF) using Piller’s isolated parallel (IP) diesel rotary uninterruptible power supply (DRUPS) system. A very thorough and exhaustive engineering analysis was performed on all electrical system design options and manufacturers available, including static uninterruptible power supply (UPS) designs with distributed redundant and block redundant distribution, along with the more innovative options such as the IP DRUPS solution. Final scale and capacity was a key design input for making the final decision, and indeed for smaller scale data centers a more traditional static UPS design is still favored by NEXTDC. For facilities larger than 5 MW, the IP DRUPS allows NEXTDC to:
• Eliminate batteries, which fail after 5 to 7 years, causing downtime and loss of redundancy and can cause
hydrogen explosions
• Eliminate the risks of switching procedures, as human error causes most failures
• Maintain power to both A & B supplies without switching even if more than one engine-generator set or UPS is
out of service
• Eliminate problematic static switches.
NEXTDC benefits because:
• If a transformer fails, only the related DRUPS engine generator needs to start. The other units in parallel can all remain on mains [editor’s note: incoming utility] power.
• Electrically decoupled cabinet rotary UPS are easier to maintain, providing less down time and more long-term reliability, which reduces the total cost of ownership.
• The N+1 IP DRUPS maintain higher loaded UPS/engine generators to reduce risk of cylinder glazing/damage at low and growing loads.
• Four levels of independently witnessed, loaded integrated systems testing were applied to verify the performance.
• The IP topology shares the +1 UPS capacity across the facility and enables fewer UPS to run at higher loads for better efficiency.
• The rotary UPSs utilize magnetic-bearing helium-gas enclosures for low friction optimal efficiency.
• The IP allows scalable installation of engine generators and UPS.
For example, the 11.5-MW S1 Sydney data center is based on 12+1 1,336-kilowatt (kW) continuous-rated Piller DRUPS with 12+1 IP power distribution boards. The facility includes sectionalized fire-segregated IP and main switchboard rooms. This design ensures that a failure of any one DRUPS, IP, or main switchboard does not cause a data center failure. The return ring IP bus is also fire segregated.
Figure 5. Scalable IP overall concept design
Differential protection also provides a level of Fault Tolerance. Because the design is scalable, NEXTDC is now increasing the system to a 14+1 DRUPS and IP design to increase the final design capacity from 11.5 to 13.8 MW of IT load to meet rapid growth. All NEXTDC stakeholders, especially those with significant operational experience, were particularly keen to eliminate the risks associated with batteries, static switches, and complex facilities management switching procedures. The IP solution successfully eliminated these risks with additional benefits for CapEx and OpEx efficiency. From a CapEx perspective, the design allows a common set of N+1 DRUPS units to be deployed based on actual IT load for the entire facility (see Figure 5). From an OpEx perspective, the advantage is the design is always able to operate in a N+1 configuration across the entire facility to match actual IT load, so the load is maintained at a higher percentage and thus at efficiencies approaching 98%, whereas low loaded UPS in a distributed redundant design, for example, can often have actual efficiencies of less than 95%. Operating engine-generator sets at higher loads also reduces the risks of engine cylinder glazing and damage, further reducing risks and maintenance costs (see Figure 6).
Figure 6. Distribution of the +1 IP DRUPS across more units provides higher load and thus efficiency
NEXTDC repeated integrated systems tests four times. Testing, commissioning, and tuning are the keys to delivering a successful project. Each set of tests—by the subcontractors, NEXTDC Engineering, independent commissioning agent engineers, and those required for Uptime Institute TCCF—helped to identify potential improvements, which were immediately implemented (see Figure 7). In particular, the TCCF review identified some improvements that NEXTDC could make to Piller’s software logic so that the control became truly distributed, redundant, and Concurrently Maintainable. This improvement ensured that even the complete failure of any panel in the entire system would not cause loss of N IP and main switchboards, even if the number of DRUPS is fewer than the number of IP main switchboards installed. This change improves CapEx efficiency without adding risks. The few skeptics we had regarding Uptime Institute Tier Certification became believers once they saw the professionalism, thoroughness, and helpfulness of Uptime Institute professionals on site.
Figure 7. Concurrently maintainable electrical design utilized in NEXTDC’s facilities
From an operational perspective, NEXTDC found that eliminating static switches and complex switching procedures for the facilities managers also reduced risk and delivered optimal uptime in reality.
MECHANICAL SYSTEMS
The mechanical system designs and equipment were also run through equally rigorous engineering decision matrices, which assessed the overall concept designs and supported the careful selection of individual valves, testing, and commissioning equipment. For example, the final design of the S1 facility includes 5+1 2,700-kW (cooling), high-efficiency, water-cooled, magnetic oil-free bearing, multi-compressor chillers in an N+1 configuration and received Uptime Institute Tier III Design Documents and Constructed Facility Certifications. The chillers are supplemented by both water-side and air-side free-cooling economization with Cold Aisle containment and electronically commutable (EC) variable-speed CRAC fans. Primary/secondary pump configurations are utilized, although, a degree of primary variable flow control is implemented for significant additional energy savings. Furthermore, NEXTDC implemented extreme oversight on testing and commissioning and continues to work with the facilities management teams to carefully tune and optimize the systems. This reduces not only energy use but also wear on critical equipment, extending equipment life, reducing maintenance, and increasing long-term reliability. The entire mechanical plant is supported by the IP DRUPS for continuously available compressor cooling even in the event of a mains power outage. This eliminates the risks associated with buffer tanks and chiller/compressor restarts that occur on most conventional static-UPS-supported data centers and is a common cause of facility outage.
The central cooling plant achieved its overall goals because of the following additional key design decisions:
• Turbocor magnetic oil-free bearing, low-friction compressors developed in Australia provide both reliability and efficiency (see Figure 8).
• Multi-compressor chillers provide redundancy within the chillers and
improved part load operation.
• Single compressors can be replaced while the chiller keeps running.
• N+1 chillers are utilized to increase thermal transfer area for better part-load coefficient of performance
(COP) and Fault Tolerance, as the +1 chiller is already on-line and operating should one chiller fail.
• Variable-speed drive, magnetic-bearing, super-low-friction chillers provide leading COPs.
• Variable number of compressors can optimize COPs.
• Seasonal chilled water temperature reset enables even higher COPs and greater free economization in winter.
• Every CRAC is fitted with innovative pressure-independent self-balancing characterized control valves
(PICCV) to ensure no part of system is starved of chilled water with scalable dynamic staged expansions, and also ensure minimal flow per IT power to minimize pumping energy.
• Variable speed drives (VSDs) are installed on all pumps for less wear and reduced failure.
• 100% testing, tuning, commissioning and independent witnessing of all circuits, and minimization of pump
∆P for reduced wear.
• High ∆T and return water temperatures optimize water-side free cooling.
• High ∆T optimizes seasonal water reset free-cooling economization.
The cooling systems utilize evaporative cooling, which takes advantage of Australia’s climate, with return water precooling heat exchangers that remove load from the chiller compressors for more efficient overall plant performance. The implementation of the water-side and air-side free economization systems is a key to the design.
Very early smoke detection apparatus (VESDA) air-quality automatic damper shutdown is designed and tested along the facility’s entire façade. Practical live witness testing was performed with smoke bombs directed at the façade intakes and utilized a crane to simulate the worst possible case bush-fire event, with a sudden change of wind direction to ensure that false discharges of the gas suppression could be mitigated.
The free-cooling economization systems provide the following benefits to reliability and efficiency (see Figures 9-12):
• Two additional cooling methods provide backup in addition to chillers for most of the year
• Reduced running time on chillers and pumps extend the life and reduce failure and maintenance.
• The design is flexible to use either water side or air side depending on geographic locations and outside air quality.
• Actual results have proven a reduced total cooling plant energy.
• Reduced loads on chillers provide even better chiller COPs at partial loads.
• Reduced pump energy is achieved when air-side economization is utilized.
Figure 9. (Top Left) Water-side free-cooling economization design principle. Note: not all equipment shown for simplicity
Figure 12. Air-side free-cooling economization actual results
WHITE SPACE
NEXTDC’s designer consultants specified raised floor in the first two data rooms in the company’s M1 Melbourne facility (the company’s first builds) as a means of supplying cold air to the IT gear. A Hot Aisle containment system prevents intermixing and returns hot air to the CRACs via chimneys and an overhead return hot air plenum and back to the CRACs. This system minimizes fan speeds, reducing wear and maintenance. Containment also makes it simpler to run the correct number of redundant fans, which provides a high level of redundancy, and due to fan laws, reduces fan wear and maintenance. At NEXTDC, containment means higher return air temperatures, which enables more air-side economization and energy efficiency and an innovative, in-house floor grille management tool that minimizes fan energy according to IT load (see Figure 13). For all later builds, however, NEXTDC chose Cold Aisle containment to eliminate the labor costs and time to build overhead plenum and chimneys for the Hot Aisle containment system, which reduced payback and return on investment. NEXTDC now specifies Cold Aisle containment in all its data centers.
Figure 13. Cold Aisle containment is mandated design for all new NEXTDC facilities to minimize CRAC fan energy
The common-sense implementation of containment has proved to be worthwhile and enabled genuine energy savings. Operational experience suggested that containment alone saves only a part of the total possible energy savings. To capture even more savings, NEXTDC Engineering developed a program that utilizes the actual contracted loads and data from PDU branch circuit monitoring to automatically calculate the ideal floor grille balance for each rack. This intelligent system tuning saved an additional 60% from NEXTDC’s CRAC fan power by increasing air-side ∆T and reducing airflow rates (see Figure 14).
Figure 14. Innovative floor grille tuning methods applied in conjunction with containment yielded significant savings
NEXTDC also learned not to expect mechanical subcontractors to have long-term operational expenses and energy bills as their primary concern. NEXTDC installed pressure/temperature test points across all strainers and equipment and specified that all strainers had to be cleaned prior to commissioning. During the second round of tests, NEXTDC Engineering found that secondary pump differential pressures and energy were almost double what they theoretically should be. Using its own testing instruments, NEXTDC Engineering determined that some critical strainers on the index circuit had in fact been dirtied with construction debris—the contractors had simply increased the system differential pressure setting to deliver the correct flow rates and specified capacity. After cleaning the relevant equipment, the secondary pump energy was almost halved. NEXTDC would have paid the price for the next 20 years had these thorough checks not been performed.
Similarly, primary pumps and the plant needed to be appropriately tuned and balanced based on actual load, as the subcontractors had a tendency to setup equipment to ensure capacity but not for minimal energy consumption. IT loads are very stable, so it is possible to adjust the primary flow rates and still maintain N+1 redundancy, thanks to pump laws—with massive savings on pump energy. The system was designed with pressure independent self-balancing control valves and testing and commissioning sets to ensure scalable, efficient, flow distribution, and high water-side ∆Ts to enable optimal use of water-side free-cooling economization. The challenge then was personally witnessing all flow tests to ensure that the subcontractors had correctly adjusted the equipment. Another lesson learned was that a single flushing bypass left open by a contractor can seriously reduce the return water temperature and prevent the water-side economization system from operating entirely if not tracked down and resolved during commissioning. Hunting down all such incorrect bypasses helped to increase the return water temperature by almost 11ºF (6ºC) for a massive improvement in economization.
Figure 15. Energy saving trends – actual typical results achieved for implementation
Operational tuning through the first year, with the Engineering and facilities management teams comparing actual trends to the theoretical design model provided savings exceeding even NEXTDC’s optimistic hopes. Creating clear and simple procedures with the facilities management teams and running carefully overseen trended trials was critical before rolling out these initiatives nationally. Every single tuning initiative implemented nationally after the facilities go-live date is trended, recorded, and collated into a master national energy savings register. Figure 15 provides just a few examples. Tuning has so far yielded a 24% reduction in the power consumption for mechanical plant with still conservative safety factors. Over time, with additional trend data and machine learning, power consumption is still expected to considerably improve on this via continuous improvement. NEXTDC expects a further 10–20% saving as NEXTDC is on target to operate Australia’s first National Australian Built Environment Rating System (NABERS) 5-star-rated mega data centers.
The design philosophy didn’t end with the electrical and mechanical cooling systems, but also applied to the hydraulics and fire protection systems:
• Rainwater collection is implemented on site to supply cooling towers, which provides additional hours of water most of the year.
• The water tanks are scalable.
• Rainwater collection minimizes mains water consumption.
• VESDA laser optical early detection developed in Australia and licensed internationally was utilized.
• The design completely eliminated water-based sprinkler systems from within the critical IT equipment data
halls, instead utilizing IG55 inert-gas suppression, so that IT equipment can continue to run even if a single server
has an issue (see Figure 16). Water-based pre-action sprinklers risk catastrophic damage to IT equipment that is
not suffering from an over-heating or fire event, risking unnecessary client IT outages.
• The gas suppression system is facility staff friendly, unlike alternatives that dangerously deplete oxygen levels in
the data hall.
• The design incorporates a fully standby set of gas suppression bottle banks onsite.
• The gas suppression bottle banks are scalable.
• The IG55 advanced gas suppression is considered one of the world’s most environmentally friendly gas
suppression systems.
Figure 16. Rainwater, environmentally friendly inert gas fire-suppression and solar power generation innovations
The design of NEXTDC’s data centers is one of the fundamental reasons IT, industrial, and professional services companies are choosing NEXTDC as a colocation data center partner for the region. This has resulted in very rapid top and bottom line financial growth, leading to profitability and commercial success in just a few years. NEXTDC was named Australia’s fastest-growing communications and technology company at Deloitte Australia’s 2014 Technology Fast 50 awards. Mr. Van Zetten said, “What we often found was that when innovation was primarily sought to provide improved resilience and reliability, it also provided improved energy efficiency, better total cost of ownership, and CapEx efficiency. The IP power distribution system is a great example of this. Innovations that were primarily sought for energy efficiency and total cost of ownership likewise often provided higher reliability. The water-side and air-side economization free cooling are great examples. Not only do they reduce our power costs, they also provide legitimate alternative cooling redundancy for much of the year and reduce wear and maintenance on chillers, which improves overall reliability for the long term. “Cold Aisle containment, which was primarily also sought to reduce fan energy, eliminates client problems associate with air mixing and bypassing, thus providing improved client IT reliability.”
Jeffrey Van Zetten
Jeffrey Van Zetten has been involved with NEXTDC since it was founded in 2010 as Australia’s first national data center company. He is now responsible for the overall design, commissioning, Uptime Institute Tier III Certification process, on-going performance, and energy tuning for the B1 Brisbane, M1 Melbourne, S1 Sydney, C1 Canberra, and P1 Perth data centers. Prior to joining NEXTDC, Mr. Van Zetten was based in Singapore as the Asia Pacific technical director for a leading high-performance, buildings technology company. While based in Singapore, he was also the lead engineer for a number of successful energy-efficient high tech and mega projects across Asia Pacific, such as the multi-billion dollar Marina Bay Sands. Mr. Van Zetten has experience in on-site commissioning and troubleshooting data center and major projects throughout Asia, Australia, Europe, North America, and South America.
https://journal.uptimeinstitute.com/wp-content/uploads/2015/09/NextDC.jpg4751201Kevin Heslinhttps://journal.uptimeinstitute.com/wp-content/uploads/2022/12/uptime-institute-logo-r_240x88_v2023-with-space.pngKevin Heslin2015-09-22 11:49:232015-09-22 11:49:23Australian Colo Provider Achieves High Reliability Using Innovative Techniques
Telecommunications company Swisscom AG builds a new data center in Berne, one of seven Tier IV data centers in Europe
By Beat Lauber, Urs Moell, and Rudolf Anker
Swisscom AG, a Switzerland-based telecommunications company, recently built a new data center in Berne, Switzerland. Swisscom spent three years and invested around US$62.5 million to build a highly efficient and reliable data center. Following two years of construction, the new Berne-Wankdorf Data Center was fully operational in January 2015.
The Swisscom Berne-Wankdorf Data Center xDC, Phase 1, is one of only seven data centers in Europe awarded Uptime Institute Tier IV Certification of Constructed Facility and the first in Switzerland. It also has top ratings for energy efficiency, thanks to an innovative cooling concept, and won a 2015 Brill Award for Efficient IT. The new building is the largest of the 24 data centers operated by Swisscom in Switzerland (see Figure 1).
Figure 1. Exterior of Swisscom’s Berne Wankdorf data center, photo Nils Sandmeier
The data center is designed on a modular principle, permitting future expansion whenever necessary. This ensures the required degree of investment security for Swisscom and its customers. The initial stage includes four modules with access areas for personnel and equipment. Swisscom can add capacity as needed, up to a total of seven modules. The data center will house around 5,000 servers and approximately 10,000 customer systems.
MODULAR 2N CONCEPT
Each module in Berne-Wankdorf Data Center has an IT capacity of 600 kW (see Figure 2). Modules A to D, which have a total capacity of 2.4 megawatts (MW), were built in the first phase of construction. Modules E, F, and G are to be built at some point in the future, either individually or in parallel. In addition to the modules for production, an entrance module housing a reception area, a lodge, workstations, and break-out spaces have also been built.
Figure 2. Site layout with extension modules
Two independent cells (electrical power supply and cooling) rated at 150% of the nominal power demand supply each module. This means that either cell can cover the entire power requirement of a module. The initial configuration includes four cells to supply four modules. Additional modules, each with an individual supply cell, can be attached without interruption. The supply is made via two independent paths, providing uninterrupted electricity and cooling.
SITE ARCHITECTURE
The building totals four stories, three above ground and one below ground. Server rooms are located on the ground and first floors (see Figure 3). Fuel and water tanks, as well as storage areas, are located in the basement. Outside air cools the energy supply equipment. For this reason most of the top floor is dedicated to housing building services (see Figure 4). The frame of the building as well as its floors, ceilings, and walls are made primarily from prefabricated sections of concrete (see Figure 5). Only the basement and the sections providing reinforcement for seismic protection are constructed from cast-in-situ concrete. The façade also consists of prefabricated sections of concrete 15 meters (m) high with inlaid thermal insulation. The server rooms do not have visible pillars. Joists 1.05 m high support the ceilings and span 13.8 m above the IT equipment. The space between the joists is used for air movement. Warm air from the server racks is fed through a suspended ceiling to recirculating air coolers. This removes the need for a raised floor in the server rooms (see Figure 6).
Figure 3. Ground floor layout
Figure 4. Second floor layout
Figure 5. Bearing structure
Figure 6. System profile through a server room
EFFICIENT COOLING SYSTEMS
An adiabatic re-cooling system with rainwater enables Swisscom to eliminate mechanical chillers completely. As long as the outside temperature is below 21°C (70°F), the re-cooling units work on dry free cooling. When the temperature rises above 21°C (70°F), water added to the warm air draws out heat through evaporation.
The cooled water from the re-cooling units is then used to supply the CRACs to cool the IT systems. The racks are configured in a Hot Aisle containment cube that keeps the cold supply air and warm exhaust air entirely separate. Warm air from the Hot Aisle is supplied to the recirculating air coolers via a suspended ceiling. This layout means that the majority of the room is on the cool side of the cooling system. As a result, relatively pleasant working conditions are assured, despite relatively warm cooling air (see Figure 7).
Figure 7. Pictorial schematic of the cooling supply
The CRACs are specifically designed to a high cooling water temperature 26° C (79°F) and lowest possible inlet air temperature 28°C (82°F). The exhaust air temperature is 38° C (100°F). With the exception of a small number of damp hot days in the summer, this ecological cooling concept can supply air cooler than 28°C (82°F) all year round.
Retrospective calculations (see Figure 8) based on data from the equipment show that the maximum foreseeable temperature of the supply air would be 30°C (86°F) in the worst-case scenario (full load, failure of an entire supply cell, extreme climate values from the last 20 years).
Figure 8. h-x diagram for air conditions 2005
Rainwater for the adiabatic cooling system is collected from the roof, where there are two separate tanks, each of which can hold enough water to support at least 72 hours of operation. Two separate networks supply water pumper from the two tanks to hybrid recoolers through redundant water treatment systems. The recoolers can be supplied either from the osmosis tank or directly from the rainwater tank. If there is not enough rainwater, water is drawn from the city water network to fill the tanks. During the heating season, the heat produced from the cooling systems heats the building directly. Efficient heat distribution regulates the temperature in the rooms. The data center dissipates the remainder of the waste heat to the local energy supplier’s existing waste heat grid. The thermal energy from grid heats a residential quarter and swimming pools. The more consumers use this energy, the less the hybrid recoolers are operated, whereby a further energy-saving potential is utilized.
NOBREAK UPS
The Wankdorf Data Center does not use batteries but instead deploys SMS NoBreak equipment safeguards the uninterruptible power supply (UPS) using kinetic energy. Should the power supply fail, the NoBreak equipment uses flywheel inertia to ensure that operation continues uninterrupted until the diesel engine-generator sets start up (within seconds) to take over the energy supply (see Figure 9).
Figure 9. NoBreak equipment
EXTENSIVE BUILDING AUTOMATION
Essentially, the building automation system (BAS) comprises two redundant VMWare ESX servers on which the BAS system and an energy management tool are installed. While the building automation system supports all vital functions, the energy management tool is tasked with evaluating and recording energy measurements.
A redundant signalling system provides a back-up solution for alarm signals. The system has its own independent network. All measured values are displayed and recorded. An energy management function analyses the measured values so that energy efficiency can be continuously optimized.
MAXIMUM PROTECTION
From the selection of its location to its specific construction, from its physical protective measures to its advanced security and safety concept, the Berne-Wankdorf Data Center offers the maximum in protection. Access is strictly controlled with a biometric access control system and the site is monitored from a lodge that is staffed around the clock.
Beat Lauber
Beat Lauber is an approved visionary in the field of data center design. He is founding member and CEO of RZintegral AG, a leading Swiss company specializing in data center planning and engineering. His career includes more than 20 years of experience with critical infrastructures and involves notable challenges in design, planning, realization, and project management of large data center projectss. Audits and mandates for strategies complete his list of activities. Mr. Lauber graduated as Architect FH/SIA and made post-graduate studies in Business Administration and Risk Management and is Fire Protection Manager CFPA-E.
Urs Moell
Urs Moell is senior data center designer at RZintegral AG and has acquired a broad knowledge in strategies and layout of critical infrastructures as well as availability, energy efficiency, safety and security. He is in charge of the development and layout, architectural design and the optimal coordination of all trades for best-performance data centers. He graduated as Architect ETH and has 20 years of experience planning buildings as well.
Rudolf Anker
Rudolf Anker is head of Datacenter Management at Swisscom IT, where he has been since 2004. His responsibilities include project manager of new data centers, including planning, lifecycle, and operations. He initiated and provided overall project management for the new DC RZ Future and xDC data center buildings in Zollikofen and Wankdorf).
https://journal.uptimeinstitute.com/wp-content/uploads/2015/09/swisscom.jpg4751201Kevin Heslinhttps://journal.uptimeinstitute.com/wp-content/uploads/2022/12/uptime-institute-logo-r_240x88_v2023-with-space.pngKevin Heslin2015-09-14 13:47:022015-09-21 13:28:08Switzerland’s First Tier IV Certified Facility Achieves Energy Efficiency
IT services provider develops innovative cooling system for use in its own cloud computing data centers
By Jong Wan Kim
LG CNS is a major IT services and solutions provider in Korea. Since 1987, LG CNS has acted as the CIO for LG Group’s affiliates. As of the end of 2014, its data centers provided IT services to LG Group’s affiliates in more than 40 countries, including China, Japan, United States, India, Indonesia, Brazil, Colombia, Malaysia, and several nations in Europe. LG CNS also offers services government, public, and financial sector entities.
LG CNS operates four data centers in Korea and one each in Beijing, Nanjing, New Jersey, and Amsterdam, The Netherlands. Three of its domestic data centers are located in or near Seoul, Korea’s capital; the other one is in Busan, which is located in southeast Korea and is the country’s the second largest city (see Figure 1).
Figure 1. LG CNS data centers worldwide
LG CNS and its operating technicians and potential customers all view energy efficiency as crucial to controlling costs. In recent years, however, rapid developments have dramatically improved IT performance. At the same time, new processors produce more heat, so data centers must provide more space for power and cooling infrastructure. As a result, LG CNS concluded that it needed to develop a cooling system optimized for very dense data centers. They expected that the optimized cooling system would also be more energy-efficient.
LG CNS developed and applied an optimized custom cooling system concept to its new 40-megawatt (MW), 32,321-square-meter (m2) Busan Global Cloud Data Center, which is the largest in Korea. This facility, which opened in 2013, serves as the company’s hub in northeast Asia (see Figure 2). The Busan Data Center can accommodate 3,600 servers at 6 kilowatts (kW) per rack.
Figure 2. Busan Global Cloud Data Center
The Busan Data Center makes use of whole-building, chimney-style hot-air exhaust and a hybrid cooling system (LG CNS calls it a Built-up Outside Air Cooling System) that the company developed to improve upon the energy efficiency it achieved in its existing facilities, which used a packaged-type air conditioning system (existing packaged-type air conditioning system). In addition, LG CNS developed its Smart Green Platform (SGP) software that automatically controls the unique cooling system and other data center components to achieve free cooling for eight months of the year without running chillers. The annual average PUE is estimated to be 1.39, with a minimum of 1.15 in the winter. After seeing positive results at the Busan Data Center, LG CNS decided to apply the cooling system to its Inchon Data Center, which was built in 1992 and was the first purpose-built data center in Korea.
THE BUSAN DATA CENTER SITE
The Busan location provides three advantages to LG CNS: geographic, network connectivity, and proximity to new customers.
• Geographic: Data centers should located be where the risk of natural disasters, especially earthquakes, is low. Korea has relatively little seismic activity, making it a good candidate for data centers. The building is also set on an elevation that is higher than the historic high water levels.
• Network Connectivity: Korea has four active submarine connections: the Busan cable, the Keoje cable, the C2C Basan cable, and Taean cable, which connect to the APCN, APCN-2, C2C, China-US CN, EAC, FNAL/RNAL, FLAG FEA, RJCN, R-J-K, and TPE submarine cable systems. This connectivity positions Busan as an IT hub for Asia-Pacific (see Figure 3).
• New customers: Development plans promise to transform Busan into a global IT hub with many foreign companies accessing its infrastructure resources.
Figure 3: Map of submarine cables serving Busan
COOLING THE BUSAN DATA CENTER
Utilizing cold outside air may be the best way to reduce energy use. From June through September, outside air temperatures near Busan are often greater than 30°C (86°F) and humid, so it cannot be used for cooling (see Figure 4). To meet this environmental challenge, LG CNS developed a system that converts space that normally houses CRAC units into a functional CRAC. Although LG CNS developed the system for its new Busan Data Center, it subsequently applied it to the existing Inchon Data Center. In the existing data center, this transformation involved disassembling the CRACs. In both new and legacy retrofit applications, LG CNS utilized the walls of the CRAC room as CRAC surfaces and its aisles as paths for airflow.
Figure 4. Average annual temperatures in South Korea
EXISTING PACKAGED-TYPE CRACS
The existed packaged-type air conditioning system used in existing LG CNS facilities includes an air supply louver, outside air chamber, air supply duct, mixing chamber, filter, humidifier/cooling coil, and fan. These systems require less space than other systems (see Figure 5-7). The existing packaged-type air conditioning system used at LG CNS facilities has three operating modes that vary by outside temperature. At ≈8–16°C (46-62°F), existing packaged-type CRACs provide additional cooling to supplement the outside air; and when the temperature is more than 16°C (62°F), the CRAC is fully operational and no outside air is supplied. When the temperature is below 7°C (45°F), the system uses 100% outside air and the CRAC is not in operation. This is accomplished by stopping the compressors where dedicated air-cooled DX CRACs are in use and the chillers where chilled water CRAHs are in use. Both types are used in LG CNS facilities. When outside air is supplied only the internal fan of CRAC is required, and when the temperature increases the CRAC begins to operate. In Korea, this system yields 100% compressor savings only from December to February and partial energy savings only from October to November and March to May. Limits to the system include:
• The small air supply duct limits the airflow and requires more fan energy. In addition, the narrow inner space makes it difficult to access for maintenance.
• Winter air in Korea is quite dry, so humidification is required during the winter when 100% outside air cooling is possible. However, the size of the CRAC limits its ability to humidify, which causes inefficiencies.
• The existing packaged-type air conditioning requires space for maintaining plumbing, including pipes and ducts.
Figure 5. Diagram of existing outside air conditioning (air supply louver 110, outside air chamber 120, air supply duct 130, mixing chamber 140, filter 150, humidifier/cooling coil 160, and fan 170.
Figure 6. Plan view of existing packaged-type CRAC
Figure 7. Sectional view of the CRAC
BUILT-UP OUTSIDE AIR COOLING SYSTEM
LG CNS created a task force team (TFT) comprising Operations, cooling system vendors, consulting firms, construction personnel, and other relevant professionals to develop a method of improving the flow of outside air for cooling interior white spaces. The TFT investigated new approaches for approximately 10 months, including pilot testing.
The TFT focused on three things:
• Introducing more outdoor air to the computer room
• Controlling the temperature of the static air supply by mixing outside cold air with the inside heated air
• Controlling the airflow of exhaust hot air by maximizing airflow to the outside.
The main concept that resulted from the investigation involves:
• Utilizing the building floor and ceiling as a duct and chamber
• Customizing the size of the CRAC room walls to meet cooling demands
• Increasing humidification efficiency by making the path that air travels longer after it passes through the cold water coil
• Creating a separate pathway for exhausting hot air
• Utilizing a maintenance space as a duct for the CRAC while it is operating and as a maintenance space when it is not.
The Built-up Outside Air Cooling System applied in LG CNS’s new Busan uses outdoor air and built chimneys to exhaust heat generated by the servers, which reduces energy consumption (see Figure 8). In the company’s existing data centers, the width of the packaged-type CRAC was about 2.5 meters (m). The Built-up Outside Air Cooling System should be 4-5-m wide in order to increase the volume of outside air used for cooling. This change, however, increases the construction costs and the size of the building, which can be a significant expense because of the high cost of real estate in Korea. Saving energy is important, but larger equipment and space requirements for infrastructure can reduce IT white space. To address these issues, the width of the additional space required to supply outdoor air in the Busan Data Center is 3 m.
Figure 8. Architecture of the Built-up Outside Air Cooling System
Figure 9. Sectional view of Built-up Outside Air Cooling System OA Damper (410): Damper to control the outside air supply OA Louver (411): Opening to introduce the outside air supply and keep rain and sunshine out RA Damper (420): Damper to control the indoor air Filter (430): Filter to remove dust from outside and inside Coil, Humidifier (440): A water mist humidifier to control humidity and a coil for cooling air supplied inside Main Pipe (450): Pipe to provide supply and return water Fan (461): Fan for supplying cold air into internal server room
Because of the importance of saving space, LG CNS tested various designs to determine that an S-shaped design would provide the optimum airflow in a small space (see Figure 9). In addition, the system supplies additional outside air using the Built-up Outside Air Cooling System’s internal fan. Care also has to be taken to separate the supply and exhaust air paths to ensure that the mixed air does not come into upper computer room. This task can be complicated in Korea, where most Korean data centers are at least five-stories high. To solve this issue, LG CNS put the cold air supplies on either side of the Busan Data Center and the exhaust in the middle passage to its roof. The company calls it “Chimney,” the wind way (蠾‘).
Figure 10. Built-up Cooling, Pretest Condition
Figure 11. Mock-up testing
MOCK-UP TEST
As soon as the design was complete, LG CNS made a separate testing space to determine how changes in ambient temperature would change temperatures in the computer room and evaluate the SGP software (see Figure 10 and 11). LG CNS also used the space to evaluate overall airflow, which was also satisfactory, because the system utilized the entire CRAC room. Coil static pressure, increased airflow, mixing efficiency, utilization of maintenance space, and humidification efficiency also checked out well, (see Figure 12-14) and it was determined that the overall system would work to extend the period in which outside air could be used. LG CNS expected 19% power savings compared to the existing packaged type CRAC.
Figure 12. Locations of temperature sensors
Figure 13. Airflow and temperature distribution (plan view)
Figure 14. Airflow and temperature distribution (front view)
OPERATION OF BUILT-UP COOLING
The Built-up Outside Air Cooling System has three modes of operation: full outside air mode, mixed mode, and circulation mode. Full outside air mode introduces 100% outside air by means of a damper installed on the building exterior. This mode is used when temperatures are ≈16–20°C (62-68°F) from March to May and September to November. Air enters the building and passes through a mixing chamber without mixing with hot air inside the computer room. If the temperature of the supply air in the computer room is lower than appropriate, the system automatically changes to mixed mode. Full outside air mode was designed to meet LG CNS’s service level agreements (SLA) at outside air temperatures up to 20°C (62-68°F), and LG CNS found that it could maintain Cold Aisle temperatures of 20–21°C (68-70°F) when the supply air was below 20°C (68°F). In fact, LG CNS found that it could still meet its SLAs even when outside air temperatures reached 23°C (73°F). At that outside air temperature the maximum temperature in front of the servers is ≈23–24°C (73-75°F), which still meets LG CNS’s SLAs [23~25°C (73-77 °F) air at the servers]. LG CNS believes that the fast airflow generated by using a whole room as a big CRAC contributes to maximizing cooling from the outside air.
When the ambient temperature is less than 16°C (62°F), the system operates in mixed mode. In this mode of operation, the system of operation mixes outdoor cold air and warm air before introducing it into the computer room. Sensors just inside the building’s outer wall measure the air temperature and adjust the outside damper and the computer room vent dampers to supply air to the computing room at the proper temperature. Circulation mode activates when the outside temperature is greater than 23°C (73°F). At those high temperatures, the outside damper is closed so that no outside air is introduced. Instead air cooled by cold water from the chiller system is introduced into the computer room. By opening the computer room vent dampers 100% while the outside damper remains closed, 4–8°C (39-46°F) cold water from the chiller cools air to the appropriate temperature to supply the computer room.
In Busan, the chiller operates at 100% over 25°C (77°F). Therefore LG CNS sets the optimum temperature data by increasing the temperature of the cooling water from the cooling tower and the temperature of chilled water from the chiller to reduce energy use.
RESULTS
At first there were many doubts about whether Korea’s first Built-up Outside Air Cooling System would reduce energy use, but now many companies view the Busan Data Center as a benchmark. The Built-up Outside Air Cooling System enables LG CNS to use 100% outside air about 8.5 months per year and achieve a PUE of 1.38, which is lower than the design basis PUE of 1.40. The Busan Data Center received the highest rating of A +++ from the Korean Information Technology Service Industry Association (the Association) as a result of a green data center audit. This was the first time a local data center received the Green Data Center Certification since the Association first instituted it in 2012. The Association explained that the amount of electricity saved when the PUE index at a large data center was reduced from 1.80 to 1.40 is equal to the energy that 5,840 ordinary Korean households use for a year (see Figure 15).
Figure 15. PUE at Busan Global Cloud Data Center
APPLICATION OF BUILT-UP AIR COOLING SYSTEM TO AN EXISTING DATA CENTER
LG CNS decided to apply the Built-up Outside Air Cooling System at its Inchon Data Center. It was the first purpose-built data center in Korea in 1992 and has been operating more than 20 years. Energy efficiency is relatively low because the servers are not arranged in a Hot Aisle/Cold Aisle configuration, even though aging power and cooling equipment have been replaced in recent years. Unlike the Busan site, Inchon provided no separate space to build in, since the servers and the CRACs are both in the computing room. As a result LG CNS had to customize the Built-up Outside Air Cooling System. According to power consumption analysis, the existing packaged type system used in the Inchon Data Center accounted for 36% of the facility’s total energy use, the second largest amount after IT. Air-cooled DX CRACs and chilled water CRAHs used in the facility consumed a high percentage of this energy. LG CNS decided to install the Built-up Outside Air Cooling System as an addition to the existing CRAC system. It was not easy to access the outer periphery where the CRAC is installed from the exterior, so LG cut into the exterior wall of the building. There are two types of CRAC units, down-blower and upper-blower type (see Figures 16 and 17).
Figure 16. Model of down (above) and upper blow type (below)
The type used on a project depends on the cooling exhaust system. The down-blower type is designed to mix internal air and outside air. It needs to have exhaust temperature sensors, an absorbing temperature sensor, a CRAC exhaust sensor, and an internal air-absorbing sensor. A damper regulates the exhaust and a filter cleans the air supply. The basic concept of the upper-blower type CRAC is very similar but with a different equipment layout. The outside air and mixing chambers ducts of upper blower CRACs are large enough to allow 100% supply air to be introduced into the computing room. The Inchon Data Center building is a two-layered structure, with down-blower type CRACs on the first floor and upper-blower types on the second floor. LG CNS designed two ways of supplying cold outside air into the computer room and installed a big duct for the down blower and upper blower CRACs to supply outside air from the cut outer wall.
Figure 17. The down (above) and upper blower (below) type of CRACs deployed at the Inchon Data Center
IMPLEMENTATION AND PRE-TEST
The Built-up Outside Air Cooling System CRAC is installed in a 132-m2 space on the first floor of the Inchon facility. As in the Busan Data Center, the system has three modes, with similar operating parameters (see Figure 18).
Figure 18. Three modes of operation, outside air mode, mixing mode, and circulation mode (top to bottom)
Even though LG CNS had experience with its system in Busan, the Inchon installation had additional risks because all the computer rooms were in operation. Before the construction phase, a preliminary review of expected risks was conducted so as not to affect the existing servers. In order to protect against dust caused by cutting the outside walls from entering the rooms, LG CNS installed medium density fiberboard (MDF). A temporary finish coating both sides of the exterior wall prevented rain from entering the building. When LG CNS connected the new Built-up Outside Air Cooling System to the existing CRAC, it had to turn off power to the existing CRACs. That eliminated all cooling into the server rooms so portable fans were used to provide cooling air. To maintain the proper temperatures during construction, LG CNS operated the backup CRAC and the temperature of the existing CRAC was set lower than baseline. During the pre-test, the system was able to maintain the computer room temperature for the enclosed space without being affected by the ambient airflow in all three operating modes. However, the computer room is an open type, so the amount of cooling supplied and heating from servers differs from area to area. The solution was to optimize cooling by setting individual targets area by area (see Figure 19).
Figure 19. The picture of Inchon data center with built up Built-up Outside Air Cooling System
As the Built-up Outside Air Cooling System CRAC was attached to the inner wall of the computer room, cooling air could not reach the center of the room, so there was a hot spot. Therefore, supply and exhaust vents were installed separately in the center of the room to smooth circulation.
RESULTS AND BENEFITS
As a result of the Inchon retrofit, LG CNS is able to maximize its use of outside air and save 1.9 million kWh in electricity costs. The installation saves LG CNS about US$228,000 in electricity annually, with PUE improving from 1.91 to 1.62 (see Figure 21). There are various methods of improving the efficiency of air conditioning systems and reducing the heat generated in high-density data centers. However, it is much easier to introduce the Built-up Method into a newly built data center than an existing data center, such as the Inchon Data Center. However, LG CNS, through advance planning and risk prevention activities, managed the feat.
Figure 20. 100% IT power change when outside air supplied
Figure 21. PUE before and after Built-up Outside Air Cooling System
ONGOING COMMITMENT
When LG CNS first started planning the Busan Data Center, it built on four main pillars: efficiency, reliability, scalability, and security. And all four goals were integral to achieving overall sustainability. These pillars are the foundations of the data center and ensure that they are able to meet customer needs now and in the future. With that commitment, LG CNS has worked to accumulate technologies in energy efficiency and continue to make efforts to reduce energy use.
Jong Wan Kim
Jong Wan Kim is vice president of the LG CNS Infrastructure Unit. He has more than 25 years experience in data center management, distributed systems, and system integration projects. He has implemented operational innovations in the company’s data centers and focused on maximizing productivity based on automation in its next generation data center. Since 2010, Mr. Kim has been president of Data Center Associates, which comprises 28 domestic data center executives. He has consulted the government regarding data center-related policies and encouraged the exchange of technical information among national data centers operators to raise local standards to the global level. More recently, Mr. Kim has concentrated on providing platform-based infrastructure services, including software-defined data centers and cloud computing in distributed computing environments.
https://journal.uptimeinstitute.com/wp-content/uploads/2015/08/LG.jpg4751201Kevin Heslinhttps://journal.uptimeinstitute.com/wp-content/uploads/2022/12/uptime-institute-logo-r_240x88_v2023-with-space.pngKevin Heslin2015-09-02 08:34:082015-09-02 08:34:08LG CNS Deploys Custom Cooling Approach in Korean Data Centers
Unipol Takes Space Planning to a New Level
/in Design/by Kevin HeslinMunicipal requirements imposed difficult space considerations for Italian insurance company’s Tier IV data center
By Andrea Ambrosi and Roberto Del Nero
Space planning is often the key to a successful data center project. Organizing a facility into functional blocks is a fundamental way to limit interference between systems, reduce any problem related to power distribution, and simplify project development. However, identifying functional blocks and optimizing space within an existing building can be extremely complex. Converting an office building into a data center can cause further complexity.
This was the challenge facing Maestrale, a consortium of four engineering companies active in the building field including Ariatta Ingegneria dei Sistemi Srl as the mechanical and electrical engineer, when a major Italian insurance company, UnipolSai Assicurazioni S.p.a (UnipolSai), asked it to design a data center in an office building that had been built at the end of the 1980s in Bologna, Italy. UnipolSai set ambitious performance goals by requiring the electrical and mechanical infrastructure to be Uptime Institute Tier IV Certification of Constructed Facility and very energy efficient.
In addition, the completed facility, designed and built to meet UnipolSai’s requirements, has the following attributes:
• 1,200 kilowatts (kW) maximum overall IT equipment load
• UPS capacity: not less than 10 minutes
• Four equipment rooms having a total area of 1,400 square meters (m2)
• Cold Aisle/Hot Aisle floor layouts : In an energy-conscious project, all innovative free-cooling technologies must be considered.
After a thorough investigation of these free-cooling technologies, Ariatta chose direct free cooling for the UnipolSai project.
MUNICIPAL RESTRICTIONS
The goal of the architectural and structural design of a data center is to accommodate, contain, and protect the mechanical, electrical, and IT equipment. The size, location, and configuration of the mechanical and electrical infrastructure will determine the architecture of the rest of the building. In a pre-existing building, however, this approach does not always apply. More often, builders must work around limitations such as fixed perimeter length and floor height, floors not capable of bearing the weight of expected IT equipment, lack of adjoining external spaces, and other restrictions imposed by municipal regulations. In this project, a series of restrictions and duties imposed by the Municipality of Bologna had a direct impact on technical choices, in particular:
• Any part or any piece of equipment more than 1.8-meters high on the outside yard or on any external surface of the building (e.g., the roof) would be considered added volume, and therefore not allowed.
• Any modification or remodelling activity that changed the shape of the building was to be considered as incompatible with municipal regulations.
• The location was part of a residential area with strict noise limits (noise levels at property lines of 50 decibels [dbA] during the day and 40 dbA at night).
New structural work would also be subject to seismic laws, now in force throughout the country. In addition, UnipolSai’s commitment to Uptime Institute Tier IV Certification required it to also find solutions to achieve Continuous Cooling to IT equipment and to Compartmentalize ancillary systems. The final design incorporates a diesel rotary UPS (DRUPS) in a 2N distribution scheme, a radial double-feed electrical system, and an N+1 mechanical system with dual-water distribution backbone (Line 1 and Line 2) that enable the UnipolSai facility to meet Uptime Institute Tier IV requirements. Refrigerated water chillers with magnetic levitation bearings and air exchangers inserted in an N+1 hydraulic scheme serve the mechanical systems. The chillers are provided with double electric service entrance controlled by an automatic transfer switch (ATS). The DRUPS combine UPS and diesel engine-generator functions and do not require battery systems, which are normally part of static UPS systems. Uptime Institute Tier IV requires Compartmentalization, which necessitates more space. Eliminating the batteries saved a great deal of space. In addition, using the DRUPS to feed the chillers ensured that the facility would meet Tier IV requirements for Continuous Cooling with no need for storage tanks, which would be difficult to place in this site. The DRUPS also completely eliminated cooling requirements in the UPS room because the design ambient temperature would be around 30°C (maximum 40°C). Finally, using the DRUPS greatly simplified the distribution structure, limiting the ATSs on primary electric systems to a very minimum.
Municipal restrictions meant that the best option for locating the DRUPS and chillers would require radically transforming some areas inside building. For example, Ariatta uncovered an office floor and adapted structures and waterproofing to install the chiller plant (see Figures 1 and 2).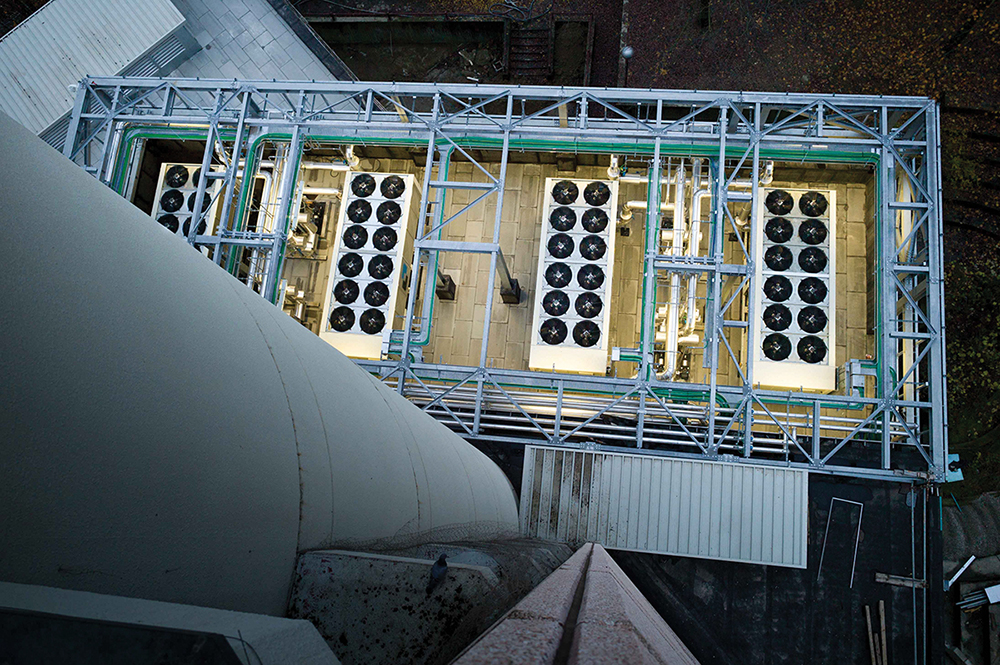
Figures 1 and 2. Bird’s eye and ground level views of the chiller plant.
Positioning the DRUPS posed another challenge. In another municipality, its dimensions (12-m length by 4.5-m height), weight, and maintenance requirements would have guided the design team towards a simple solution, such as installing them in containers directly on the floor. However, municipal restrictions for this location (1.8-m limit above street level) required an alternative solution. As a result, geological, geotechnical, and hydrogeological studies of the site of the underground garage showed that:
• Soil conditions met the technical and structural requirements of the DRUPS installation.
• The stratum was lower than the foundations.
• Flood indexes are fixed 30 centimeters above street level (taking zero level as reference).
The garage area was therefore opened and completely modified to contain a watertight tank containing the DRUPs. The tank included a 1.2-m high parapet to prevent flooding. The tank was equipped with redundant water lifting systems fed by the DRUPS (see Figures 3 and 4).
Figures 3 and 4. Particular care was given to protect the DRUPS against water intrusions. Soundproofing was also necessary.
Meeting the city’s acoustic requirements required soundproofing the DRUPS machines, so the DRUPS systems were double shielded reducing noise levels to 40 decibels (dbA) at 10 m during normal operation when connected to mains power. Low-noise chillers and high-performance acoustic barriers helped the entire facility meets its acoustical goals.
After identifying technical rooms and allocating space for equipment rooms, Ariatta had to design systems that met UnipolSai’s IT and mechanical and electrical requirements, IT distribution needs, and Uptime Institute Tier IV Compartmentalization requirements.
The floors of the existing building did not always align, especially on lower stories. These changes in elevation were hard to read in plans and sections. To meet this challenge, Starching S.R.L. Studio Architettura & Ingegneria and Redesco Progetti Srl, both part of the Maestrale Consortium, developed a three-dimensional Revit model, which included information about the mechanical and electrical systems. The Revit model helped identify problems caused by the misalignment of the floors and conflict between systems in the design phase. It also helped communicate new information about the project to contractors during the construction phase (see Figure 5 and 6).
Figures 5 and 6. Revit models helped highlight changes in building elevations that were hard to discern in other media and also aided in communication with contractors.
The use of 3D models is becoming a common way to eliminate interference between systems in final design solutions, with positive effects on the execution of work in general and only a moderate increase in engineering costs.
Figure 7. Fire-rated pipe enclosure
At UnipolSai, Compartmentalizing ancillary systems represented one of the main problems to be resolved to obtain Uptime Institute Tier IV Certification because of restrictions caused by the existing building. Ariatta engaged in continuous dialogue with the Uptime Institute to identify technical solutions. This dialogue, along with studies and functional demonstrations carried out jointly with sector specialists, led to a shared solution where two complementary systems that form the technological backbone are compartmentalized, with respect to one another (see Figure 7). The enclosures, which basically run parallel to each other, have:
• An external fire-resistant layer (60 minutes, same as the building structure)
• An insulation layer to keep the temperature of the technological systems within design limits for 60 minutes
• A channel that contains and protects against leaks absorbs shocks
• Dedicated independent mounting brackets. This solution was needed where the architectural characteristics of the building affected the technological backbone (see Figure 8).
Figure 8. The layout of the building limited the potential paths for pipe runs.
ENERGY EFFICIENCY
The choice of direct free cooling was made following an environmental study intended to determine and analyse the time periods when outdoor thermo-hygrometric conditions are favorable to the indoor IT microclimate of the UnipolSai data center as well as the relevant technical, economic, and energy impact of free cooling on the facility. The next-generation IT equipment used at UnipolSai allows it to modify the environmental parameters used as reference.
Figure 9. UnipolSai sized equipment to meet the requirements of ASHRAE’s “Thermal Guidelines for Data Processing Environments, 3rd edition,” as illustrated by that publication’s Figure 2.
The air conditioning systems in the data center were sized to guarantee temperatures between 24–26°C (75-79°F) per Class A1 equipment rooms as per ASHRAE “Thermal Guidelines for Data Processing Environments, 3rd edition”, in accordance with ASHRAE psychrometric chart (see Figure 9). The studies carried out showed that, in the Bologna region specifically, the outdoor thermo-hygrometric conditions are favorable to the IT microclimate of the data center about 70% of the time with energy savings of approximately 2,000 megawatt-hours. Direct free cooling brought undeniable advantages in terms of energy efficiency but introduced a significant functional complication issue related to Tiers compliance. The Tier Standards do not reference direct free cooling or other economization systems as the Tier requirements apply regardless of the technology. Eventually, it was decided that the free cooling system had to be subordinated to IT equipment continuous operation and excluded every time there was a problem with the mechanical and electrical systems, in which case continued operations would be ensured by the chiller plant.
Eventually, it was decided that the free cooling system had to be subordinated to IT equipment continuous operation and excluded every time there was a problem with the mechanical and electrical systems, in which case Continous Cooling would be ensured by the chiller plant. The direct free cooling functional setting, with unchanneled hot air rejection that was dictated by the pre-existing architectural restrictions, dictated the room layout and drove the choice of Cold Aisle containment. The direct free-cooling system consists of N+1 CRACs placed along the perimeter of the room, blowing cool air into a 60-inch plenum created by the access floor. The same units manage the free-cooling system. Every machine is equipped with a dual feed electric entrance controlled by an ATS and connected to a dual water circuit through a series of automatic valves (see Figure 10).
Figure 10. CRACs are connected with a dual-feed electric entrance controlled by an ATS and connected to a dual water circuit.
Containing the Cold Aisles caused a behavioral response among the IT operators, who normally work in a cold environment. At UnipolSai’s data center, they feel hot air heat when entering the data center. Design return air temperatures in the circulation areas are 32–34°C (90-93°F), and design supply air temperatures are 24–26°C (75-79°F). It became necessary to start an informational campaign to prevent alarmism in connection with room temperatures in the areas outside the functional aisles (See Figures 11-13).
Figures 11-13. Pictures show underfloor piping, containers, and raised floor environment.
Prefabricated electric busbars placed on the floor at regular intervals provide power supply to the IT racks. This decision was made in collaboration with UnipolSai technicians who considered it the most flexible solution in terms of installation and power draw, both initially and to accommodate future changes (see Figure 14 and 15).
Figure 14. Electric busbar
Figure 15. Taps on the busbar allow great flexibility on the data center floor and feed servers on the white space floor below.
In addition, a labeling system involving univocal synthetic description (alphanumeric code) and color coding, which allows a quick visual identification any part of any system makes simplifies the process of testing, operating, and managing all building systems (see Figure 16 and 17).
Figure 16-17. UnipolSai benefits from a well-thought out labeling system, which simplifies many aspects of operations.
FINAL TESTING
Functional tests were carried out at nominal load with the support of electric heaters, distributed in a regular manner within the equipment rooms and connected to the infrastructure feeding the IT equipment (see Figure 18-19). Also, Uptime Institute observed technical and functional tests were as part of Tier IV Certification of Constructed Facility (TCCF). The results of all the tests were positive; final demonstrations are pending. The data center has received Uptime Institute Tier IV Certification of Design Documents and is in progress for Tier IV Certification of Constructed Facility.
Figure 18-19. Two views of the data center floor, including heaters, during final testing.
UnipolSai also adopted DCIM software that, if properly used, can represent the first step towards an effective organization of the maintenance process, essential for keeping a system efficient and operational, independently from its level of redundancy and sophistication.
Andrea Ambrosi
Andrea Ambrosi, is project manager, design team manager and site manager at Ariatta Ingegneria dei Sistemi Srl (Ariatta). He is responsible for the executive planning and management of operations of electrical power, control and supervision systems, safety, and security and fire detection systems to be installed in data centers. He has specific experience in Domotics and special systems for the high-tech residential sector. He has been an Accredited Tier Designer since 2013 and Accredited Tier Specialist since 2014.
Roberto Del Nero, is a project manager and design team manager at
Roberto Del Nero
Ariatta, where he is responsible for the executive planning and management of mechanical plants, control and supervision systems, fire systems, plumbing and drainage to be installed in data center. He has been LEED AP (Accredited Professional) since 2009, Accredited Tier Designer since 2013 and Accredited Tier Specialist since 2014.
Examining and Learning from Complex Systems Failures
/in Executive/by Kevin HeslinConventional wisdom blames “human error” for the majority of outages, but those failures are incorrectly attributed to front-line operator errors, rather than management mistakes
By Julian Kudritzki, with Anne Corning
Data centers, oil rigs, ships, power plants, and airplanes may seem like vastly different entities, but all are large and complex systems that can be subject to failures—sometimes catastrophic failure. Natural events like earthquakes or storms may initiate a complex system failure. But often blame is assigned to “human error”—front-line operator mistakes, which combine with a lack of appropriate procedures and resources or compromised structures that result from poor management decisions.
“Human error” is an insufficient and misleading term. The front-line operator’s presence at the site of the incident ascribes responsibility to the operator for failure to rescue the situation. But this masks the underlying causes of an incident. It is more helpful to consider the site of the incident as a spectacle of mismanagement.
Responsibility for an incident, in most cases, can be attributed to a senior management decision (e.g., design compromises, budget cuts, staff reductions, vendor selecting and resourcing) seemingly disconnected in time and space from the site of the incident. What decisions led to a situation where front line operators were unprepared or untrained to respond to an incident and mishandled it?
To safeguard against failures, standards and practices have evolved in many industries that encompass strict criteria and requirements for the design and operation of systems, often including inspection regimens and certifications. Compiled, codified, and enforced by agencies and entities in each industry, these programs and requirements help protect the service user from the bodily injuries or financial effects of failures and spur industries to maintain preparedness and best practices.
Twenty years of Uptime Institute research into the causes of data center incidents places predominant accountability for failures at the management level and finds only single-digit percentages of spontaneous equipment failure.
This fundamental and permanent truth compelled the Uptime Institute to step further into standards and certifications that were unique to the data center and IT industry. Uptime Institute undertook a collaborative approach with a variety of stakeholders to develop outcome-based criteria that would be lasting and developed by and for the industry. Uptime Institute¹s Certifications were conceived to evaluate, in an unbiased fashion, front-line operations within the context of management structure and organizational behaviors.
EXAMINING FAILURES
The sinking of the Titanic. The Deepwater Horizon oil spill. DC-10 air crashes in the 1970s. The failure of New Orleans’ levee system. The Three Mile Island nuclear release. The northeast (U.S.) blackout of 2003. Battery fires in Boeing 787s. The space shuttle Challenger disaster. Fukushima Daiichi nuclear disaster. The grounding of the Kulluk arctic drilling rig. These are a few of the most infamous, and in some cases tragic, engineering system failures in history. While the examples come from vastly different industries and each story unfolded in its own unique way, they all have something in common with each other—and with data centers. All exemplify highly complex systems operating in technologically sophisticated industries.
The hallmarks of so-called complex systems are “a large number of interacting components, emergent properties difficult to anticipate from the knowledge of single components, adaptability to absorb random disruptions, and highly vulnerable to widespread failure under adverse conditions (Dueñas-Osorio and Vemuru 2009).” Additionally, the components of complex systems typically interact in non-linear fashion, operating in large interconnected networks.
Large systems and the industries that use them have many safeguards against failure and multiple layers of protection and backup. Thus, when they fail it is due to much more than a single element or mistake.
It is a truism that complex systems tend to fail in complex ways. Looking at just a few examples from various industries, again and again we see that it was not a single factor but the compound effect of multiple factors that disrupted these sophisticated systems. Often referred to as “cascading failures,” complex system breakdowns usually begin when one component or element of the system fails, requiring nearby “nodes” (or other components in the system network) to take up the workload or service obligation of the failed component. If this increased load is too great, it can cause other nodes to overload and fail as well, creating a waterfall effect as every component failure increases the load on the other, already stressed components. The following transferable concept is drawn from the power industry:
Power transmission systems are heterogeneous networks of large numbers of components that interact in diverse ways. When component operating limits are exceeded, protection acts to disconnect the component and the component ”fails” in the sense of not being available… Components can also fail in the sense of misoperation or damage due to aging, fire, weather, poor maintenance, or incorrect design or operating settings…. The effects of the component failure can be local or can involve components far away, so that the loading of many other components throughout the network is increased… the flows all over the network change (Dobson, et al. 2009).
A component of the network can be mechanical, structural or human agent, as front-line operators respond to an emerging crisis. Just as engineering components can fail when overloaded, so can human effectiveness and decision-making capacity diminish under duress. A defining characteristic of a high risk organization is that it provides structure and guidance despite extenuating circumstances—duress is its standard operating condition.
The sinking of the Titanic is perhaps the most well-known complex system failure in history. This disaster was caused by the compound effect of structural issues, management decisions, and operating mistakes that led to the tragic loss of 1,495 lives. Just a few of the critical contributing factors include design compromises (e.g., reducing the height of the watertight bulkheads that allowed water to flow over the tops and limiting the number of lifeboats for aesthetic considerations), poor discretionary decisions (e.g., sailing at excessive speed on a moonless night despite reports of icebergs ahead), operator error (e.g., the lookout in the crow’s nest had no binoculars—a cabinet key had been left behind in Southampton), and misjudgment in the crisis response (e.g., the pilot tried to reverse thrust when the iceberg was spotted, instead of continuing at full speed and using the momentum of the ship to turn course and reduce impact). And, of course, there was the hubris of believing the ship was unsinkable.
Figure 1a. (Left) NTSB photo of the burned auxiliary power unit battery from a JAL Boeing 787 that caught fire on January 7, 2013 at Boston¹s Logan International Airport. Photo credit: By National Transportation Safety Board (NTSB) [Public domain], via Wikimedia Commons. Figure 1b. (Right) A side-by-side comparison of an original Boeing Dreamliner (787) battery compared and a damaged Japan Air Lines battery. Photo credit: By National Transportation Safety Board (NTSB) [Public domain], via Wikimedia Commons.
Looking at a more recent example, the issue of battery fires in Japan Airlines (JAL) Boeing 787s, which came to light in 2013 (see Figure 1), was ultimately blamed on a combination of design, engineering, and process management shortfalls (Gallagher 2014). Following its investigation, the U.S. National Transportation Safety Board reported (NTSB 2014):
• Manufacturer errors in design and quality control. The manufacturer failed to adequately account for the thermal runaway phenomenon: an initial overheating of the batteries triggered a chemical reaction that generated more heat, thus causing the batteries to explode or catch fire. Battery “manufacturing defects and lack of oversight in the cell manufacturing process” resulted in the development of lithium mineral deposits in the batteries. Called lithium dendrites, these deposits can cause a short circuit that reacts chemically with the battery cell, creating heat. Lithium dendrites occurred in wrinkles that were found in some of the battery electrolyte material, a manufacturing quality control issue.
• Shortfall in certification processes. The NTSB found shortcomings in U.S. Federal Aviation Administration (FAA) guidance and certification processes. Some important factors were overlooked that should have been considered during safety assessment of the batteries.
• Lack of contractor oversight and proper change orders. A cadre of contractors and subcontractors were involved in the manufacture of the 787’s electrical systems and battery components. Certain entities made changes to the specifications and instructions without proper approval or oversight. When the FAA performed an audit, it found that Boeing’s prime contractor wasn’t following battery component assembly and installation instructions and was mislabeling parts. A lack of “adherence to written procedures and communications” was cited.
How many of these circumstances parallel those that can happen during the construction and operation of a data center? It is all too common to find deviations from as-designed systems during the construction process, inconsistent quality control oversight, and the use of multiple subcontractors. Insourced and outsourced resources may disregard or hurry past written procedures, documentation, and communication protocols (search Avoiding Data Center Construction Problems @ journal.uptimeinstitute.com).
THE NATURE OF COMPLEX SYSTEM FAILURES
Large industrial and engineered systems are risky by their very nature. The greater the number of components and the higher the energy and heat levels, velocity, and size and weight of these components the greater the skill and teamwork required to plan, manage, and operate the systems safely. Between mechanical components and human actions, there are thousands of possible points where an error can occur and potentially trigger a chain of failures.
In his seminal article on the topic of complex system failure How Complex Systems Fail, first published in 1998 and still widely referenced today, Dr. Richard I. Cook identifies and discusses 18 core elements of failure in complex systems:
1. Complex systems are intrinsically hazardous systems.
2. Complex systems are heavily and successfully defended against failure.
3. Catastrophe requires multiple failures—single point failures are not enough.
4. Complex systems contain changing mixtures of failures latent within them.
5. Complex systems run in degraded mode.
6. Catastrophe is always just around the corner.
7. Post-accident attribution to a root cause is fundamentally wrong.
8. Hindsight biases post-accident assessments of human performance.
9. Human operators have dual roles: as producers and as defenders against failure.
10. All practitioner actions are gambles.
11. Actions at the sharp end resolve all ambiguity.
12. Human practitioners are the adaptable element of complex systems.
13. Human expertise in complex systems is constantly changing.
14. Change introduces new forms of failure.
15. Views of cause limit the effectiveness of defenses against future events.
16. Safety is a characteristic of systems and not of their components.
17. People continuously create safety.
18. Failure-free operations require experience with failure (Cook 1998).
Let’s examine some of these principles in the context of a data center. Certainly high-voltage electrical systems, large-scale mechanical and infrastructure components, high-pressure water piping, power generators, and other elements create hazards [Element 1] for both humans and mechanical systems/structures. Data center systems are defended from failure by a broad range of measures [Element 2], both technical (e.g., redundancy, alarms, and safety features of equipment) and human (e.g., knowledge, training, and procedures). Because of these multiple layers of protection, a catastrophic failure would require the breakdown of multiple systems or multiple individual points of failure [Element 3].
RUNNING NEAR CRITICAL FAILURE
Complex systems science suggests that most large-scale complex systems, even well-run ones, by their very nature are operating in “degraded mode” [Element 5], i.e., close to the critical failure point. This is due to the progression over time of various factors including steadily increasing load demand, engineering forces, and economic factors.
The enormous investments in data center and other highly available infrastructure systems perversely incents conditions of elevated risk and higher likelihood of failure. Maximizing capacity, increasing density, and hastening production from installed infrastructure improves the return on investment (ROI) on these major capital investments. Deferred maintenance, whether due to lack of budget or hands-off periods due to heightened production, further pushes equipment towards performance limits—the breaking point.
The increasing density of data center infrastructure exemplifies the dynamics that continually and inexorably push a system towards critical failure. Server density is driven by a mixture of engineering forces (advancements in server design and efficiency) and economic pressures (demand for more processing capacity without increasing facility footprint). Increased density then necessitates corresponding increases in the number of critical heating and cooling elements. Now the system is running at higher risk, with more components (each of which is subject to individual fault/failure), more power flowing through the facility, more heat generated, etc.
This development trajectory demonstrates just a few of the powerful “self-organizing” forces in any complex system. According to Dobson, et al (2009), “these forces drive the system to a dynamic equilibrium that keeps [it] near a certain pattern of operating margins relative to the load. Note that engineering improvements and load growth are driven by strong, underlying economic and societal forces that are not easily modified.”
Because of this dynamic mix of forces, the potential for a catastrophic outcome is inherent in the very nature of complex systems [Element 6]. For large-scale mission critical and business critical systems, the profound implication is that designers, system planners, and operators must acknowledge the potential for failure and build in safeguards.
WHY IS IT SO EASY TO BLAME HUMAN ERROR?
Human error is often cited as the root cause of many engineering system failures, yet it does not often cause a major disaster on its own. Based on analysis of 20 years of data center incidents, Uptime Institute holds that human error must signify management failure to drive change and improvement. Leadership decisions and priorities that result in a lack of adequate staffing and training, an organizational culture that becomes dominated by a fire drill mentality, or budget cutting that reduces preventive/proactive maintenance could result in cascading failures that truly flow from the top down.
Although front-line operator error may sometimes appear to cause an incident, a single mistake (just like a single data center component failure) is not often sufficient to bring down a large and robust complex system unless conditions are such that the system is already teetering on the edge of critical failure and has multiple underlying risk factors. For example, media reports after the 1983 Exxon Valdez oil spill zeroed in on the fact that the captain, Joseph Hazelwood, was not at the bridge at the time of the accident and accused him of drinking heavily that night. However, more measured assessments of the accident by the NTSB and others found that Exxon had consistently failed to supervise the captain or provide sufficient crew for necessary rest breaks (see Figure 2).
Figure 2. Shortly after leaving the Port of Valdez, the Exxon Valdez ran aground on Bligh Reef. The picture was taken three days after the vessel grounded, just before a storm arrived. Photo credit: Office of Response and Restoration, National Ocean Service, National Oceanic and Atmospheric Administration [Public domain], via Wikimedia Commons.
Perhaps even more critical was the lack of essential navigation systems: the tanker’s radar was not operational at time of the accident. Reports indicate that Exxon’s management had allowed the RAYCAS radar system to stay broken for an entire year before the vessel ran aground because it was expensive to operate. There was also inadequate disaster preparedness and an insufficient quantity of oil spill containment equipment in the region, despite the experiences of previous small oil spills. Four years before the accident, a letter written by Captain James Woodle, who at that time was the Exxon oil group¹s Valdez port commander, warned upper management, “Due to a reduction in manning, age of equipment, limited training and lack of personnel, serious doubt exists that [we] would be able to contain and clean-up effectively a medium or large size oil spill” (Palast 1999).
As Dr. Cook points out, post-accident attribution to a root cause is fundamentally wrong [Element 7]. Complete failure requires multiple faults, thus attribution of blame to a single isolated element is myopic and, arguably, scapegoating. Exxon blamed Captain Hazelwood for the accident, and his share of the blame obscures the underlying mismanagement that led to the failure. Inadequate enforcement by the U.S. Coast Guard and other regulatory agencies further contributed to the disaster.
Similarly, the grounding of the oil rig Kulluk was the direct result of a cascade of discrete failures, errors, and mishaps, but the disaster was first set in motion by Royal Dutch Shell’s executive decision to move the rig off of the Alaskan coastline to avoid tax liability, despite high risks (Lavelle 2014). As a result, the rig and its tow vessels undertook a challenging 1,700-nautical-mile journey across the icy and storm-tossed waters of the Gulf of Alaska in December 2012 (Funk 2014).
There had already been a chain of engineering and inspection compromises and shortfalls surrounding the Kulluk, including the installation of used and uncertified tow shackles, a rushed refurbishment of the tow vessel Discovery, and electrical system issues with the other tow vessel, the Aivik, which had not been reported to the Coast Guard as required. (Discovery experienced an exhaust system explosion and other mechanical issues in the following months. Ultimately the tow company—a contractor—was charged with a felony for multiple violations.)
This journey would be the Kulluk’s last, and it included a series of additional mistakes and mishaps. Gale-force winds put continual stress on the tow line and winches. The tow ship was captained on this trip by an inexperienced replacement, who seemingly mistook tow line tensile alarms (set to go off when tension exceeded 300 tons) for another alarm that was known to be falsely annunciating. At one point the Aivik, in attempting to circle back and attach a new tow line, was swamped by a wave, sending water into the fuel pumps (a problem that had previously been identified but not addressed), which caused the engines to begin to fail over the next several hours (see Figure 3).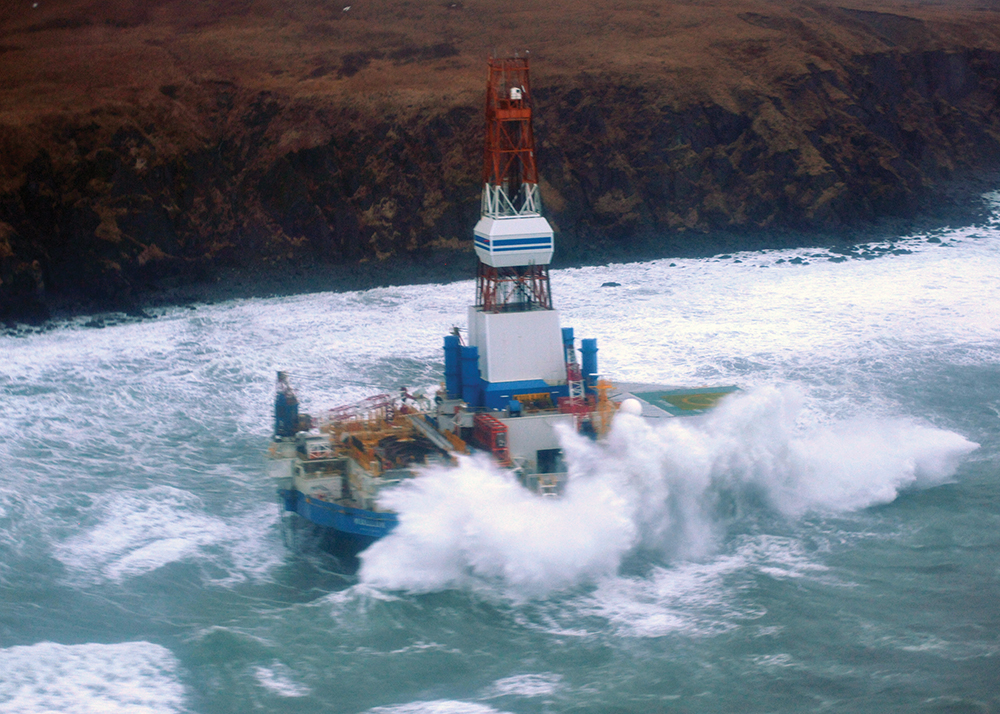
Waves crash over the mobile offshore drilling unit Kulluk where it sits aground on the southeast side of Sitkalidak Island, Alaska, Jan. 1, 2013. A Unified Command, consisting of the Coast Guard, federal, state, local and tribal partners and industry representatives was established in response to the grounding. U.S. Coast Guard photo by Petty Officer 3rd Class Jonathan Klingenberg.
Despite harrowing conditions, Coast Guard helicopters were eventually able to rescue the 18 crew members aboard the Kulluk. Valiant last-ditch tow attempts were made by the (repaired) Aivik and Coast Guard tugboat Alert, before the effort had to be abandoned and the oil rig was pushed aground by winds and currents.
Poor management decision making, lack of adherence to proper procedures and safety requirements, taking shortcuts in the repair of critical mechanical equipment, insufficient contractor oversight, lack of personnel training/experience all of these elements of complex system failure are readily seen as contributing factors in the Kulluk disaster.
EXAMINING DATA CENTER SYSTEM FAILURES
Two recent incidents demonstrate how the dynamics of complex systems failures can quickly play out in the data center environment.
Example A
Tier III Concurrent Maintenance data center criteria (see Uptime Institute Tier Standard: Topology) require multiple, diverse independent distribution paths serving all critical equipment to allow maintenance activity without impacting critical load. The data center in this example had been designed appropriately with fuel pumps and engine- generator controls powered from multiple circuit panels. As built, however, a single panel powered both, whether due to implementation oversight or cost reduction measures. At issue is not the installer, but rather the quality of communications from the implementation team and the operations team.
In the course of operations, technicians had to shut off utility power during the performance of routine maintenance to an electrical switchgear. This meant the building was running on engine-generator sets. However, when the engine-generator sets started to surge due to a clogged fuel line. The UPS automatically switched the facility to battery power. The day tanks for the engine-generator sets were starting to run dry. If quick-thinking operators had not discovered the fuel pump issue in time, there would have been an outage to the entire facility: a cascade of events leading down a rapid pathway from simple routine maintenance activity to complete system failure.
Example B
Tier IV Fault Tolerant data center criteria require the ability to detect and isolate a fault while maintaining capacity to handle critical load. In this example, a Tier IV enterprise data center shared space with corporate offices in the same building, with a single chilled water plant used to cool both sides of the building. The office air handling units also brought in outside air to reduce cooling costs.
One night, the site experienced particularly cold temperatures and the control system did not switch from outside air to chilled water for office building cooling, which affected data center cooling as well. The freeze stat (a temperature sensing device that monitors a heat exchanger to prevent its coils from freezing) failed to trip; thus the temperature continued to drop and the cooling coil froze and burst, leaking chilled water onto the floor of the data center. There was a limited leak detection system in place and connected, but it had not been fully tested yet. Chilled water continued to leak until pressure dropped and then the chilled water machines started to spin offline in response. Once the chilled water machines went offline neither the office building nor data center had active cooling.
At this point, despite the extreme outside cold, temperatures in the data hall rose through the night. As a result of the elevated indoor temperature conditions, the facility experienced myriad device-level (e.g., servers, disc drives, and fans) failures over the following several weeks. Though a critical shut down was not the issue, damage to components and systems—and the cost of cleanup and replacement parts and labor—were significant. One single initiating factor—a cold night—combined with other elements in a cascade of failures.
In both of these cases, severe disaster was averted, but relying on front-line operators to save the situation is neither robust not reliable.
PREVENTING FAILURES IN THE DATA CENTER
Organizations that adhere to the principles of Concurrent Maintainability and/or Fault Tolerance, as outlined in Tier Standard: Topology, take a vital first step toward reducing the risk of a data center failure or outage.
However, facility infrastructure is only one component of failure prevention; how a facility is run and operated on a day-to-day basis is equally critical. As Dr. Cook noted, humans have a dual role in complex systems as both the potential producers (causes) of failure as well as, simultaneously, some of the best defenders against failure [Element 9].
The fingerprints of human error can be seen on the two data center examples. In Example A, the electrical panel was not set up as originally designed, and the leak detection system, which could have alerted operators to the problem, had not been fully activated in Example B.
Dr. Cook also points out that human operators are the most adaptable component of complex systems [Element 12], as they “actively adapt the system to maximize production and minimize accidents.” For example, operators may “restructure the system to reduce exposure of vulnerable parts,” reorganize critical resources to focus on areas of high demand, provide “pathways for retreat or recovery,” and “establish means for early detection of changed system performance in order to allow graceful cutbacks in production or other means of increasing resiliency.” Given the highly dynamic nature of complex system environments, this human-driven adaptability is key.
STANDARDIZATION CAN ADDRESS MANAGEMENT SHORTFALLS
In most of the notable failures in recent decades, there was a breakdown or circumvention of established standards and certifications. It was not a lack of standards, but a lack of compliance or sloppiness that contributed the most to the disastrous outcomes. For example, in the case of the Boeing batteries, the causes were bad design, poor quality inspections, and lack of contractor oversight. In the case of the Exxon Valdez, inoperable navigation systems and inadequate crew manpower and oversight—along with insufficient disaster preparednesswere critical factors. If leadership, operators, and oversight agencies had adhered to their own policies and requirements and had not cut corners for economics or expediency, these disasters might have been avoided.
Ongoing operating and management practices and adherence to recognized standards and requirements, therefore, must be the focus of long-term risk mitigation. In fact, Dr. Cook states that “failure-free operations are the result of activities of people who work to keep the system within the boundaries of tolerable performance….human practitioner adaptations to changing conditions actually create safety from moment to moment” [Element 17]. This emphasis on human activities as decisive in preventing failures dovetails with Uptime Institute’s advocacy of operational excellence as set forth in the Tier Standard: Operational Sustainability. This was the data center industry¹s first standardization, developed by and for data centers, to address the management shortfalls that could unwind the most advanced, complex, and intelligent of solutions. Uptime Institute was compelled by its findings that the vast majority of data center incidents could be attributed to operations, despite advancements in technology, monitoring, and automation.
The Operational Sustainability criteria pinpoint the elements that impact long-term data center performance, encompassing site management and operating behaviors, and documentation and mitigation of site-specific risks. The detailed criteria include personnel qualifications and training and policies and procedures that support operating teams in effectively preventing failures and responding appropriately when small failures occur to avoid having them cascade into large critical failures. As Dr. Cook states, “Failure free operations require experience with failure” [Element 18]. We have the opportunity to learn from the experience of other industries, and, more importantly, from the data center industry¹s own experience, as collected and analyzed in Uptime Institute’s Abnormal Incident Reports database. Uptime Institute has captured and catalogued the lessons learned from more than 5,000 errors and incidents over the last 20 years and used that research knowledgebase to help develop an authoritative set of benchmarks. It has ratified these with leading industry experts and gained the consensus of global stakeholders from each sector of the industry. Uptime Institute’s Tier Certifications and Management & Operations (M&O) Stamp of Approval provide the most definitive guidelines for and verification of effective risk mitigation and operations management.
Dr. Cook explains, “More robust system performance is likely to arise in systems where operators can discern the edge of the envelope. It also depends on calibrating how their actions move system performance towards or away from the edge of the envelope. [Element 18]” Uptime Institute¹s deep subject matter expertise, long experience, and evidence-based standards can help data center operators identify and stay on the right side of that edge. Organizations like CenturyLink are recognizing the value of applying a consistent set of standards to ensure operational excellence and minimize the risk of failure in the complex systems represented by their data center portfolio (See the sidebar CenturyLink and the M&O Stamp of Approval).
CONCLUSION
Complex systems fail in complex ways, a reality exacerbated by the business need to operate complex systems on the very edge of failure. The highly dynamic environments of building and operating an airplane, ship, or oil rig share many traits with running a high availability data center. The risk tolerance for a data center is similarly very low, and data centers are susceptible to the heroics and missteps of many disciplines. The coalescing element is management, which makes sure that frontline operators are equipped with the hands, tools, parts, and processes they need, and, the unbiased oversight and certifications to identify risks and drive continuous improvement against the continuous exposure to complex failure.
REFERENCES
ASME (American Society of Mechanical Engineers). 2011. Initiative to Address Complex Systems Failure: Prevention and Mitigation of Consequences. Report prepared by Nexight Group for ASME (June). Silver Spring MD: Nexight Group. http://nexightgroup.com/wp-content/uploads/2013/02/initiative-to-address-complex-systems-failure.pdf
Bassett, Vicki. (1998). “Causes and effects of the rapid sinking of the Titanic,” working paper. Department of Mechanical Engineering, the University of Wisconsin. http://writing.engr.vt.edu/uer/bassett.html#authorinfo.
BBC News. 2015. “Safety worries lead US airline to ban battery shipments.” March 3, 2015. http://www.bbc.com/news/technology-31709198
Brown, Christopher and Matthew Mescal. 2014. View From the Field. Webinar presented by Uptime Institute, May 29, 2014. https://uptimeinstitute.com/research-publications/asset/webinar-recording-view-from-the-field
Cook, Richard I. 1998. “How Complex Systems Fail (Being a Short Treatise on the Nature of Failure; How Failure is Evaluated; How Failure is Attributed to Proximate Cause; and the Resulting New Understanding of Patient Safety).” Chicago, IL: Cognitive Technologies Laboratory, University of Chicago. Copyright 1998, 1999, 2000 by R.I. Cook, MD, for CtL. Revision D (00.04.21), http://web.mit.edu/2.75/resources/rando/How%20Complex%20Systems%20Fail.pdf
Dobson, Ian, Benjamin A. Carreras, Vickie E. Lynch and David E. Newman. 2009. “Complex systems analysis of a series of blackouts: Cascading failure, critical points, and self-organization.” Chaos: An Interdisciplinary Journal of Nonlinear Science 17: 026103 (published by the American Institute of Physics).
Dobson, Ian, Benjamin A. Carreras, Vickie E. Lynch and David E. Newman. 2009. “Complex systems analysis of a series of blackouts: Cascading failure, critical points, and self-organization.” Chaos: An Interdisciplinary Journal of Nonlinear Science 17: 026103 (published by the American Institute of Physics).
Dueñas-Osorio, Leonard and Srivishnu Mohan Vemuru. 2009. Abstract for “Cascading failures in complex infrastructure systems.” Structural Safety 31 (2): 157-167.
Funk, McKenzie. 2014. “The Wreck of the Kulluk.” New York Times Magazine December 30, 2014. http://www.nytimes.com/2015/01/04/magazine/the-wreck-of-the-kulluk.html?_r=0
Gallagher, Sean. 2014. “NTSB blames bad battery designand bad managementin Boeing 787 fires.” Ars Technica, December 2, 2014. http://arstechnica.com/information-technology/2014/12/ntsb-blames-bad-battery-design-and-bad-management-in-boeing-787-fires/
Glass, Robert, Walt Beyeler, Kevin Stamber, Laura Glass, Randall LaViolette, Stephen Contrad, Nancy Brodsky, Theresa Brown, Andy Scholand, and Mark Ehlen. 2005. Simulation and Analysis of Cascading Failure in Critical Infrastructure. Presentation (annotated version) Los Alamos National Laboratory, National Infrastructure Simulation and Analysis Center (Department of Homeland Security), and Sandia National Laboratories, July 2005..New Mexico: Sandia National Laboratories. http://www.sandia.gov/CasosEngineering/docs/Glass_annotatedpresentation.pdf
Kirby, R. Lee. 2012. “Reliability Centered Maintenance: A New Approach.” Mission Critical, June 12, 2012. http://www.missioncriticalmagazine.com/articles/84992-reliability-centered-maintenance–a-new-approach
Klesner, Keith. 2015. “Avoiding Data Center Construction Problems.” The The Uptime Institute Journal. 5: Spring 2014: 6-12. https://journal.uptimeinstitute.com/avoiding-data-center-construction-problems/
Lipsitz, Lewis A. 2012. “Understanding Health Care as a Complex System: The Foundation for Unintended Consequences.” Journal of the American Medical Association 308 (3): 243244. http://jama.jamanetwork.com/article.aspx?articleid=1217248
Lavelle, Marianne. 2014. “Coast Guard blames Shell risk taking in the wreck of the Kulluk.” National Geographic, April 4, 2014. http://news.nationalgeographic.com/news/energy/2014/04/140404-coast-guard-blames-shell-in-kulluk-rig-accident/
“Exxon Valdez Oil Spill.” New York Times. On NYTimes.com, last updated August 3, 2010. http://topics.nytimes.com/top/reference/timestopics/subjects/e/exxon_valdez_oil_spill_1989/index.html
NTSB (National Transportation Safety Board). 2014. “Auxiliary Power Unit Battery Fire Japan Airlines Boeing 787-8, JA829J.” Aircraft Incident Report released 11/21/14. Washington, DC: National Transportation Safety Board. http://www.ntsb.gov/Pages/..%5Cinvestigations%5CAccidentReports%5CPages%5CAIR1401.aspx
Palast, Greg. 1999. “Ten Years After But Who Was to Blame?” for Observer/Guardian UK, March 20, 1999. http://www.gregpalast.com/ten-years-after-but-who-was-to-blame/
Pederson, Brian. 2014. “Complex systems and critical missionstoday’s data center.” Lehigh Valley Business, November 14, 2014. http://www.lvb.com/article/20141114/CANUDIGIT/141119895/complex-systems-and-critical-missions–todays-data-center
Plsek, Paul. 2003. Complexity and the Adoption of Innovation in Healthcare. Presentation, Accelerating Quality Improvement in Health Care Strategies to Speed the Diffusion of Evidence-Based Innovations, conference in Washington, DC, January 27-28, 2003. Roswell, GA: Paul E Plsek & Associates, Inc. http://www.nihcm.org/pdf/Plsek.pdf
Reason, J. 2000. “Human Errors Models and Management.” British Medical Journal 320 (7237): 768770. http://www.ncbi.nlm.nih.gov/pmc/articles/PMC1117770/
Reuters. 2014. “Design flaws led to lithium-ion battery fires in Boeing 787: U.S. NTSB.” December 2, 2014. http://www.reuters.com/article/2014/12/02/us-boeing-787-batteryidUSKCN0JF35G20141202
Wikipedia, s.v. “Cascading Failure,” last modified April 12, 2015. https://en.wikipedia.org/wiki/Cascading_failure
Wikipedia, s.v. “The Sinking of The Titanic,” last modified July 21, 2015. https://en.wikipedia.org/wiki/Sinking_of_the_RMS_Titanic
Wikipedia, s.v. “SOLAS Convention,” last modified June 21, 2015. https://en.wikipedia.org/wiki/SOLAS_Convention
John Maclean, author of numerous books, including Fire on the Mountain (Morrow 1999), analyzing deadly wildland fires, suggests rebranding of high reliability organizations, which is a fundamental concept of firefighting crews, military, and commercial airline industry. He argued for high risk organizations. A high reliability organization may only fail, like a goalkeeper, as performance is so highly anticipated. A high risk organization is tasked with averting or minimizing impact and may gauge success in a non-binary fashion. It is a recurring theme in Mr. Maclean’s forensic analyses of deadly fires that front-line operators, including the perished, carry the blame for the outcome and management shortfalls are far less exposed.
CENTURYLINK AND THE M&O STAMP OF APPROVAL
The IT industry has growing awareness of the importance of management-people-process issues. That’s why Uptime Institute¹s Management & Operations (M&0) Stamp of Approval focuses on assessing and evaluating both operations activities and management as equally critical to ensuring data center reliability and performance. The M&O Stamp can be applied to a single data center facility, or administered across an entire portfolio to ensure consistency.
Recognizing the necessity of making a commitment to excellence at all levels of an organization, CenturyLink is the first service provider to embrace the M&O assesment for all of its data centers. It has contracted Uptime Institute to assess 57 data center facilities across a global portfolio. This decision shows the company is willing to hold itself to a uniform set of high standards and operate with transparency. The company has committed to achieve M&O Stamp of Approval standards and certification across the board, protecting its vital networks and assets from failure and downtime and providing its customers with assurance.
Julian Kudritzki
Julian Kudritzki joined Uptime Institute in 2004 and currently serves as Chief Operating Officer. He is responsible for the global proliferation of Uptime Institute standards. He has supported the founding of Uptime Institute offices in numerous regions, including Brasil, Russia, and North Asia. He has collaborated on the development of numerous Uptime Institute publications, education programs, and unique initiatives such as Server Roundup and FORCSS. He is based in Seattle, WA.
Anne Corning
Anne Corning is a technical and business writer with more than 20 years experience in the high tech, healthcare, and engineering fields. She earned her B.A. from the University of Chicago and her M.B.A. from the University of Washington’s Foster School of Business. She has provided marketing, research, and writing for organizations such as Microsoft, Skanska USA Mission Critical, McKesson, Jetstream Software, Hitachi Consulting, Seattle Children’s Hospital Center for Clinical Research, Adaptive Energy, Thinking Machines Corporation (now part of Oracle), BlueCross BlueShield of Massachusetts, and the University of Washington Institute for Translational Health Sciences. She has been a part of several successful entrepreneurial ventures and is a Six Sigma Green Belt.
—-
IT Chargeback Drives Efficiency
/in Executive/by Kevin HeslinAllocating IT costs to internal customers improves accountability, cuts waste
By Scott Killian
You’ve heard the complaints many times before: IT costs too much. I have no idea what I’m paying for. I can’t accurately budget for IT costs. I can do better getting IT services myself.
The problem is that end-user departments and organizations can sometimes see IT operations as just a black box. In recent years, IT chargeback systems have attracted more interest as a way to address all those concerns and rising energy use and costs. In fact, IT chargeback can be a cornerstone of practical, enterprise-wide efficiency efforts.
IT chargeback is a method of charging internal consumers (e.g., departments, functional units) for the IT services they used. Instead of bundling all IT costs under the IT department, a chargeback program allocates the various costs of delivering IT (e.g., services, hardware, software, maintenance) to the business units that consume them.
Many organizations already use some form of IT chargeback, but many don’t, instead treating IT as corporate overhead. Resistance to IT chargeback often comes from the perception that it requires too much effort. It’s true that time, administrative cost, and organizational maturity is needed to implement chargeback.
However, the increased adoption of private and public cloud computing is causing organizations to re-evaluate and reconsider IT chargeback methods. Cloud computing has led some enterprises to ask their IT organizations to explain their internal costs. Cloud options can shave a substantial amount from IT budgets, which pressures IT organizations to improve cost modeling to either fend off or justify a cloud transition. In some cases, IT is now viewed as more of a commodity—with market competition. In these circumstances, accountability and efficiency improvements can bring significant cost savings that make chargeback a more attractive path.
CHARGEBACK vs. UNATTRIBUTED ACCOUNTING
All costs are centralized in traditional IT accounting. One central department pays for all IT equipment and activities, typically out of the CTO or CIO’s budget, and these costs are treated as corporate overhead shared evenly by multiple departments. In an IT chargeback accounting model, individual cost centers are charged for their IT service based on use and activity. As a result, all IT costs are “zeroed out” because they have all been assigned to user groups. IT is no longer considered overhead, instead it can be viewed as part of each department’s business and operating expenses (OpEx).
With the adoption of IT chargeback, an organization can expect to see significant shifts in awareness, culture, and accountability, including:
• Increased transparency due to accurate allocation of IT costs and usage. Chargeback allows consumers to see their costs and understand how those costs are determined.
• Improved IT financial management, as groups become more aware of the cost of their IT usage and business choices. With chargeback, consumers become more interested and invested in the costs of delivering IT as a service.
• Increased awareness of how IT contributes to the business of the organization. IT is not just overhead but is seen as providing real business value.
• Responsibility for controlling IT costs shifts to business units, which become accountable for their own use.
• Alignment of IT operations and expenditures with the business. IT is no longer just an island of overhead costs but becomes integrated into business planning, strategy, and operations.
The benefits of an IT chargeback model included simplified IT investment decision making, reduced resource consumption, improved relationships between business units and IT, and greater perception of IT value. Holding departments accountable leads them to modify their behaviors and improve efficiency. For example, chargeback tends to reduce overall resource consumption as business units stop hoarding surplus servers or other resources to avoid the cost of maintaining these underutilized assets. At the same time, organizations experience increased internal customer satisfaction as IT and the business units become more closely aligned and begin working together to analyze and improve efficiency.
Perhaps most importantly, IT chargeback drives cost control. As users become aware of the direct costs of their activities, they become more willing to improve their utilization, optimize their software and activities, and analyze cost data to make better spending decisions. This can extend the life of existing resources and infrastructure, defer resource upgrades, and identify underutilized resources that can be deployed more efficiently. Just as we have seen in organizations that adopt a server decommissioning program (such as the successful initiatives of Uptime Institute’s Server Roundup) (https://uptimeinstitute.com/training-events/server-roundup), IT chargeback identifies underutilized assets that can be reassigned or decommissioned. As a result, more space and power becomes available to other equipment and services, thus extending the life of existing infrastructure. An organization doesn’t have to build new infrastructure if it can get more from current equipment and systems.
IT chargeback also allows organizations to make fully informed decisions about outsourcing. Chargeback provides useful metrics that can be compared against cloud providers and other outsource IT options. As IT organizations are being driven to emulate cloud provider services, a chargeback applies free-market principles to IT (with appropriate governance and controls). The IT group becomes more akin to a service provider, tracking and reporting the same metrics on a more apples-to-apples basis.
Showback is closely related to chargeback and offers many of the same advantages without some of the drawbacks. This strategy employs the same approach as chargeback, with tracking and cost-center allocation of IT expenses. Showback measures and displays the IT cost breakdown by consumer unit just as chargeback does, but without actually transferring costs back. Costs remain in the IT group, but information is still transparent about consumer utilization. Showback can be easy to implement since there is no immediate budgetary impact on user groups.
The premise behind showback and chargeback is the same: awareness drives accountability. However, since business units know they will not be charged in a showback system, their attention to efficiency and improving utilization may not be as focused. Many organizations have found that starting with a showback approach for an initial 3-6 months is an effective way to introduce chargeback, testing the methodology and metrics and allowing consumer groups to get used to the approach before full implementation of chargeback accountability.
The stakeholders affected by chargeback/showback include:
• Consumers: Business units that consume IT resources, e.g., organizational entities, departments, applications, and end users.
• Internal service providers: Groups responsible for providing IT services, e.g., data center teams, network teams, and storage.
• Project sponsor: The group funding the effort and ultimately responsible for its success. Often this is someone under the CTO or can also be a finance/accounting leader.
• Executive team: The C-suite individuals responsible for setting chargeback as an organizational priority and ensuring enterprise-wide participation to bring it to fruition.
• Administrator: The group responsible for operating the chargeback program (e.g., IT finance and accounting).
CHARGEBACK METHODS
A range of approaches have been developed for implementing chargeback in an organization, as summarized in Figure 1. The degree of complexity, degree of difficulty, and cost to implement decreases from the top of the chart [service-based pricing (SBP)], to the bottom [high-level allocation (HLA)]. HLA is the simplest method; it uses a straight division of IT costs based on a generic metric such as headcount. Slightly more effort to implement is low-level allocation (LLA), which bases consumer costs on something more related to IT activity such as the number of users or servers. Direct cost (DC) more closely resembles a time and materials charge but is often tied to headcount as well.
Figure 1. Methods for chargeback allocation.
Measured resource usage (MRU) focuses on the amount of actual resource usage of each department, using metrics such as power (in kilowatts), network bandwidth and terabytes of storage. Tiered flat rate (TFR), negotiated flat rate (NFR), and service based pricing (SBP) are all increasingly sophisticated applications of measuring actual usage by service.
THE CHARGEBACK SWEET SPOT
Measured resource usage (MRU) is often the sweet spot for chargeback implementation. It makes use of readily available data that are likely already known or collected. For example, data center teams typically measure power consumption at the server level, and storage groups know how many terabytes are being used by different users/departments. MRU is a straight allocation of IT costs, thus it is fairly intuitive for consumer organizations to accept. It is not quite as simple as other methods to implement but does provide fairness and is easily controllable.
MRU treats IT services as a utility, consumed and reserved based on key activities:
• Data center = power
• Network = bandwidth
• Storage = bytes
• Cloud =virtual machines or other metric
• Network Operations Center = ticket count or total time to resolve per customer
PREPARING FOR CHARGEBACK IMPLEMENTATION
If an organization is to successfully implement chargeback, it must choose the method that best fits its objectives and apply the method with rigor and consistency. Executive buy-in is critical. Without top-down leadership, chargeback initiatives often fail to take hold. It is human nature to resist accountability and extra effort, so leadership is needed to ensure that chargeback becomes an integral part of the business operations.
To start, it’s important that an organization know the infrastructure capital expense (CapEx) and OpEx costs. Measuring, tracking, reporting, and questioning these costs, and acting on the information to base investment and operating decisions on real costs is critical to becoming an efficient IT organization. To understand CapEx costs, organizations should consider the following:
• Facility construction or acquisition
• Power and cooling infrastructure equipment: new, replacement, or upgrades
• IT hardware: server, network, and storage hardware
• Software licenses, including operating system and application software
• Racks, cables: initial costs (i.e., items installed in the initial set up of the data room)
OpEx incorporates all the ongoing costs of running an IT facility. They are ultimately larger than CapEx in the long run, and include:
• FTE/payroll
• Utility expenses
• Critical facility maintenance (e.g., critical power and cooling, fire and life safety, fuel systems)
• Housekeeping and grounds (e.g., cleaning, landscaping, snow removal)
• Disposal/recycling
• Lease expenses
• Hardware maintenance
• Other facility fees such as insurance, legal, and accounting fees
• Office charges (e.g., telephones, PCs, office supplies)
• Depreciation of facility assets
• General building maintenance (e.g., office area, roof, plumbing)
• Network expenses (in some circumstances)
The first three items (FTE/payroll, utilities, and critical facility maintenance) typically make up the largest portion of these costs. For example, utilities can account for a significant portion of the IT budget. If IT is operated in a colocation environment, the biggest costs could be lease expenses. The charges from a colocation provider typically will include all the other costs, often negotiated. For enterprise-owned data centers, all these OpEx categories can fluctuate monthly depending on activities, seasonality, maintenance schedules, etc. Organizations can still budget and plan for OpEx effectively, but it takes an awareness of fluctuations and expense patterns.
At a fundamental level, the goal is to identify resource consumption by consumer, for example the actual kilowatts per department. More sophisticated resource metrics might include the cost of hardware installation (moves, adds, changes) or the cost per maintenance ticket. For example, in the healthcare industry, applications for managing patient medical data are typically large and energy intensive. If 50% of a facility’s servers are used for managing patient medical data, the company could determine the kilowatt per server and multiply total OpEx by the percentage of total IT critical power used for this activity as a way to allocate costs. If 50% of its servers are only using 30% of the total IT critical load, then it could use 30% to determine the allocation of data center operating costs. The closer the data can get to representing actual IT usage, the better.
An organization that can compile this type of data for about 95% of its IT costs will usually find it sufficient for implementing a very effective chargeback program. It isn’t necessary for every dollar to be accounted for. Expense allocations will be closely proportional based on actual consumption of kilowatts and/or bandwidth consumed and reserved by each user organization. Excess resources typically are absorbed proportionally by all. Even IT staff costs can be allocated by tracking and charging their activity to different customers using timesheets or by headcount where staff is dedicated to specific customers.
Another step in preparing an organization to adopt an IT chargeback methodology is defining service levels. What’s key is setting expectations appropriately so that end users, just like customers, know what they are getting for what they are paying. Defining uptime (e.g., Tier level such as Tier III Concurrent Maintainability or Tier IV Fault Tolerant infrastructure or other uptime and/or downtime requirements, if any), and outlining a detailed service catalog are important.
IT CHARGEBACK DRIVES EFFICIENT IT
Adopting an IT chargeback model may sound daunting, and doing so does take some organizational commitment and resources, but the results are worthwhile. Organizations that have implemented IT chargeback have experienced reductions in resource consumption due to increased customer accountability, and higher, more efficient utilization of hardware, space, power, and cooling due to reduction in servers. IT chargeback brings a new, enterprise-wide focus on lowering data center infrastructure costs with diverse teams working together from the same transparent data to achieve common goals, now possible because everyone has “skin in the game.”
Essentially, achieving efficient IT outcomes demands a “follow the money” mindset. IT chargeback drives a holistic approach in which optimizing data center and IT resource consumption becomes the norm. A chargeback model also helps to propel organizational maturity, as it drives the need for more automation and integrated monitoring, for example the use of a DCIM system. To collect data and track resources and key performance indicators manually is too tedious and time consuming, so stakeholders have an incentive to improve automated tracking, which ultimately improves overall business performance and effectiveness.
IT chargeback is more than just an accounting methodology; it helps drive the process of optimizing business operations and efficiency, improving competitiveness and adding real value to support the enterprise mission.
IT CHARGEBACK DOs AND DON’Ts
19 May 2015, Uptime Institute gathered a group of senior stakeholders for the Executive Assembly for Efficient IT. The group was composed of leaders from large financial, healthcare, retail and Web-scale IT organizations and the purpose of the meeting was to share experiences, success stories and challenges to improving IT efficiency.
At Uptime Institute’s 2015 Symposium, executives from leading data center organizations that have implemented IT chargeback discussed the positive results they had achieved. They also shared the following recommendations for companies considering adopting an IT chargeback methodology.
DO:
• Partner with the Finance department. Finance has to completely buy in to implementing chargeback.
• Inventory assets and determine who is using them. A complete inventory of the number of data centers, number of servers, etc., is needed to develop a clear picture of what is being used.
• Chargeback needs strong senior-level support; it will not succeed as a bottom-up initiative. Similarly don’t try to implement it from the field. Insist that C-suite representatives (COO/CFO) visit the data center so the C-suite understands the concept and requirements.
• Focus on cash management as the goal, not finance issues (e.g., depreciation) or IT equipment (e.g., server models and UPS equipment specifications). Know the audience, and get everyone on the same page talking about straight dollars and cents.
• Don’t give teams too much budget—ratchet it down. Make departments have to make trade-offs so they begin to make smarter decisions.
• Build a dedicated team to develop the chargeback model. Then show people the steps and help them understand the decision process.
• Data is critical: show all the data, including data from the configuration management data base (CMDB), in monthly discussions.
• Be transparent to show and add credibility. For example, explain clearly, “Here’s where we are and here’s where we are trying to get to.”
• Above all, communicate. People will need time to get used to the idea.
DON’TS:
• Don’t try to drive chargeback from the bottom up.
• Simpler is better: don’t overcomplicate the model. Simplify the rules and prioritize; don’t get hung up perfecting every detail because it doesn’t save much money. Approximations can be sufficient.
• Don’t move too quickly: start with showback. Test it out first; then, move to chargeback.
• To get a real return, get rid of the old hardware. Move quickly to remove old hardware when new items are purchased. The efficiency gains are worth it.
• The most challenging roadblocks can turn out to be the business units themselves. Organizational changes might need to go the second level within the business unit if it has functions and layers under them that should be separate.
Scott Killian
Scott Killian joined the Uptime Institute in 2014 and currently serves as VP for Efficient IT Program. He surveys the industry for current practices and develops new products to facilitate industry adoption of best practices. Mr. Killian directly delivers consulting at the site management, reporting, and governance levels. He is based in Virginia.
Prior to joining Uptime Institute, Mr. Killian led AOL’s holistic resource consumption initiative, which resulted in AOL winning two Uptime Institute Server Roundups for decommissioning more than 18,000 servers and reducing operating expenses more than US$6 million. In addition, AOL received three awards in the Green Enterprise IT (GEIT) program. AOL accomplished all this in the context of a five-year plan developed by Mr. Killian to optimize data center resources, which saved US$17 million annually.
Australian Colo Provider Achieves High Reliability Using Innovative Techniques
/in Design/by Kevin HeslinNEXTDC deploys new isolated parallel diesel rotary uninterruptible power supply systems and other innovative technologies
By Jeffrey Van Zetten
NEXTDC’s colocation data centers in Australia incorporate innovation in engineering design, equipment selection, commissioning, testing, and operation. This quality-first philosophy saw NEXTDC become one of 15 organizations globally to win a 2015 Brill Award for Efficient IT. NEXTDC’s B1 Brisbane, M1 Melbourne, S1 Sydney, C1 Canberra, and P1 Perth data centers (see Figure 1-3), have a combined 40-megawatt (MW) IT load (see Figure 4).
Figure 1. Exterior of NEXTDC’s 11.5-MW S1 Sydney data center, which is Uptime Institute Tier III Design Documents and Constructed Facility Certified
Figure 2. Exterior of NEXTDC’s 5.5-MW P1 Perth data center, which is Uptime Institute Tier III Design Documents and Constructed Facility Certified
Figure 3. Exterior of NEXTDC’s 12-MW M1 Melbourne data center, which is Uptime Institute Tier III Design Documents Certified
Figure 4. NEXTDC’s current footprint: 40+ MW IT capacity distributed across Australia
In order to accomplish the business goals NEXTDC established, it set the following priorities:
1. High reliability, so that clients can trust NEXTDC facilities with their mission critical IT equipment
2. The most energy-efficient design possible, especially where it can also assist reliability and total cost of ownerships, but not at the detriment of high reliability
3. Efficient total cost of ownership and day one CapEx by utilizing innovative design and technology
4. Capital efficiency and scalability to allow flexible growth and cash flow according to demand
5. Speed to market, as NEXTDC was committed to build and open five facilities within just a few years using a small team across the entire 5,000-kilometer-wide continent, to be the first truly national carrier-neutral colocation provider in
the Australian market
6. Flexible design suitable for the different regions and climates of Australia ranging
from subtropical to near desert.
NEXTDC put key engineering design decisions for these facilities through rigorous engineering decision matrices that weighed and scored the risks, reliability, efficiency, maintenance, total cost of ownership, day one CapEx, full final day CapEx, scalability, vendor local after-sales support, delivery, and references. The company extensively examined all the possible alternative designs to obtain accurate costing and modeling. NEXTDC Engineering and management worked closely to ensure the design would be in accord with the driving brief and the mandate on which the company is based.
NEXTDC also carefully selected the technology providers, manufacturers, and contractors for its projects. This scrutiny was critical, as the quality of local support in Australia can vary from city to city and region to region. NEXTDC paid as much attention to the track record of after-sales service teams as to the initial service or technology.
“Many companies promote innovative technologies; however, we were particularly interested in the after-sales support and the track record of the people who would support the technology,” said Mr. Van Zetten. “We needed to know if they were a stable and reliable team and had in-built resilience and reliability, not only in their equipment, but in their personnel.” NEXTDC’s Perth and Sydney data centers successfully achieved Uptime Institute Tier III Certification of Design Documents (TCDD) and Tier III Certification of Constructed Facilities (TCCF) using Piller’s isolated parallel (IP) diesel rotary uninterruptible power supply (DRUPS) system. A very thorough and exhaustive engineering analysis was performed on all electrical system design options and manufacturers available, including static uninterruptible power supply (UPS) designs with distributed redundant and block redundant distribution, along with the more innovative options such as the IP DRUPS solution. Final scale and capacity was a key design input for making the final decision, and indeed for smaller scale data centers a more traditional static UPS design is still favored by NEXTDC. For facilities larger than 5 MW, the IP DRUPS allows NEXTDC to:
• Eliminate batteries, which fail after 5 to 7 years, causing downtime and loss of redundancy and can cause
hydrogen explosions
• Eliminate the risks of switching procedures, as human error causes most failures
• Maintain power to both A & B supplies without switching even if more than one engine-generator set or UPS is
out of service
• Eliminate problematic static switches.
NEXTDC benefits because:
• If a transformer fails, only the related DRUPS engine generator needs to start. The other units in parallel can all remain on mains [editor’s note: incoming utility] power.
• Electrically decoupled cabinet rotary UPS are easier to maintain, providing less down time and more long-term reliability, which reduces the total cost of ownership.
• The N+1 IP DRUPS maintain higher loaded UPS/engine generators to reduce risk of cylinder glazing/damage at low and growing loads.
• Four levels of independently witnessed, loaded integrated systems testing were applied to verify the performance.
• The IP topology shares the +1 UPS capacity across the facility and enables fewer UPS to run at higher loads for better efficiency.
• The rotary UPSs utilize magnetic-bearing helium-gas enclosures for low friction optimal efficiency.
• The IP allows scalable installation of engine generators and UPS.
For example, the 11.5-MW S1 Sydney data center is based on 12+1 1,336-kilowatt (kW) continuous-rated Piller DRUPS with 12+1 IP power distribution boards. The facility includes sectionalized fire-segregated IP and main switchboard rooms. This design ensures that a failure of any one DRUPS, IP, or main switchboard does not cause a data center failure. The return ring IP bus is also fire segregated.
Figure 5. Scalable IP overall concept design
Differential protection also provides a level of Fault Tolerance. Because the design is scalable, NEXTDC is now increasing the system to a 14+1 DRUPS and IP design to increase the final design capacity from 11.5 to 13.8 MW of IT load to meet rapid growth. All NEXTDC stakeholders, especially those with significant operational experience, were particularly keen to eliminate the risks associated with batteries, static switches, and complex facilities management switching procedures. The IP solution successfully eliminated these risks with additional benefits for CapEx and OpEx efficiency. From a CapEx perspective, the design allows a common set of N+1 DRUPS units to be deployed based on actual IT load for the entire facility (see Figure 5). From an OpEx perspective, the advantage is the design is always able to operate in a N+1 configuration across the entire facility to match actual IT load, so the load is maintained at a higher percentage and thus at efficiencies approaching 98%, whereas low loaded UPS in a distributed redundant design, for example, can often have actual efficiencies of less than 95%. Operating engine-generator sets at higher loads also reduces the risks of engine cylinder glazing and damage, further reducing risks and maintenance costs (see Figure 6).
Figure 6. Distribution of the +1 IP DRUPS across more units provides higher load and thus efficiency
NEXTDC repeated integrated systems tests four times. Testing, commissioning, and tuning are the keys to delivering a successful project. Each set of tests—by the subcontractors, NEXTDC Engineering, independent commissioning agent engineers, and those required for Uptime Institute TCCF—helped to identify potential improvements, which were immediately implemented (see Figure 7). In particular, the TCCF review identified some improvements that NEXTDC could make to Piller’s software logic so that the control became truly distributed, redundant, and Concurrently Maintainable. This improvement ensured that even the complete failure of any panel in the entire system would not cause loss of N IP and main switchboards, even if the number of DRUPS is fewer than the number of IP main switchboards installed. This change improves CapEx efficiency without adding risks. The few skeptics we had regarding Uptime Institute Tier Certification became believers once they saw the professionalism, thoroughness, and helpfulness of Uptime Institute professionals on site.
Figure 7. Concurrently maintainable electrical design utilized in NEXTDC’s facilities
From an operational perspective, NEXTDC found that eliminating static switches and complex switching procedures for the facilities managers also reduced risk and delivered optimal uptime in reality.
MECHANICAL SYSTEMS
The mechanical system designs and equipment were also run through equally rigorous engineering decision matrices, which assessed the overall concept designs and supported the careful selection of individual valves, testing, and commissioning equipment. For example, the final design of the S1 facility includes 5+1 2,700-kW (cooling), high-efficiency, water-cooled, magnetic oil-free bearing, multi-compressor chillers in an N+1 configuration and received Uptime Institute Tier III Design Documents and Constructed Facility Certifications. The chillers are supplemented by both water-side and air-side free-cooling economization with Cold Aisle containment and electronically commutable (EC) variable-speed CRAC fans. Primary/secondary pump configurations are utilized, although, a degree of primary variable flow control is implemented for significant additional energy savings. Furthermore, NEXTDC implemented extreme oversight on testing and commissioning and continues to work with the facilities management teams to carefully tune and optimize the systems. This reduces not only energy use but also wear on critical equipment, extending equipment life, reducing maintenance, and increasing long-term reliability. The entire mechanical plant is supported by the IP DRUPS for continuously available compressor cooling even in the event of a mains power outage. This eliminates the risks associated with buffer tanks and chiller/compressor restarts that occur on most conventional static-UPS-supported data centers and is a common cause of facility outage.
Figure 8. Multi-magnetic bearing, oil-free, low-friction compressor chillers
Figure 8b
The central cooling plant achieved its overall goals because of the following additional key design decisions:
• Turbocor magnetic oil-free bearing, low-friction compressors developed in Australia provide both reliability and efficiency (see Figure 8).
• Multi-compressor chillers provide redundancy within the chillers and
improved part load operation.
• Single compressors can be replaced while the chiller keeps running.
• N+1 chillers are utilized to increase thermal transfer area for better part-load coefficient of performance
(COP) and Fault Tolerance, as the +1 chiller is already on-line and operating should one chiller fail.
• Variable-speed drive, magnetic-bearing, super-low-friction chillers provide leading COPs.
• Variable number of compressors can optimize COPs.
• Seasonal chilled water temperature reset enables even higher COPs and greater free economization in winter.
• Every CRAC is fitted with innovative pressure-independent self-balancing characterized control valves
(PICCV) to ensure no part of system is starved of chilled water with scalable dynamic staged expansions, and also ensure minimal flow per IT power to minimize pumping energy.
• Variable speed drives (VSDs) are installed on all pumps for less wear and reduced failure.
• 100% testing, tuning, commissioning and independent witnessing of all circuits, and minimization of pump
∆P for reduced wear.
• High ∆T and return water temperatures optimize water-side free cooling.
• High ∆T optimizes seasonal water reset free-cooling economization.
The cooling systems utilize evaporative cooling, which takes advantage of Australia’s climate, with return water precooling heat exchangers that remove load from the chiller compressors for more efficient overall plant performance. The implementation of the water-side and air-side free economization systems is a key to the design.
Very early smoke detection apparatus (VESDA) air-quality automatic damper shutdown is designed and tested along the facility’s entire façade. Practical live witness testing was performed with smoke bombs directed at the façade intakes and utilized a crane to simulate the worst possible case bush-fire event, with a sudden change of wind direction to ensure that false discharges of the gas suppression could be mitigated.
The free-cooling economization systems provide the following benefits to reliability and efficiency (see Figures 9-12):
• Two additional cooling methods provide backup in addition to chillers for most of the year
• Reduced running time on chillers and pumps extend the life and reduce failure and maintenance.
• The design is flexible to use either water side or air side depending on geographic locations and outside air quality.
• Actual results have proven a reduced total cooling plant energy.
• Reduced loads on chillers provide even better chiller COPs at partial loads.
• Reduced pump energy is achieved when air-side economization is utilized.
Figure 9. (Top Left) Water-side free-cooling economization design principle. Note: not all equipment shown for simplicity
Figure 10. (Top Right) Water-side free-cooling economization design principle
Figure 11a-d. Air-side free-cooling economization design principle
Figure 11b
Figure 11c
Figure 11d
Figure 12. Air-side free-cooling economization actual results
WHITE SPACE
NEXTDC’s designer consultants specified raised floor in the first two data rooms in the company’s M1 Melbourne facility (the company’s first builds) as a means of supplying cold air to the IT gear. A Hot Aisle containment system prevents intermixing and returns hot air to the CRACs via chimneys and an overhead return hot air plenum and back to the CRACs. This system minimizes fan speeds, reducing wear and maintenance. Containment also makes it simpler to run the correct number of redundant fans, which provides a high level of redundancy, and due to fan laws, reduces fan wear and maintenance. At NEXTDC, containment means higher return air temperatures, which enables more air-side economization and energy efficiency and an innovative, in-house floor grille management tool that minimizes fan energy according to IT load (see Figure 13). For all later builds, however, NEXTDC chose Cold Aisle containment to eliminate the labor costs and time to build overhead plenum and chimneys for the Hot Aisle containment system, which reduced payback and return on investment. NEXTDC now specifies Cold Aisle containment in all its data centers.
Figure 13. Cold Aisle containment is mandated design for all new NEXTDC facilities to minimize CRAC fan energy
The common-sense implementation of containment has proved to be worthwhile and enabled genuine energy savings. Operational experience suggested that containment alone saves only a part of the total possible energy savings. To capture even more savings, NEXTDC Engineering developed a program that utilizes the actual contracted loads and data from PDU branch circuit monitoring to automatically calculate the ideal floor grille balance for each rack. This intelligent system tuning saved an additional 60% from NEXTDC’s CRAC fan power by increasing air-side ∆T and reducing airflow rates (see Figure 14).
Figure 14. Innovative floor grille tuning methods applied in conjunction with containment yielded significant savings
NEXTDC also learned not to expect mechanical subcontractors to have long-term operational expenses and energy bills as their primary concern. NEXTDC installed pressure/temperature test points across all strainers and equipment and specified that all strainers had to be cleaned prior to commissioning. During the second round of tests, NEXTDC Engineering found that secondary pump differential pressures and energy were almost double what they theoretically should be. Using its own testing instruments, NEXTDC Engineering determined that some critical strainers on the index circuit had in fact been dirtied with construction debris—the contractors had simply increased the system differential pressure setting to deliver the correct flow rates and specified capacity. After cleaning the relevant equipment, the secondary pump energy was almost halved. NEXTDC would have paid the price for the next 20 years had these thorough checks not been performed.
Similarly, primary pumps and the plant needed to be appropriately tuned and balanced based on actual load, as the subcontractors had a tendency to setup equipment to ensure capacity but not for minimal energy consumption. IT loads are very stable, so it is possible to adjust the primary flow rates and still maintain N+1 redundancy, thanks to pump laws—with massive savings on pump energy. The system was designed with pressure independent self-balancing control valves and testing and commissioning sets to ensure scalable, efficient, flow distribution, and high water-side ∆Ts to enable optimal use of water-side free-cooling economization. The challenge then was personally witnessing all flow tests to ensure that the subcontractors had correctly adjusted the equipment. Another lesson learned was that a single flushing bypass left open by a contractor can seriously reduce the return water temperature and prevent the water-side economization system from operating entirely if not tracked down and resolved during commissioning. Hunting down all such incorrect bypasses helped to increase the return water temperature by almost 11ºF (6ºC) for a massive improvement in economization.
Figure 15. Energy saving trends – actual typical results achieved for implementation
Operational tuning through the first year, with the Engineering and facilities management teams comparing actual trends to the theoretical design model provided savings exceeding even NEXTDC’s optimistic hopes. Creating clear and simple procedures with the facilities management teams and running carefully overseen trended trials was critical before rolling out these initiatives nationally. Every single tuning initiative implemented nationally after the facilities go-live date is trended, recorded, and collated into a master national energy savings register. Figure 15 provides just a few examples. Tuning has so far yielded a 24% reduction in the power consumption for mechanical plant with still conservative safety factors. Over time, with additional trend data and machine learning, power consumption is still expected to considerably improve on this via continuous improvement. NEXTDC expects a further 10–20% saving as NEXTDC is on target to operate Australia’s first National Australian Built Environment Rating System (NABERS) 5-star-rated mega data centers.
The design philosophy didn’t end with the electrical and mechanical cooling systems, but also applied to the hydraulics and fire protection systems:
• Rainwater collection is implemented on site to supply cooling towers, which provides additional hours of water most of the year.
• The water tanks are scalable.
• Rainwater collection minimizes mains water consumption.
• VESDA laser optical early detection developed in Australia and licensed internationally was utilized.
• The design completely eliminated water-based sprinkler systems from within the critical IT equipment data
halls, instead utilizing IG55 inert-gas suppression, so that IT equipment can continue to run even if a single server
has an issue (see Figure 16). Water-based pre-action sprinklers risk catastrophic damage to IT equipment that is
not suffering from an over-heating or fire event, risking unnecessary client IT outages.
• The gas suppression system is facility staff friendly, unlike alternatives that dangerously deplete oxygen levels in
the data hall.
• The design incorporates a fully standby set of gas suppression bottle banks onsite.
• The gas suppression bottle banks are scalable.
• The IG55 advanced gas suppression is considered one of the world’s most environmentally friendly gas
suppression systems.
Figure 16. Rainwater, environmentally friendly inert gas fire-suppression and solar power generation innovations
The design of NEXTDC’s data centers is one of the fundamental reasons IT, industrial, and professional services companies are choosing NEXTDC as a colocation data center partner for the region. This has resulted in very rapid top and bottom line financial growth, leading to profitability and commercial success in just a few years. NEXTDC was named Australia’s fastest-growing communications and technology company at Deloitte Australia’s 2014 Technology Fast 50 awards. Mr. Van Zetten said, “What we often found was that when innovation was primarily sought to provide improved resilience and reliability, it also provided improved energy efficiency, better total cost of ownership, and CapEx efficiency. The IP power distribution system is a great example of this. Innovations that were primarily sought for energy efficiency and total cost of ownership likewise often provided higher reliability. The water-side and air-side economization free cooling are great examples. Not only do they reduce our power costs, they also provide legitimate alternative cooling redundancy for much of the year and reduce wear and maintenance on chillers, which improves overall reliability for the long term. “Cold Aisle containment, which was primarily also sought to reduce fan energy, eliminates client problems associate with air mixing and bypassing, thus providing improved client IT reliability.”
Jeffrey Van Zetten
Jeffrey Van Zetten has been involved with NEXTDC since it was founded in 2010 as Australia’s first national data center company. He is now responsible for the overall design, commissioning, Uptime Institute Tier III Certification process, on-going performance, and energy tuning for the B1 Brisbane, M1 Melbourne, S1 Sydney, C1 Canberra, and P1 Perth data centers. Prior to joining NEXTDC, Mr. Van Zetten was based in Singapore as the Asia Pacific technical director for a leading high-performance, buildings technology company. While based in Singapore, he was also the lead engineer for a number of successful energy-efficient high tech and mega projects across Asia Pacific, such as the multi-billion dollar Marina Bay Sands. Mr. Van Zetten has experience in on-site commissioning and troubleshooting data center and major projects throughout Asia, Australia, Europe, North America, and South America.
Switzerland’s First Tier IV Certified Facility Achieves Energy Efficiency
/in Design/by Kevin HeslinTelecommunications company Swisscom AG builds a new data center in Berne, one of seven Tier IV data centers in Europe
By Beat Lauber, Urs Moell, and Rudolf Anker
Swisscom AG, a Switzerland-based telecommunications company, recently built a new data center in Berne, Switzerland. Swisscom spent three years and invested around US$62.5 million to build a highly efficient and reliable data center. Following two years of construction, the new Berne-Wankdorf Data Center was fully operational in January 2015.
The Swisscom Berne-Wankdorf Data Center xDC, Phase 1, is one of only seven data centers in Europe awarded Uptime Institute Tier IV Certification of Constructed Facility and the first in Switzerland. It also has top ratings for energy efficiency, thanks to an innovative cooling concept, and won a 2015 Brill Award for Efficient IT. The new building is the largest of the 24 data centers operated by Swisscom in Switzerland (see Figure 1).
Figure 1. Exterior of Swisscom’s Berne Wankdorf data center, photo Nils Sandmeier
The data center is designed on a modular principle, permitting future expansion whenever necessary. This ensures the required degree of investment security for Swisscom and its customers. The initial stage includes four modules with access areas for personnel and equipment. Swisscom can add capacity as needed, up to a total of seven modules. The data center will house around 5,000 servers and approximately 10,000 customer systems.
MODULAR 2N CONCEPT
Each module in Berne-Wankdorf Data Center has an IT capacity of 600 kW (see Figure 2). Modules A to D, which have a total capacity of 2.4 megawatts (MW), were built in the first phase of construction. Modules E, F, and G are to be built at some point in the future, either individually or in parallel. In addition to the modules for production, an entrance module housing a reception area, a lodge, workstations, and break-out spaces have also been built.
Figure 2. Site layout with extension modules
Two independent cells (electrical power supply and cooling) rated at 150% of the nominal power demand supply each module. This means that either cell can cover the entire power requirement of a module. The initial configuration includes four cells to supply four modules. Additional modules, each with an individual supply cell, can be attached without interruption. The supply is made via two independent paths, providing uninterrupted electricity and cooling.
SITE ARCHITECTURE
The building totals four stories, three above ground and one below ground. Server rooms are located on the ground and first floors (see Figure 3). Fuel and water tanks, as well as storage areas, are located in the basement. Outside air cools the energy supply equipment. For this reason most of the top floor is dedicated to housing building services (see Figure 4). The frame of the building as well as its floors, ceilings, and walls are made primarily from prefabricated sections of concrete (see Figure 5). Only the basement and the sections providing reinforcement for seismic protection are constructed from cast-in-situ concrete. The façade also consists of prefabricated sections of concrete 15 meters (m) high with inlaid thermal insulation. The server rooms do not have visible pillars. Joists 1.05 m high support the ceilings and span 13.8 m above the IT equipment. The space between the joists is used for air movement. Warm air from the server racks is fed through a suspended ceiling to recirculating air coolers. This removes the need for a raised floor in the server rooms (see Figure 6).
Figure 3. Ground floor layout
Figure 4. Second floor layout
Figure 5. Bearing structure
Figure 6. System profile through a server room
EFFICIENT COOLING SYSTEMS
An adiabatic re-cooling system with rainwater enables Swisscom to eliminate mechanical chillers completely. As long as the outside temperature is below 21°C (70°F), the re-cooling units work on dry free cooling. When the temperature rises above 21°C (70°F), water added to the warm air draws out heat through evaporation.
The cooled water from the re-cooling units is then used to supply the CRACs to cool the IT systems. The racks are configured in a Hot Aisle containment cube that keeps the cold supply air and warm exhaust air entirely separate. Warm air from the Hot Aisle is supplied to the recirculating air coolers via a suspended ceiling. This layout means that the majority of the room is on the cool side of the cooling system. As a result, relatively pleasant working conditions are assured, despite relatively warm cooling air (see Figure 7).
Figure 7. Pictorial schematic of the cooling supply
The CRACs are specifically designed to a high cooling water temperature 26° C (79°F) and lowest possible inlet air temperature 28°C (82°F). The exhaust air temperature is 38° C (100°F). With the exception of a small number of damp hot days in the summer, this ecological cooling concept can supply air cooler than 28°C (82°F) all year round.
Retrospective calculations (see Figure 8) based on data from the equipment show that the maximum foreseeable temperature of the supply air would be 30°C (86°F) in the worst-case scenario (full load, failure of an entire supply cell, extreme climate values from the last 20 years).
Figure 8. h-x diagram for air conditions 2005
Rainwater for the adiabatic cooling system is collected from the roof, where there are two separate tanks, each of which can hold enough water to support at least 72 hours of operation. Two separate networks supply water pumper from the two tanks to hybrid recoolers through redundant water treatment systems. The recoolers can be supplied either from the osmosis tank or directly from the rainwater tank. If there is not enough rainwater, water is drawn from the city water network to fill the tanks. During the heating season, the heat produced from the cooling systems heats the building directly. Efficient heat distribution regulates the temperature in the rooms. The data center dissipates the remainder of the waste heat to the local energy supplier’s existing waste heat grid. The thermal energy from grid heats a residential quarter and swimming pools. The more consumers use this energy, the less the hybrid recoolers are operated, whereby a further energy-saving potential is utilized.
NOBREAK UPS
The Wankdorf Data Center does not use batteries but instead deploys SMS NoBreak equipment safeguards the uninterruptible power supply (UPS) using kinetic energy. Should the power supply fail, the NoBreak equipment uses flywheel inertia to ensure that operation continues uninterrupted until the diesel engine-generator sets start up (within seconds) to take over the energy supply (see Figure 9).
Figure 9. NoBreak equipment
EXTENSIVE BUILDING AUTOMATION
Essentially, the building automation system (BAS) comprises two redundant VMWare ESX servers on which the BAS system and an energy management tool are installed. While the building automation system supports all vital functions, the energy management tool is tasked with evaluating and recording energy measurements.
A redundant signalling system provides a back-up solution for alarm signals. The system has its own independent network. All measured values are displayed and recorded. An energy management function analyses the measured values so that energy efficiency can be continuously optimized.
MAXIMUM PROTECTION
From the selection of its location to its specific construction, from its physical protective measures to its advanced security and safety concept, the Berne-Wankdorf Data Center offers the maximum in protection. Access is strictly controlled with a biometric access control system and the site is monitored from a lodge that is staffed around the clock.
Beat Lauber
Beat Lauber is an approved visionary in the field of data center design. He is founding member and CEO of RZintegral AG, a leading Swiss company specializing in data center planning and engineering. His career includes more than 20 years of experience with critical infrastructures and involves notable challenges in design, planning, realization, and project management of large data center projectss. Audits and mandates for strategies complete his list of activities. Mr. Lauber graduated as Architect FH/SIA and made post-graduate studies in Business Administration and Risk Management and is Fire Protection Manager CFPA-E.
Urs Moell
Urs Moell is senior data center designer at RZintegral AG and has acquired a broad knowledge in strategies and layout of critical infrastructures as well as availability, energy efficiency, safety and security. He is in charge of the development and layout, architectural design and the optimal coordination of all trades for best-performance data centers. He graduated as Architect ETH and has 20 years of experience planning buildings as well.
Rudolf Anker
Rudolf Anker is head of Datacenter Management at Swisscom IT, where he has been since 2004. His responsibilities include project manager of new data centers, including planning, lifecycle, and operations. He initiated and provided overall project management for the new DC RZ Future and xDC data center buildings in Zollikofen and Wankdorf).
LG CNS Deploys Custom Cooling Approach in Korean Data Centers
/in Design/by Kevin HeslinIT services provider develops innovative cooling system for use in its own cloud computing data centers
By Jong Wan Kim
LG CNS is a major IT services and solutions provider in Korea. Since 1987, LG CNS has acted as the CIO for LG Group’s affiliates. As of the end of 2014, its data centers provided IT services to LG Group’s affiliates in more than 40 countries, including China, Japan, United States, India, Indonesia, Brazil, Colombia, Malaysia, and several nations in Europe. LG CNS also offers services government, public, and financial sector entities.
LG CNS operates four data centers in Korea and one each in Beijing, Nanjing, New Jersey, and Amsterdam, The Netherlands. Three of its domestic data centers are located in or near Seoul, Korea’s capital; the other one is in Busan, which is located in southeast Korea and is the country’s the second largest city (see Figure 1).
Figure 1. LG CNS data centers worldwide
LG CNS and its operating technicians and potential customers all view energy efficiency as crucial to controlling costs. In recent years, however, rapid developments have dramatically improved IT performance. At the same time, new processors produce more heat, so data centers must provide more space for power and cooling infrastructure. As a result, LG CNS concluded that it needed to develop a cooling system optimized for very dense data centers. They expected that the optimized cooling system would also be more energy-efficient.
LG CNS developed and applied an optimized custom cooling system concept to its new 40-megawatt (MW), 32,321-square-meter (m2) Busan Global Cloud Data Center, which is the largest in Korea. This facility, which opened in 2013, serves as the company’s hub in northeast Asia (see Figure 2). The Busan Data Center can accommodate 3,600 servers at 6 kilowatts (kW) per rack.
Figure 2. Busan Global Cloud Data Center
The Busan Data Center makes use of whole-building, chimney-style hot-air exhaust and a hybrid cooling system (LG CNS calls it a Built-up Outside Air Cooling System) that the company developed to improve upon the energy efficiency it achieved in its existing facilities, which used a packaged-type air conditioning system (existing packaged-type air conditioning system). In addition, LG CNS developed its Smart Green Platform (SGP) software that automatically controls the unique cooling system and other data center components to achieve free cooling for eight months of the year without running chillers. The annual average PUE is estimated to be 1.39, with a minimum of 1.15 in the winter. After seeing positive results at the Busan Data Center, LG CNS decided to apply the cooling system to its Inchon Data Center, which was built in 1992 and was the first purpose-built data center in Korea.
THE BUSAN DATA CENTER SITE
The Busan location provides three advantages to LG CNS: geographic, network connectivity, and proximity to new customers.
• Geographic: Data centers should located be where the risk of natural disasters, especially earthquakes, is low. Korea has relatively little seismic activity, making it a good candidate for data centers. The building is also set on an elevation that is higher than the historic high water levels.
• Network Connectivity: Korea has four active submarine connections: the Busan cable, the Keoje cable, the C2C Basan cable, and Taean cable, which connect to the APCN, APCN-2, C2C, China-US CN, EAC, FNAL/RNAL, FLAG FEA, RJCN, R-J-K, and TPE submarine cable systems. This connectivity positions Busan as an IT hub for Asia-Pacific (see Figure 3).
• New customers: Development plans promise to transform Busan into a global IT hub with many foreign companies accessing its infrastructure resources.
Figure 3: Map of submarine cables serving Busan
COOLING THE BUSAN DATA CENTER
Utilizing cold outside air may be the best way to reduce energy use. From June through September, outside air temperatures near Busan are often greater than 30°C (86°F) and humid, so it cannot be used for cooling (see Figure 4). To meet this environmental challenge, LG CNS developed a system that converts space that normally houses CRAC units into a functional CRAC. Although LG CNS developed the system for its new Busan Data Center, it subsequently applied it to the existing Inchon Data Center. In the existing data center, this transformation involved disassembling the CRACs. In both new and legacy retrofit applications, LG CNS utilized the walls of the CRAC room as CRAC surfaces and its aisles as paths for airflow.
Figure 4. Average annual temperatures in South Korea
EXISTING PACKAGED-TYPE CRACS
The existed packaged-type air conditioning system used in existing LG CNS facilities includes an air supply louver, outside air chamber, air supply duct, mixing chamber, filter, humidifier/cooling coil, and fan. These systems require less space than other systems (see Figure 5-7). The existing packaged-type air conditioning system used at LG CNS facilities has three operating modes that vary by outside temperature. At ≈8–16°C (46-62°F), existing packaged-type CRACs provide additional cooling to supplement the outside air; and when the temperature is more than 16°C (62°F), the CRAC is fully operational and no outside air is supplied. When the temperature is below 7°C (45°F), the system uses 100% outside air and the CRAC is not in operation. This is accomplished by stopping the compressors where dedicated air-cooled DX CRACs are in use and the chillers where chilled water CRAHs are in use. Both types are used in LG CNS facilities. When outside air is supplied only the internal fan of CRAC is required, and when the temperature increases the CRAC begins to operate. In Korea, this system yields 100% compressor savings only from December to February and partial energy savings only from October to November and March to May. Limits to the system include:
• The small air supply duct limits the airflow and requires more fan energy. In addition, the narrow inner space makes it difficult to access for maintenance.
• Winter air in Korea is quite dry, so humidification is required during the winter when 100% outside air cooling is possible. However, the size of the CRAC limits its ability to humidify, which causes inefficiencies.
• The existing packaged-type air conditioning requires space for maintaining plumbing, including pipes and ducts.
Figure 5. Diagram of existing outside air conditioning (air supply louver 110, outside air chamber 120, air supply duct 130, mixing chamber 140, filter 150, humidifier/cooling coil 160, and fan 170.
Figure 6. Plan view of existing packaged-type CRAC
Figure 7. Sectional view of the CRAC
BUILT-UP OUTSIDE AIR COOLING SYSTEM
LG CNS created a task force team (TFT) comprising Operations, cooling system vendors, consulting firms, construction personnel, and other relevant professionals to develop a method of improving the flow of outside air for cooling interior white spaces. The TFT investigated new approaches for approximately 10 months, including pilot testing.
The TFT focused on three things:
• Introducing more outdoor air to the computer room
• Controlling the temperature of the static air supply by mixing outside cold air with the inside heated air
• Controlling the airflow of exhaust hot air by maximizing airflow to the outside.
The main concept that resulted from the investigation involves:
• Utilizing the building floor and ceiling as a duct and chamber
• Customizing the size of the CRAC room walls to meet cooling demands
• Increasing humidification efficiency by making the path that air travels longer after it passes through the cold water coil
• Creating a separate pathway for exhausting hot air
• Utilizing a maintenance space as a duct for the CRAC while it is operating and as a maintenance space when it is not.
The Built-up Outside Air Cooling System applied in LG CNS’s new Busan uses outdoor air and built chimneys to exhaust heat generated by the servers, which reduces energy consumption (see Figure 8). In the company’s existing data centers, the width of the packaged-type CRAC was about 2.5 meters (m). The Built-up Outside Air Cooling System should be 4-5-m wide in order to increase the volume of outside air used for cooling. This change, however, increases the construction costs and the size of the building, which can be a significant expense because of the high cost of real estate in Korea. Saving energy is important, but larger equipment and space requirements for infrastructure can reduce IT white space. To address these issues, the width of the additional space required to supply outdoor air in the Busan Data Center is 3 m.
Figure 8. Architecture of the Built-up Outside Air Cooling System
Figure 9. Sectional view of Built-up Outside Air Cooling System
OA Damper (410): Damper to control the outside air supply
OA Louver (411): Opening to introduce the outside air supply and keep rain and sunshine out RA Damper (420): Damper to control the indoor air
Filter (430): Filter to remove dust from outside and inside
Coil, Humidifier (440): A water mist humidifier to control humidity and a coil for cooling air supplied inside
Main Pipe (450): Pipe to provide supply and return water
Fan (461): Fan for supplying cold air into internal server room
Because of the importance of saving space, LG CNS tested various designs to determine that an S-shaped design would provide the optimum airflow in a small space (see Figure 9). In addition, the system supplies additional outside air using the Built-up Outside Air Cooling System’s internal fan. Care also has to be taken to separate the supply and exhaust air paths to ensure that the mixed air does not come into upper computer room. This task can be complicated in Korea, where most Korean data centers are at least five-stories high. To solve this issue, LG CNS put the cold air supplies on either side of the Busan Data Center and the exhaust in the middle passage to its roof. The company calls it “Chimney,” the wind way (蠾‘).
Figure 10. Built-up Cooling, Pretest Condition
Figure 11. Mock-up testing
MOCK-UP TEST
As soon as the design was complete, LG CNS made a separate testing space to determine how changes in ambient temperature would change temperatures in the computer room and evaluate the SGP software (see Figure 10 and 11). LG CNS also used the space to evaluate overall airflow, which was also satisfactory, because the system utilized the entire CRAC room. Coil static pressure, increased airflow, mixing efficiency, utilization of maintenance space, and humidification efficiency also checked out well, (see Figure 12-14) and it was determined that the overall system would work to extend the period in which outside air could be used. LG CNS expected 19% power savings compared to the existing packaged type CRAC.
Figure 12. Locations of temperature sensors
Figure 13. Airflow and temperature distribution (plan view)
Figure 14. Airflow and temperature distribution (front view)
OPERATION OF BUILT-UP COOLING
The Built-up Outside Air Cooling System has three modes of operation: full outside air mode, mixed mode, and circulation mode. Full outside air mode introduces 100% outside air by means of a damper installed on the building exterior. This mode is used when temperatures are ≈16–20°C (62-68°F) from March to May and September to November. Air enters the building and passes through a mixing chamber without mixing with hot air inside the computer room. If the temperature of the supply air in the computer room is lower than appropriate, the system automatically changes to mixed mode. Full outside air mode was designed to meet LG CNS’s service level agreements (SLA) at outside air temperatures up to 20°C (62-68°F), and LG CNS found that it could maintain Cold Aisle temperatures of 20–21°C (68-70°F) when the supply air was below 20°C (68°F). In fact, LG CNS found that it could still meet its SLAs even when outside air temperatures reached 23°C (73°F). At that outside air temperature the maximum temperature in front of the servers is ≈23–24°C (73-75°F), which still meets LG CNS’s SLAs [23~25°C (73-77 °F) air at the servers]. LG CNS believes that the fast airflow generated by using a whole room as a big CRAC contributes to maximizing cooling from the outside air.
When the ambient temperature is less than 16°C (62°F), the system operates in mixed mode. In this mode of operation, the system of operation mixes outdoor cold air and warm air before introducing it into the computer room. Sensors just inside the building’s outer wall measure the air temperature and adjust the outside damper and the computer room vent dampers to supply air to the computing room at the proper temperature. Circulation mode activates when the outside temperature is greater than 23°C (73°F). At those high temperatures, the outside damper is closed so that no outside air is introduced. Instead air cooled by cold water from the chiller system is introduced into the computer room. By opening the computer room vent dampers 100% while the outside damper remains closed, 4–8°C (39-46°F) cold water from the chiller cools air to the appropriate temperature to supply the computer room.
In Busan, the chiller operates at 100% over 25°C (77°F). Therefore LG CNS sets the optimum temperature data by increasing the temperature of the cooling water from the cooling tower and the temperature of chilled water from the chiller to reduce energy use.
RESULTS
At first there were many doubts about whether Korea’s first Built-up Outside Air Cooling System would reduce energy use, but now many companies view the Busan Data Center as a benchmark. The Built-up Outside Air Cooling System enables LG CNS to use 100% outside air about 8.5 months per year and achieve a PUE of 1.38, which is lower than the design basis PUE of 1.40. The Busan Data Center received the highest rating of A +++ from the Korean Information Technology Service Industry Association (the Association) as a result of a green data center audit. This was the first time a local data center received the Green Data Center Certification since the Association first instituted it in 2012. The Association explained that the amount of electricity saved when the PUE index at a large data center was reduced from 1.80 to 1.40 is equal to the energy that 5,840 ordinary Korean households use for a year (see Figure 15).
Figure 15. PUE at Busan Global Cloud Data Center
APPLICATION OF BUILT-UP AIR COOLING SYSTEM TO AN EXISTING DATA CENTER
LG CNS decided to apply the Built-up Outside Air Cooling System at its Inchon Data Center. It was the first purpose-built data center in Korea in 1992 and has been operating more than 20 years. Energy efficiency is relatively low because the servers are not arranged in a Hot Aisle/Cold Aisle configuration, even though aging power and cooling equipment have been replaced in recent years. Unlike the Busan site, Inchon provided no separate space to build in, since the servers and the CRACs are both in the computing room. As a result LG CNS had to customize the Built-up Outside Air Cooling System. According to power consumption analysis, the existing packaged type system used in the Inchon Data Center accounted for 36% of the facility’s total energy use, the second largest amount after IT. Air-cooled DX CRACs and chilled water CRAHs used in the facility consumed a high percentage of this energy. LG CNS decided to install the Built-up Outside Air Cooling System as an addition to the existing CRAC system. It was not easy to access the outer periphery where the CRAC is installed from the exterior, so LG cut into the exterior wall of the building. There are two types of CRAC units, down-blower and upper-blower type (see Figures 16 and 17).
Figure 16. Model of down (above) and upper blow type (below)
Figure 17. The down (above) and upper blower (below) type of CRACs deployed at the Inchon Data Center
The Built-up Outside Air Cooling System CRAC is installed in a 132-m2 space on the first floor of the Inchon facility. As in the Busan Data Center, the system has three modes, with similar operating parameters (see Figure 18).
Figure 18. Three modes of operation, outside air mode, mixing mode, and circulation mode (top to bottom)
Even though LG CNS had experience with its system in Busan, the Inchon installation had additional risks because all the computer rooms were in operation. Before the construction phase, a preliminary review of expected risks was conducted so as not to affect the existing servers. In order to protect against dust caused by cutting the outside walls from entering the rooms, LG CNS installed medium density fiberboard (MDF). A temporary finish coating both sides of the exterior wall prevented rain from entering the building. When LG CNS connected the new Built-up Outside Air Cooling System to the existing CRAC, it had to turn off power to the existing CRACs. That eliminated all cooling into the server rooms so portable fans were used to provide cooling air. To maintain the proper temperatures during construction, LG CNS operated the backup CRAC and the temperature of the existing CRAC was set lower than baseline. During the pre-test, the system was able to maintain the computer room temperature for the enclosed space without being affected by the ambient airflow in all three operating modes. However, the computer room is an open type, so the amount of cooling supplied and heating from servers differs from area to area. The solution was to optimize cooling by setting individual targets area by area (see Figure 19).
Figure 19. The picture of Inchon data center with built up Built-up Outside Air Cooling System
As the Built-up Outside Air Cooling System CRAC was attached to the inner wall of the computer room, cooling air could not reach the center of the room, so there was a hot spot. Therefore, supply and exhaust vents were installed separately in the center of the room to smooth circulation.
RESULTS AND BENEFITS
As a result of the Inchon retrofit, LG CNS is able to maximize its use of outside air and save 1.9 million kWh in electricity costs. The installation saves LG CNS about US$228,000 in electricity annually, with PUE improving from 1.91 to 1.62 (see Figure 21). There are various methods of improving the efficiency of air conditioning systems and reducing the heat generated in high-density data centers. However, it is much easier to introduce the Built-up Method into a newly built data center than an existing data center, such as the Inchon Data Center. However, LG CNS, through advance planning and risk prevention activities, managed the feat.
Figure 20. 100% IT power change when outside air supplied
Figure 21. PUE before and after Built-up Outside Air Cooling System
ONGOING COMMITMENT
When LG CNS first started planning the Busan Data Center, it built on four main pillars: efficiency, reliability, scalability, and security. And all four goals were integral to achieving overall sustainability. These pillars are the foundations of the data center and ensure that they are able to meet customer needs now and in the future. With that commitment, LG CNS has worked to accumulate technologies in energy efficiency and continue to make efforts to reduce energy use.
Jong Wan Kim
Jong Wan Kim is vice president of the LG CNS Infrastructure Unit. He has more than 25 years experience in data center management, distributed systems, and system integration projects. He has implemented operational innovations in the company’s data centers and focused on maximizing productivity based on automation in its next generation data center. Since 2010, Mr. Kim has been president of Data Center Associates, which comprises 28 domestic data center executives. He has consulted the government regarding data center-related policies and encouraged the exchange of technical information among national data centers operators to raise local standards to the global level. More recently, Mr. Kim has concentrated on providing platform-based infrastructure services, including software-defined data centers and cloud computing in distributed computing environments.